Message from the APIEMS President
Greeting and a warm welcome to the participants of the 15th Asia Paciic Industrial Engineering and Management Systems Conference. Started in 1998, APIEMS has grown to become the premier conference for industrial engineering and management systems in the region with participants from all around the world. The main theme of this year conference: “Sustainable Industrial Systems and Big Data Management”, is an attempt to address the balance among economic and technical devel-opment, social develdevel-opment, and environmental protection in this fast changing world.
I congratulate and thank Prof. Dr. Chi-Hyuck Jun, the conference chair, whose leadership made this APIEMS 2014 conference possible. We are also grateful for the enthusiastic support of APIEMS from the KIIE and the Korea research community.
On behave of the Asia Paciic Industrial Engineering and Management Society, I wish you a suc -cessful conference with many thoughtful discussions and debates with old and new friends.
Professor Voratas Kachitvichyanukul APIEMS President, (2013-2014)
Message from the General Chair
Welcome to APIEMS 2014 in Jeju City, a beautiful island located at the most south of Korea. It is our great pleasure to organize this conference, which is supported by Korean Institute of Industrial Engineers (KIIE). APIEMS conferences have rapidly emerged as an important forum for exchange of ideas and information about latest developments in the ield of industrial engineering and man -agement systems among professionals mostly from Asia-Paciic countries. APIEMS 2014 confer -ence encourages contributors to address the topical theme: Sustainable Industrial Systems and Big Data Management. Papers will represent the latest academic thinking and successful case examples. The wider audience will beneit from the knowledge and experience of leading practitioners and academics in this area.
The conference seeks research contributions from researchers, educators, modelers, software devel -opers, users and practitioners. We hope that you enjoy participating in APIEMS 2014 and staying in Jeju.
Professor Chi-Hyuck Jun General Chair, APIEMS 2014
Conference Committee Members
Conference Committee
• Conference Chair
• Chi-Hyuck Jun (POSTECH, Korea)
• Honorary Chairs
• Hark Hwang (KAIST, Korea)
• Mooyoung Jung (UNIST, Korea)
• Kap Hwan Kim (Pusan National Univ., Korea; President, KIIE)
• Conference Co-Chairs (International Advisory Board)
• Abdul Hakim Halim (InstitutTeknologi Bandung, Indonesia)
• Anthony Shun Fung Chiu (De La Salle University, Philippines)
• Baoding Liu (Tsinghua University, China)
• Bernard Jiang (National Taiwan University of Science and Technology, Taiwan)
• C. J. Liao (National Taiwan University of Science and Technology, Taiwan)
• Che-Fu Chien (National Tsing Hua University, Taiwan)
• Du-Ming Tsai (Yuan Ze University, Taiwan)
• ErhanKozan (Queensland University of Technology, Australia)
• HirokazuKono (Keio University, Japan)
• Jin Peng (Huanggang Normal University, China)
• Jinwoo, Park (Seoul National Univ., Korea)
• Katsuhiko Takahashi ( Hiroshima University, Japan)
• Kazuyoshi Ishii (Kanazawa Institute of Technology, Japan)
• Kin Keung Lai (City University of Hong Kong, Hong Kong)
• Mao Jiun Wang (National Tsing Hua Univeristy, Taiwan)
• Min K. Chung (POSTECH, Korea)
• Mitsuo Gen (Fuzzy Logic Systems Institute, Japan)
• P. L. Chang (Feng Chia Uni)
• Shouyang Wan (Chinese Academy of Sciences, China)
• Tae Eog Lee (KAIST, Korea)
• Takashi Oyabu (Kanazawa Seiryo University, Japan)
• Yon-Chun Chou (National Taiwan University, Taiwan)
• Young Hae Lee (Hanyang University, Korea)
• ZahariTaha (Universiti Malaysia Pahang, Malaysia)
Organizing Committee
• Technical Program Chairs
• Il-Kyeong Moon (Seoul National Univ., Korea)
• Byung-In Kim (POSTECH, Korea)
• Publication Chairs
• Jaewook Lee (Seoul National Univ., Korea)
• Hosang Jung (Inha Univ., Korea)
• Publicity Chairs
• Chulung Lee (Korea Univ., Korea)
• Yoo-Suk Hong (Seoul National Univ., Korea)
• Sponsorship Chairs
• Minseok Song (UNIST, Korea)
• Young Jin Kim (Pukyong National Univ., Korea)
• Exhibition Chairs
• Hyunbo Cho (POSTECH, Korea)
• Yonghui Oh (Daejin Univ., Korea)
• Finance Chair
• Dong-Ho Lee (Hanyang Univ., Korea)
• Award Chairs
• Kyung sik Lee (Seoul National Univ., Korea)
• Young Jae Jang (KAIST, Korea)
• Local Arrangement Chair
Conference Sponsors
The Korean Federation of Science
and Technology Societies
DOOSAN
SAS KOREA
Pohang University of Science
and Technology
The Korean Operations Research
and Management Science Society
Keynote Speech
Keynote Speech I
Research Issues in Future Logistics
Oct 13 (Monday) 11:00-12:00
Room: Ramada-1
Chung– Yee Lee
Hong Kong University of Science and Technology, China
Dr. Chung-Yee Lee is Chair Professor/Cheong Ying Chan Professor of Engineering in the Depart -ment of Industrial Engineering & Logistics Manage-ment at Hong Kong University of Science and Technology. He served as Department Head for seven years (2001- 2008). He is also the Founding and Current Director of Logistics and Supply Chain Management Institute. He is a Fellow of the Institute of Industrial Engineers in U.S. and also a Fellow of Hong Kong Academy of Engineering Science. Before joining HKUST in 2001, he was Rockwell Chair Professor in the Department of Industrial Engineering at Texas A&M University. He worked as a plant manager and also had few years consulting experience in Taiwan. In the past thirty years he has engaged in more than forty research projects sponsored by NSF, RGC, ITF, IBM, Motorola, AT&T Paradyne, Harris Semicon ductor, Northern Telecom, Martin Marietta, Hong Kong Air Cargo Terminal, Hongkong Interna -tional Terminal, Philips Medical, ...,etc.
His search areas are in logistics and supply chain management, scheduling and inventory manage -ment. He has published more than 130 papers in refereed journals. According to an article in Int. J. Prod. Eco. (2009), which looked at all papers published in the 20 core journals during last 50 years in the ield of production and operations management, he was ranked No. 6 among all researchers worldwide in h-index.
Keynote Speech
Keynote Speech II
Data-Driven Decision Making in Manufacturing:
Lessons Learned and Future Opportunities
Oct 14 (Tuesday) 11:00-12:00
Room: Ramada-1
Ronald G. Askin
Arizona State University, USARonald G. Askin, Ph.D., is a Professor of Industrial Engineering and Director of the School of Computing, Informatics, and Decision Systems Engineering at Arizona State University. Professor Askin received his B. S. in Industrial Engineering from Lehigh University followed by an M.S. in Operations Research and PhD in Industrial and Systems Engineering from the Georgia Institute of Technology. He has over 30 years of experience in the development, teaching and application of methods for systems design and analysis with particular emphasis on production and material low systems. Other interests include quality engineering and decision analysis. He has published over 120 journal and conference proceedings papers in these areas.
Keynote Speech
Keynote Speech III
Big Data Management
Oct 14 (Tuesday) 13:00-14:00
Room: Ramada-1
Sungzoon Cho
Seoul National University, Korea.
Conference at a Glance
Oct 12 (Sunday) Oct 13 (Monday) Oct 14 (Tuesday) Oct 15 (Wednesday)
08:00-17:00 Registration
08:00-17:00 Registration 08:00-12:00 Registration
08:30-10:10 Technical sessions
MA 08:30-10:10
Technical sessions WA
08:40-10:40 Technical sessions TA
10:00-18:00 Registration
10:10-10:30 Coffee break 10:10-10:30 Coffee break
10:30-11:00
Opening addresses : APIEMS President,
KIIE President, General Chair
10:30-12:10 Technical sessions WB 10:40-11:00 Coffee break
11:00-12:00
Keynote speech I (Prof. Chung-Yee Lee:
Research issues in Future Logistics)
11:00:12:00
Keynote speech II (Prof. Ronald Askin: Data-Driven Decision
Making in Manufacturing)
13:00-17:20 Excursion
12:00-13:30 Lunch 12:00-13:00 Lunch 12:10-13:30 Lunch
13:30-15:30 Technical sessions MB
13:00-14:00
Keynote speech III (Prof. Sungzoon Cho:
Big Data Management)
14:00-14:20 Coffee break
14:20-16:00 Technical sessions TB 15:30-15:50 Coffee break
15:50-17:50 Technical sessions MC
16:00-16:20 Coffee break
Registration
16:20-18:00 Technical sessions TC
13:00-18:00 Poster Session
18:00-20:00 Welcome
Oct 12 (Sunday)
10:00-18:00 Registration
13:00-17:20 Excursion
18:00-20:00 Welcome Reception
Oct 13 (Monday)
08:00-17:00 Registration
Room Mara Biyang Udo Chuja Ramada-1 Ramada-2 Ramada-3 Ramada-4 Halla(8F)
08:30-10:10 Technical sessions MA
MA1 MA2 MA3 MA4 MA5 MA6 MA7 MA8 MA9
Session
name Data Mining 1
Management of Technology and Innovations 1 ERP/ E-Business Service Sciences 1 Quality Engineering & Management 1 Production and Operations Management 1
Metaheuristics Models & Financial Engineering
Uncertainty Theory
(Ses-sion I)
Paper #
528 100 37 54 23 75 42 41 551
207 111 38 55 28 158 43 146 555
276 143 352 108 109 211 175 180 556
324 44 360 215 113 269 353 267 584
296 97 255 244 226 213 465 273
10:10-10:30 Coffee break
10:30-11:00 Opening addresses: APIEMS President, KIIE President, General Chair
11:00-12:00 Keynote speech I (Prof. Chung-Yee Lee: Research Issues in Future Logistics)
12:00-13:30 Lunch
13:30-15:30 Technical sessions MB
MB1 MB2 MB3 MB4 MB5 MB6 MB7 MB8 MB9
Session name Decision Sup-port Systems & Expert Systems Probability & Statistical Modeling Ergonomics/ Human Factors 1 Service Sciences 2 Quality Engineering & Managment 2 Production and Operations Management 2 Green Manufacturing/ Management Transportation Ergonomics & Welfare Man-agement Paper #
173 190 96 322 227 338 417 73 488
254 299 131 401 228 362 550 91 484
290 333 305 411 229 394 119 103 530
460 334 315 479 346 396 156 312 485
116 3354 326 504 294 442 342 340 471
538 450 332 323 307 361 53 505
15:30-15:50 Coffee break
15:50-17:50 Technical sessions MC
MC1 MC2 MC3 MC4 MC5 MC6 MC7 MC8 MC9
Session
name Management 1Supply Chain MaintenanceReliability &
Ergonomics/ Human Factors 2 Network Optimization Quality Engineering & Management 3
Simulation 1 Healthcare Systems 1 Techniques 1Optimization
Educational Support System
Paper #
252 118 456 407 325 500 482 374 501
261 121 359 363 328 196 99 217 562
279 153 393 268 339 424 112 201 448
280 320 419 515 346 66 194 169 455
355 580 449 319 370 179 248 206 154
Oct 14 (Tuesday)
08:00-17:00 Registration
Room Mara Biyang Udo Chuja Ramada-1 Ramada-2 Ramada-3 Ramada-4 Halla(8F)
08:40-10:40 Technical sessions TA
TA1 TA2 TA3 TA4 TA5 TA6 TA7 TA8 TA9
Session
name Management 2Supply Chain Communication Support Data Mining 2
Tourism Management/
Topics in IE/MS
Sustainable
Management Simulation 2
Production & Operations Management 1 Logistics Management Uncertainty Theory (Session II) Paper #
50 443 128 472 35 98 282 440 558
59 535 147 444 114 105 327 477 559
60 489 203 564 136 221 349 483 560
61 536 392 15 137 272 431 543 561
130 480 412 264 291 295 104 344 565
161 537 216 225 347 356 218 313 428
10:40-11:00 Coffee break
11:00-12:00 Keynote speech II (Prof. Ronald Askin: Data Driven Decision Making in Manufacturing)
12:00-13:00 Lunch
13:00-14:00 Keynote speech III (Prof. Sungzoon Cho: Big Data Management)
14:00-14:20 Coffee break
14:20-16:00 Technical sessions TB
TB1 TB2 TB3 TB4 TB5 TB6 TB7 TB8 TB9
Session name Supply Chain Management 3 Management of Technology and Innovations 2
Data Mining 3 Sequencing 1Scheduling & Knowledge & Information Management Production & Operations Management 2 Healthcare Systems 2 Flexible Manufacturing Systems
Topics in IE/MS
Paper #
165 188 437 122 250 49 95 579 575
176 425 469 233 278 124 106 48 354
208 317 486 284 445 151 306 62 378
160 150 502 287 297 187 379 286 212
234 22 581 309 389 12 76 457 202
16:00-16:20 Coffee break
16:20-18:00 Technical sessions TC
TC1 TC2 TC3 TC4 TC9
Session name
Heuristics/Me-taheuristics
Inventory
Mod-eling / Artiicial
Intelligence
Artiicial Intel -ligence Scheduling & Sequencing 2 Lean Produc-tion Manage-ment Paper #
70 381 182 399 542
464 123 260 405 546
481 101 490 418 94
520 318 391 398 545
192 499 79 547
13:00-18:00 POSTER Session
Paper #
47 149 166 204 220 245 253 265 205
365 366 382 400 414 422 432 435 524
451 473 487 522 527 491 420 145
Oct 15 (Wednesday)
08:00-12:00 Registration
Room Mara Biyang Udo Chuja Ramada-3 Ramada-4 Ramada-1 Ramada-2
08:30-10:10 Technical sessions WA
WA1 WA2 WA3 WA4 WA5 WA6
Session name
Inventory Mod-eling &
Manage-ment
SCM and Forecasting 1
Production Design & Management 1
Scheduling &
Sequencing 3 Fuzzy Logic Techniques 2Optimization
Paper #
65 92 117 85 30 125
80 31 162 120 58 69
71 34 198 177 224 288
446 32 222 316 576 577
518 102 249 509 415
10:10-10:30 Coffee break
10:30-12:10 Technical sessions TB
WB1 WB2 WB3 WB4 WB5 WB6
Session name
Industrial Engineering
Education
SCM and Fore-casting 2
Production Design & Management 2
Scheduling & Sequencing 4
Quality Engineering &
Reliability
Lean Manufacturing
Paper #
526 52 283 329 453 129
139 36 348 46 508 371
256 87 350 403 270 553
495 413 93 426 517 110
84 454 421 516
Floor Plan
8F
Tamna Hall
Ora Hall
Ara Hall
Halla Hall
Technical
Session(10/13~14)
Ballroom Lobby
2F
Registration
Technical Session
Ramada Ballroom −> Banquet
Ramada 2,3,4 −> Welcome Reception Ramada 1,2,3,4 −> Technical Session
Ramada
Ballroom
Mara Hall
Biyang Hall Chuja Hall Udo Hall
Poste r Se
Proceedings of the Asia Pacific Industrial Engineering & Management Systems Conference 2014
1
Analysis and Proposal about the Effect of Time, Types of
Subject and Types of Room Factor
to the Students’ Concentration
Elty Sarvia
Department of Industrial Engineering Maranatha Christian University, Bandung, Indonesia Tel: (+62) 22-2012186 ext 1262/1276, Email : [email protected]
Evan Pratama Sentosa Department of Industrial Engineering Maranatha Christian University, Bandung, Indonesia
Tel: (+62) 22-2012186 ext 1262/1276, Email: [email protected]
Abstract. Decreasing of the learning concentration was defined as a decreasing ability to concentrate on learning activity which was reflected through one's behavior (Ahmadi Abu, 2003). This condition affects a person's understanding. This study aimed to analyze the effect of time, types of subject and types of room factor to the decrease of students’ concentration in learning and analyze the maximum point of the students to concentrate in learning and propose ergonomic systems (GWM H02C05 room and H02A07 room, Department of Industrial Engineering, Maranatha Christian University, Bandung).
Data that were collected in this study were Visual Analogue Scale, Group Bourdon Test and field observations with 48 total respondents. The further observations were processed using ANOVA test with between-subjects design (3-ways interaction)
ANOVA test results showed that the time factor and the types of subject factor affected to the learning concentration of students. Types of room factor did not affect to the learning concentration of students. The result of Visual Analogue Scale, Group Bourdon Test and observations gave the same result, that learning concentration of the students was decreased. The proposals that could be given were doing a good course scheduling such as mathematical subject should be placed in the morning time (at 07.00 am - 11.00 am) and theoretical subjects placed on the day time(at 11.00 am - 03:00 pm).
Keywords: time, types of subject, types of room factor, VAS, Group Bourdon Test
1. INTRODUCTION
If the decrease of the learning concentration was further reviewed, it would lead to misunderstanding and ignorance about the learning materials, which was essentially a student must know and understand the learning material provided by an institution, so that there will be a change in behavior in the learning process that exist (Moh. Surya, 1977). Thus, it could be said that the level of understanding in learning was affected by the learning concentration. If there was a decrease in the learning concentration, then there was a decrease in the ability to concentrate on learning activities (Ahmadi Abu,
2003). This condition was reflected from each of the behavior which is an indicator of a persons’ psychological. The decrease of the students’ learning concentration was affected by various factors, including the time, type of subject and type of room factor.
Researchers determined the initial hypothesis based on the results of preliminary processing of the data questionnaire that had been distributed by the researchers to the students and also the results of the interviews conducted by researchers introduction. Thus, the following hypothesis were proposed:
Sarvia and Sentosa
1. H1A : There was an effect for students’ learning
concentration from time factor (Factor A).
2. H1B : There was an effect for students’ learning
concentration from type of subject factor (Factor B). 3. H1C : There was an effect for students’ learning
concentration from type of room factor (Factor C). 4. H1AB : There was an effect for students’ learning
concentration from the interaction between the time factor and type of subject (AB Factor Interactions). 5. H1AC : There was an effect for students’ learning
concentration from the interaction between the time factor and type of room factor (AC Factor Interactions)
6. H1BC : There was an effect for students’ learning
concentration from the interaction between the type of subject and type of room factor (BC Factor Interactions)
7. H1abc : There was an effect for students’ learning
concentration from the interaction between time factor, type of subject factor and type of room factor (ABC Factor Interactions)
8. H 1 : Maximum point (how long (in hours) a student
would be able to concentrate) students’
concentration on learning was set as 1 hour from the beginning of learning process.
The limitations of this study were as follows :
Participants who became the object of research were the student of Industrial Engineering Department, Faculty of Engineering, Maranatha Christian University.
The total number of respondents would be observed in this study were 6 respondents for each interaction, which the total of the interactions were 8.
The independent variable was only based on the time of factor, type of subject and type of room factor to know a decrease in the concentration of student learning. Other independent variables such as age, gender, consumption and health conditions, physical work environment, the level of understanding and ability of students, lecturers way of explanation and exposure, psychological receiver and so on, did not discussed in this study.
2. RESEARCH METHOD
The independent variables used by researchers in the study are:
The time factor (Factor A), which consists of two levels as before lunch and after lunch conditions.
Type of subject factor (Factor B) which consists of two levels as mathematical and theoretical subjects.
Type of room factor (Factor C) which consists of two levels as H02C05 and H02A07 room (Graha Widya Maranatha).
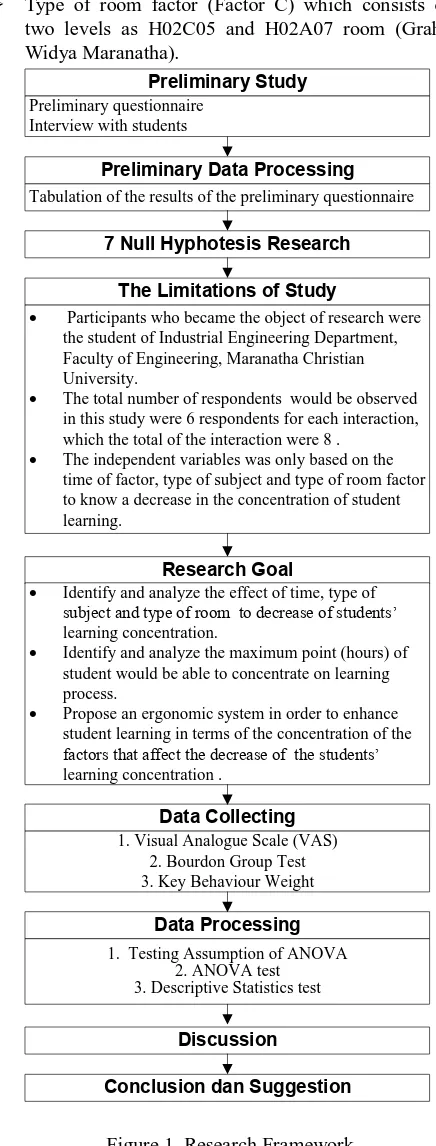
Preliminary Study
Preliminary questionnaire Interview with students
Preliminary Data Processing
Tabulation of the results of the preliminary questionnaire
Data Collecting
1. Visual Analogue Scale (VAS) 2. Bourdon Group Test 3. Key Behaviour Weight
The Limitations of Study
Participants who became the object of research were the student of Industrial Engineering Department, Faculty of Engineering, Maranatha Christian University.
The total number of respondents would be observed in this study were 6 respondents for each interaction, which the total of the interaction were 8 .
The independent variables was only based on the time of factor, type of subject and type of room factor to know a decrease in the concentration of student learning.
Research Goal
Identify and analyze the effect of time, type of
subject and type of room to decrease of students’
learning concentration.
Identify and analyze the maximum point (hours) of student would be able to concentrate on learning process.
Propose an ergonomic system in order to enhance student learning in terms of the concentration of the
factors that affect the decrease of the students’
learning concentration .
7 Null Hyphotesis Research
Data Processing
1. Testing Assumption of ANOVA 2. ANOVA test
3. Descriptive Statistics test
Discussion
Conclusion dan Suggestion
Figure 1. Research Framework
Sarvia and Sentosa
Table 1. Key Behavior
Figure 2. Data Collecting Scheme
3. DATA COLLECTION
Data collecting for the Visual Analogue Scale (VAS) was a data collecting carried out by the researcher to
obtained students’ concentration conditions in a
subjectively manner because measuring the perceived level of concentration of an individual at the time.
Visual Analogue Scale (VAS) is a measurement instrument that tries to measure a characteristic or attitude that is believed to range across a continuum of values and cannot easily be directly measured. For example, the amount of pain that a patient feels ranges across a continuum from none to an extreme amount of pain. Operationally a VAS is usually a horizontal line, 100 mm in length, anchored by word descriptors at each end, as illustrated in Figure 3. The VAS score is determined by measuring in millimetres from the left hand end of the line to the point that the patient marks. The visual analogue scale (VAS) has been reported to be the most standardized,
valid and easy to comprehend self-report pain assessment instrument. (Gould et al, 2002).
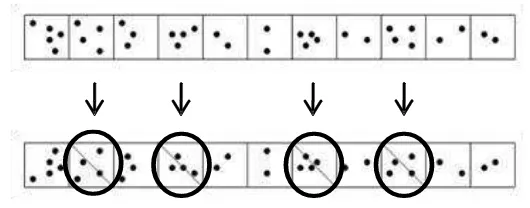
Group Bourdon Test is a train driver concentration test. It is also knows as dot cancellation test. This test based train driver psychometric used to maintain vigilance, speed, accuracy, and concentration while looking a group of 4 dots.
Data collection for Group Bourdon Test is a data collection conducted by researchers to obtain students’ concentration condition in a objectively manner, by measuring objectively and calculating mathematically about one’sconcentration level.
Data Collecting in a subjectively-objectively manner by :
a. Measurement of the respondents conducted by the makers of observation data through behavior of the respondents (subjective). Weighting on the indicator of this research conducted individually by each
1 Eyes looked at the left side or right side (turning to the left or right) 2 Eyes looked at downward (head down or asleep) 3 Blank stare (eyes) or daydreaming
1 Pay attention to other things (attention to others conversation or to outside of classroom) 2 Concentration focused to an object
3 VERBAL RESPONSE 1 Did not give a response (question) as oral speech (verbal response) from lecturer
4 DISCLAIMS OR COMPARE -
-5 ANSWER 1 Answering questions negatively (deviate from the problem) or doubtful (uncertain) 6 REPRESENTATION (STATEMENT) 1 Not responding when lecturer asked to respond
1 The position of the body which indicated unpreparedness in learning
2 Yawning
3 Conduct activities outside the classroom that does not mean
4 Rubbing eyes (sleepy)
5 Blinking eyes very often
6 Did not give a response (movement) as a psychomotor response from lecturer 7 No meaning hand gestures
8 EXPRESSIVE RESPONSES 1 Did not have motivation to listen to the lecturer
1 FOCUS VIEWS
2 ATTENTION CONCENTRATION
7 PSYCHOMOTOR RESPONSE
Sarvia and Sentosa
Figure 3. Visual Analogue Scale (VAS) Figure 4. Group Bourdon Test
respondent due to the weight of one with the other respondents will create different results.
b. Measurement of behavior of the respondents through the key behavior (objective) shown in table 1.
Figure 2 illustrates a data collection scheme conducted by researchers of the 48 respondents :
Before Treatment : Data collection was performed outside the classroom before the lecture begins by using initial Visual Analogue Scale (VAS) and initial Group Bourdon Test.
During Treatment : Data collection was performed by observations in the classroom. Initial benchmark of this observation is the key behavior that have been described previously (Table 1)
Post Treatment : Data collection was performed outside the classroom after the lecture is finished by using the Final Visual Analogue Scale (VAS), Final Group Bourdon Test and weights of key behavior.
4. RESULT AND DISCUSSION
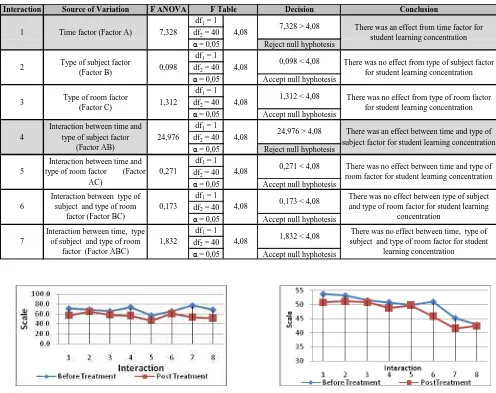
The overall condition of the concentration of respondents (using the Visual Analogue Scale: subjective) before treatment was higher than the post treated condition as shown in figure 5. The overall condition of the concentration of respondents (using the Group Bourdon Test : objective) before treatment was higher than the post-treated conditions as shown in figure 6. Table 2 showed the results of the data collection which were performed by the researchers could be concluded as an eligible data for ANOVA test (the data is independent, normal distribution and homogeneous). Table 3 showed the results of the ANOVA test (used by researchers to answer the initial research hypothesis 1 to hypothesis 7), it could be concluded that there are only 2 factors that affected student learning decreased concentration i.e. the time factor and interaction between time and type of subject factor using 0.05.
This research found that from the three methods, i.e Visual Analogue Scale (VAS) ratings, Group Bourdon Test
and ANOVA test, all had the same conclusion (Table 4). The conclusion was there was an effect for students’ concentration (there was a significant decrease from
students’ learning concentration prior student learning
activities in the classroom to the students’ learning
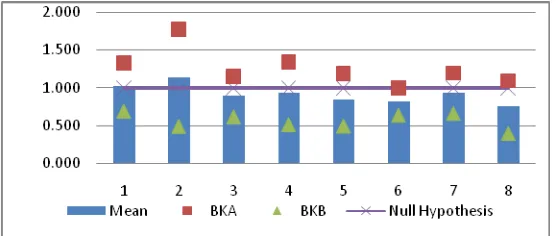
concentration after learning activities in the classroom). Descriptive statistics of test results (used by researchers to answer the initial research hypothesis 8), it showed that the maximum point required for students to concentrate is between 0,750 first hours to 1,139 first hours of their learning process, with a standard deviation 0,178 hours up to 0.643 hours.
So it could be concluded that the maximum point for
the students’ learning concentration required was
approximately 1 hour starting from the beginning of the first lecture as shown in figure 7.
From the data processing and analysis result, therefore it was suggested an ergonomic system to enhance the
student’s learning concentration as follow:
a. Allocating particular subjects on certain period
within student’s class time table such as
mathematical subjects should be placed in the morning time (7.00 am – 11.00 am) and theoretical subjects placed on the day time (11.00 am- 3.00 pm).
b. Notice the condition of the maximum point of students in learning, approximately the first 1 hour lecture. Lecturer should be able to regain
students’ concentration by setting their tone up and
down during the lecture or designing games for the lecture so that students are not bored or sleepy. c. Changing the 3-credits-course (2 hours 30 minutes)
which only held in one class meeting, became two classes meeting. (1 hour 40 minutes at the first class meeting and 50 minutes at the second class meeting).
d. Hence, for the 2-credits-course (1 hour 40 minutes) would remain as it is, according to in accordance with the conditions of the initial conditions of the Industrial Engineering Department, Maranatha Christian University.
Sarvia and Sentosa
Table 2. Testing Assumption of Anova
Table 3. Result of Anova Test with between-subject design
Figure 5: Visual Analogue Scale (VAS) Figure 6: Group Bourdon Test
Independence test Durbin-Watson Comparison Decision Conclusion
1,5 - (1,525) - 2,5 Accept Null hyphotesis
Normality test Shapiro-Wilk Comparison Decision Conclusion
(0,084) > 0,05 Accept Null hyphotesis
Homogeneity test Levene Test Comparison Decision Conclusion
(0,221) > 0,05 Accept Null hyphotesis
(0,198) > 0,05 Accept Null hyphotesis
(0,191) > 0,05 Accept Null hyphotesis Time, type of subject and type of room
factor 1,525 1,5 - 2,5
There are no differences between the populations
Time factor 0,221 0,05 Variables are homogeneous Time, type of subject and type of room
factor 0,084 0,05 Normal distribution
Type of sucject factor 0,198 0,05 Variables are homogeneous
Type of room factor 0,191 0,05 Variables are homogeneous
Interaction Source of Variation F ANOVA Decision Conclusion
df1 = 1
df2 = 40
α = 0,05 Reject null hyphotesis df1 = 1
df2 = 40
α = 0,05 Accept null hyphotesis df1 = 1
df2 = 40
α = 0,05 Accept null hyphotesis df1 = 1
df2 = 40
α = 0,05 Reject null hyphotesis df1 = 1
df2 = 40
α = 0,05 Accept null hyphotesis df1 = 1
df2 = 40
α = 0,05 Accept null hyphotesis df1 = 1
df2 = 40
α = 0,05 Accept null hyphotesis
There was an effect from time factor for student learning concentration F Table
Time factor (Factor A) 7,328 4,08 7,328 > 4,08
Type of room factor
(Factor C) 1,312 4,08
1,312 < 4,08 There was no effect from type of room factor for student learning concentration Type of subject factor
(Factor B) 0,098 4,08
0,098 < 4,08 There was no effect from type of subject factor for student learning concentration
There was no effect between type of subject and type of room factor for student learning
concentration Interaction between time and
type of subject factor (Factor AB)
24,976 4,08 24,976 > 4,08 There was an effect between time and type of subject factor for student learning concentration
1,832 < 4,08 There was no effect between time, type of subject and type of room factor for student
learning concentration 1 2 3 4 5
Interaction between time and type of room factor (Factor
AC)
0,271 4,08 0,271 < 4,08 There was no effect between time and type of room factor for student learning concentration
Interaction between type of subject and type of room
factor (Factor BC)
0,173 4,08 0,173 < 4,08 6
7
Interaction between time, type of subject and type of room
factor (Factor ABC)
1,832 4,08
Sarvia and Sentosa
Figure 7 : Maximum Point of the Students’ Learning Concentration (hours) \
Table 4. Analysis of Three Methods
5. CONCLUSION
From Visual Analogue Scale graphic and Group Bourdon Test graphic, there was a significant decrease from
students’ learning concentration prior student learning activities in the classroom to the students’ learning
concentration after learning activities in the classroom. Based on Anova Testing and analysis result, it was found the conclusion that there were 2 factors that affected the
students’ learning concentration decrease, which was a
factor of time (Factor A) and the interaction between the time factor and the type of subject factor (AB Factor Interactions). Based on descriptive statistics analysis, students were still able to concentrate on studying for 1 hour (maximum 1,139 hours) in accordance with the initial hypothesis of the study).
The recommendations that were given to the Department of Industrial Engineering, Faculty of Engineering, Maranatha Christian University, Bandung, Indonesia such as allocating particular subjects on certain
period within student’s class time table
;
Lecturer should beable to regain students’ concentration by setting their tone
up and down during the lecture or designing games for the lecture so that students are not bored or sleepy; Changing the 3-credits-course became two classes meeting.
REFERENCES
Ahmadi, Abu., Supriyono, Widodo. (2003) Psikologi Belajar, Jakarta, PT Rineka Cipta
Bridger, S R. (2003) Introduction To Ergonomics, Taylor and Francis Group.
Cognitive Ergonomic, accessed on 15th February 2013, http://en.wikipedia.org/wiki/Cognitive_ergonomics, Dot Cancellation Test, accessed on 13th February 2013,
http://en.wikipedia.org/wiki/Dot_cancellation_test. Pengertian Ergonomi Kognitif, accessed on 18th December
2012, ,
http://ergonomikognitif.blogspot.com/2011/12/pengerti an-ergonomi-kognitif.
Ghozali, Imam G. (2006) Aplikasi Analisis Multivariate Dengan Program SPSS, Universitas Diponegoro Gould DJ, Kelly D, Goldstone L and Gammon (2002)
Examining the validity of pressure ulcer risk assessment scales: developing and using illustrated patient simulations to collect the data. J Clin Nurs 697-706. Halim, Winda. (2012) Evaluasi Penggunaan Psychomotor
Vigilance Task Dalam Konteks Pengukuran Beban Kerja Mental, Tesis Magister, Program Studi Teknik dan Manajemen Industri, Institut Teknologi Bandung.
Data Collection Method Conclusion Final Conclusion
Subjective Visual Analogue Scale (VAS)
There was an effect for students’
concentration before treatment and after treatment
There was a significant
decrease from students’
learning concentration prior student learning activities in
the classroom to the
students’ learning
concentration after learning activities in the classroom Objective Group Bourdon Test
There was an effect for students’
concentration before treatment and after treatment
Subjective-Objective Observation in the classroom
There was an effect for students’
concentration before treatment and after treatment
Sarvia and Sentosa
Helander, Martin. (2006) A Guide To Human Factors And Ergonomics, Taylor and Francis Group.
Martin, W David. (1996) Doing Psychology Experiments, Fourth Edition? North Carolina State University, Brooks/ Cole Publishing Company.
Pengertian dan Ciri-Ciri Konsentrasi, accessed on 15th February 2013,
http://abudaud2010.blogspot.com /2010/11/pengertian-dan-ciri-ciri-konsentrasi.html.
Pengertian Ergonomi, accessed on 15th February 2013, http://sobatbaru.blogspot.com/2010/03/pengertian-ergonomi.html.
Psikologi Kognitif, accessed on 15th February 2013, http://elib.unikom.ac.id/download.php?id=86119. Reed, K Stephen (2011) Kognisi, Teori dan Aplikasi
(Cognition, Theory and Application), Jakarta: Salemba Humanika.
Setianingrum, Yeni, Ajeng. (2010) Pengaruh Penggunaan Telepon Genggam Selama Berkendara Terhadap Waktu Reaksi Pengemudi Dalam Keadaan Lelah (Studi Kasus Jalan Bebas Hambatan), Tesis Magister, Program Studi Teknik dan Manajemen Industri, Institut Teknologi Bandung.
Teori Konsentrasi Belajar, accessed on 15th February 2013, http://ilmukata.blogspot.com/2013/01/teori-konsentrasi-belajar.html.
Train Driver Group Bourdon Test, accessed on 15th February 2013,
http://www.careervidz.com/train-driver-group-bourdon-test.html.
Visual Analogue Scale (VAS), accessed on 15th February 2013,
http://en.wikipedia.org/wiki/Visual_analogue_scale.