International International
Financial Financial
Management Management
© 2001 Prentice-Hall, Inc.
Fundamentals of Financial Management, 11/e
What is a multinational What is a multinational
corporation?
corporation?
◆ A corporation that operates in two or more countries.
◆ Decision making within the corporation may be
centralized in the home country, or may be
decentralized across the
Why do firms expand into other Why do firms expand into other
countries?
countries?
◆ To seek new markets.
◆ To seek new supplies of raw materials.
◆ To gain new technologies.
◆ To gain production efficiencies.
◆ To avoid political and regulatory obstacles.
◆ To reduce risk by diversification.
What are the major factors that distinguish multinational from domestic financial
management?
◆ Currency differences
◆ Economic and legal differences
◆ Language differences
◆ Cultural differences
◆ Government roles
◆ Political risk
Part I Part I
The International Financial Environment
The International Financial Environment
Cash Flow of the Overall MNC
Cash Flow of the Overall MNC
Centralized Multinational Financial Management
Centralized Multinational Financial Management
Decentralized Multinational Financial Management Decentralized Multinational Financial Management
for an MNC with two subsidiaries, A and B
Distribution of U.S. Exports across Countries Distribution of U.S. Exports across Countries
(in billions of $)
Distribution of Distribution of
U.S. Exports and U.S. Exports and
Imports
Imports
International Capital International Capital
Budgeting Example Budgeting Example
◆ A firm is considering an investment in Freedonia, and the initial cash outlay is 1.5 million marks.
◆ The project has 4-year project life with cash flows given on the next slide.
◆ The appropriate required return appropriate required return for repatriated U.S.
dollars is 18% is 18%.
◆ The appropriate expected exchange rates expected exchange rates are given on the next slide.
International project details
International project details : :
International Capital International Capital
Budgeting Example Budgeting Example
0 -1,500,000 1,500,000 2.50 2.50 -600,000 -600,000 -600,000 -600,000 1 500,000 500,000 2.54 2.54 196,850 196,850 166,822 166,822 2 800,000 800,000 2.59 2.59 308,880 308,880 221,833 221,833 3 700,000 700,000 2.65 2.65 264,151 264,151 160,770 160,770 End
of Year
Expected Expected Cash Flow Cash Flow
(marks)
Expected Expected Cash Flow Cash Flow (U.S. dollars)
Present Value Present Value of Cash Flows of Cash Flows
at 18%
at 18%
Exchange Exchange Rate
Rate (marks
to U.S. dollar)
Capital Budgeting Analysis: Spartan, Inc.
Capital Budgeting Analysis: Spartan, Inc.
Capital Budgeting Analysis: Spartan, Inc.
Capital Budgeting Analysis: Spartan, Inc.
Perkembangan Kurs Rp terhadap Beberapa Mata Uang Asing 1990 - 2005
0 2000 4000 6000 8000 10000 12000 14000 16000
1 15 29 43 57 71 85 99 113 127 141 155 169 183
Rp/$
Rp/Y Rp/Sgd Rp/Euro
Faktor Yang Mempengaruhi Kurs Valas
1. Permintaan dan Penawaran Valas
2. Posisi Neraca Pembayaran Internasional 3. Tinkat Inflasi
4. Tingkat Pendapatan 5. Tingkat Bunga
6. Kebijakan dan Pengawasan Pemerintah
7. Ekspektasi/Spekulasi Masyarakat – Country
Risk
Comparing Interest Rates Among Currencies Comparing Interest Rates Among Currencies
Annualized Short-Term Interest Rates among Countries in 2001
Corruption Index Ratings for Selected Countries Corruption Index Ratings for Selected Countries
Maximum rating = 10. High ratings indicate low corruption.
Graph 1: Sectors and institutions most affected by corruption (1 - not at all corrupt ... 5 - extremely corrupt)
2.6 2.8
2.9 2.9
3.0 3.0
3.2 3.2
3.3 3.4 3.4
3.5 3.6
3.7
4.0
Religious bodies NGOs Registry and permit services Military Education system Utilities Medical services Media Customs Tax revenue Business/Private sector Legal system/Judiciary Police Parliament/Legislature Political parties
Score 2.6 2.8 2.9 2.9 3 3 3.2 3.2 3.3 3.4 3.4 3.5 3.6 3.7 4
Religious bodies NGOs Registry and permit
services Military Education system Utilities Medical services Media Customs Tax revenue Business/Private
sector
Legal
system/Judiciary Police Parliament/Legislat
ure Political parties
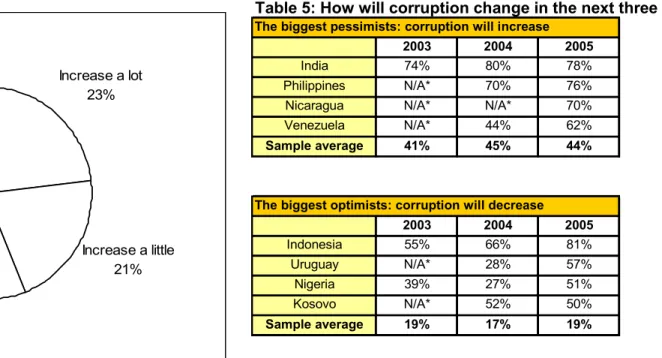
Table 5: How will corruption change in the next three years?
2003 2004 2005
India 74% 80% 78%
Philippines N/A* 70% 76%
Nicaragua N/A* N/A* 70%
Venezuela N/A* 44% 62%
Sample average 41% 45% 44%
2003 2004 2005
Indonesia 55% 66% 81%
Uruguay N/A* 28% 57%
Nigeria 39% 27% 51%
Kosovo N/A* 52% 50%
Sample average 19% 17% 19%
Source: Transparency International Global Corruption Barometer 2005
* Country not included in Global Barometer 2003/2004 The biggest pessimists: corruption will increase
The biggest optimists: corruption will decrease Increase a lot
23%
Increase a little 21%
Stay the same 30%
Decrease a little 14%
DK/NA 7%
Decrease a lot 5%
Actual Country Risk Ratings Across Countries
Actual Country Risk Ratings Across Countries
Cougar Co.:
Cougar Co.:
Determining the Overall Country Risk Rating
Determining the Overall Country Risk Rating
Cougar Co.:
Cougar Co.:
Derivation of the Overall Country Risk Rating
Derivation of the Overall Country Risk Rating
Types of Exchange-Rate Risk Types of Exchange-Rate Risk
Exposure Exposure
◆ Translation Exposure Translation Exposure -- Relates to the change in accounting income and balance sheet statements caused by changes in exchange rates.
◆ Transactions Exposure Transactions Exposure -- Relates to settling a
particular transaction at one exchange rate when the obligation was originally recorded at another.
◆ Economic Exposure Economic Exposure -- Involves changes in expected --
future cash flows, and hence economic value, caused
by a change in exchange rates.
a. Translation/Accounting
Risiko dari fluktuasi kurs valas terhadap consolidated financial statement perusahaan.
Tahun Pelaporan
Subsidiary Earning
Average Forex rate
Translation Earning Tahun I
Tahun II
GBP 5 M GBP 6 M
$ 2,40 / GBP
$ 1,15 / GBP
$ 12 M
$ 6,9 M
Meskipun penerimaan subsidiary di UK meningkat 20% (dari GBP 5 ke 6 M) namun consolidated income statementnya mengalami
penurunan sebesar $ 5,1 M.
b. Transaksion Eksposure
Risiko pengaruh fluktuasi kurs valas terhadap future cash transaction
Transaction Forex
Exposure Apresiasi Depresiasi
Inflow Untung Rugi
Outflow Rugi Untung
Tahapan untuk mengukur risiko ini adalah :
Currency Inflow Outflow Netto Range of
Forex Rate Range of Netto
1 2 3 4 5 6
CAD
DEM
FRF
CHF
2M
10M
100M
1M
6M
12M
60M
6M
4M outflow
2M Outflow
40M Inflow
5M Outflow
$0,79 – 0,81
$0,48 – 0,52
$0,09 – 0,11
$0,56 – 0,64
$3,16 – 3,24M (Outflow)
$0,96 – 1,40M (Outflow)
$3,60 – 4,40M (Inflow)
$2,80 – 3,20M (Outflow)
Sementara itu, untuk mengurangi timbulnya transaction exposure, perusahaan dapat memilih satu dari beberapa alternatif kontrak sebagai berikut :
1. Money market hedging 2. Forward contract hedging 3. Future contract hedging 4. Currency option hedging
5. Sama sekalai tidak melakukan hedging
Untuk mendapatkan gambaran yang lebih jelas mengenai
masalah transaction exposure ini, perhatikan contoh kasus
berikut ini Sumber : Hamny Hady, 2001.
Sebuah perusahaan USA memerlukan dana sebesar GBP 200.000,- untuk membayar hutangnya yang akan jatuh tempo 180 hari/6 bulan yang akan datang.
Beberapa data yang diperoleh hari ini adalah : Spote rate $ 1,50 / GBP
Forward rate $ 1,47 / GBP (perkiraan)
Tingkat bunga untuk 180 hari di USA UK Tk. Bunga deposito 4,5% 4,5%
Tk. Bunga pinjaman 5% 5%
Strike price untuk call option GBP 180 hari adalah $ 1,48 / GBP dan premiumnya % 0,03 / unit
Strike price untuk put option GBP 180 hari adalah $ 1,49 / GBP dan premiumnya adalah
$ 0,02 / unit
Probabilitas Future Spot Rate/FSR (Kemungkinan spot rate di masa datang/180 hari lagi) adalah :
Estimasi FSR Probabilitas
$ 1,43 20%
Jawab :
Alternatif 1, apabila transaction exposure diatasi dengan money market hedging
Langkah pertama, pinjam $ untuk membeli GBP, yang mana apabila GBP tersebut sudah diperoleh dan didepopsitokan, 180 hari lagi akan menjadi GBP 200.000,- untuk membayar kewajiban yang jatuh tempo.
Agar 180 hari lagi menjadi GBP 200.000,-, saat ini GBP yang dibutuhkan adalah : GBP 200.000,-
--- = GBP 195.599,02 ( 1 + 0,0225 )
Catatan : 0,0225 atau 2,25% adalah bunga deposito untuk 180 hari (kalau 1 th 4,5%, lihat data)
Dan untuk mendapatkan GBP 195.599,02 tersebut Dollar yang dibutuhkan atau harus dipinjam adalah sebesar :
GBP 195.599,02 x $ 1,50 / GBP = $ 293.398,53
Untuk kewajiban perusahaan sudah tidak ada masalah, namun 180 hari lagi perusahaan harus melunasi pinjaman Dollarnya sebesar :
Pinjaman pokok + Bunga 180 hari, yakni
$ 293.398,53 x ( 1 + 0,025 ) = $ 300.733,5
Alternatif 2, Pergi ke pasar forward dan beli kontrak forward 180 hari, dan hasilnya adalah :
GBP 200.000,- x $ 1,47 = $ 294.000,-
jadi kalau memilih alternatif 2 ini, dana yang harus disediakan adalah sebesar $ 294.000,-
Alternatif 3, pergi ke pasar option dan membeli Call option, dengan perhitungan sebagai berikut.
Diketahui : Strike price $ 1,48 / GBP Premiumnya $ 0,03 / unit
Kemungkinan
FSR 180 hr Premium Total Price Paid / unit
Total payment
GBp 200.000,-
Probailitas
$ 1,43
$ 1,46
$ 1,52
$ 0,03
$ 0,03
$ 0,03
$ 1,46
$ 1,49
$ 1,51
$ 292.000,-
$ 298.000,-
$ 302.000,-
20%
70%
10%
Sumber : Hamny Hady, 2001
Alternatif ke 4, apabila memilig tidak melakukan hedging Kemungkinan FSR
180 hari
$ yang diperlukan untuk bayar GBP
200.000,-
Probabilitas
$ 1,43
$ 1,46
$ 1,52
$ 286.000,-
$ 292.000,-
$ 304.000,-
20%
70%
10%
Sumber : Hamny Hady, 2001
Dengan demikian expected value untuk alternatif ini adalah :
$ 286.000,-(20%) + $ 292.000,- (70%) + $ 304.000,- (10%) = $ 292.000,- Kesimpulan :
Dari berbagai alternatif di atas, sepertinya laternatif terakhir adalah yang paling murah, yakni dengan tidak melakukan apa-apa terhadap kewajiban tersebut. Namun demikian agar tidak selalu terpengaruh dan tergantung dari kemungkinan fluktuasi kurs valas, maka sebaiknya melakukan atau membelli kontrak forward, karena nilainya adalah termurah kedua.
c. Economic Exposure
Pengarus dari Fluktuasi kurs valas terhadap present value dari future cash flow perusahaan.
Income Statement Rp 20/Y Rp 21/Y Rp 22/Y
1. Sales dlm negeri Rp 200 Rp 225 Rp 250
2. Sales di Jepang Y 10 jt Rp 200 Rp 210 Rp 220
3. Total Sales Rp 400 Rp 435 Rp 470
4. Cost of Goods Sold
Di dalam negeri Rp 100 Rp 100 Rp 100
Di Jepang Y 10 jt Rp 200 Rp 210 Rp 220
5. Total Cost of goods sold Rp 300 Rp 310 Rp 320
6. Gross Profit Rp 100 Rp 125 Rp 150
7. Operating Expense Rp 45 Rp 45 Rp 45
8. EBIT Rp 55 Rp 80 Rp 105
9. Interest expense
Skenario Kurs Valas
Original Impact of Exchange Rate Movements on Earnings:
Original Impact of Exchange Rate Movements on Earnings:
Madison, Inc. (In Millions)
Madison, Inc. (In Millions)
Beberapa dampak yang terjadi pada arus kas masuk/inflow dan arus kas keluar/outflow dari adanya economic exposure ini dapat diringkas dalam tabel berikut ini :
Inflow dalam Rp Rp Apresiasi Rp Depresiasi Penjualan produk lokal
Export dalam Rp Export dalam valas Bunga dari investasi LN
Turun Turun Turun Turun
Naik Naik Naik Naik
Outflow dalam Rp Rp Apresiasi Rp Depresiasi Import supplies dlm Rp
Import supp. Dlm valas Bunga atas pinjaman LN
Tidak berubah Turun Turun
Tidak berubah Naik Naik
Important Important
Exchange-Rate Terms Exchange-Rate Terms
◆ Currency risk Currency risk can be thought of as the volatility of the exchange rate of one currency for
another (say British pounds per U.S. dollar).
Spot Exchange Rate
Spot Exchange Rate -- The rate today for exchanging one currency for another for for
immediate delivery immediate delivery.
Forward Exchange Rate
Forward Exchange Rate -- The rate today for exchanging one currency for another at a specific at a specific
future date
future date.
1. SPOT MARKET dan SPOT RATE
Spot Market : Bursa valas, dimana transaksi valas berlangsung paling lambat 2 x 24 jam atau dua hari sejak transaksi berlangsung.
Spot Rate : Kurs valas yang berlaku di pasar spot, atau kurs yang berlaku paling lama 2 hari sejak transaksi.
Ketentuan Dasar
•
Pengertian Jual/Beli Dilihat dari Sisi Dealer Pedagang Valas
•
Kurs Jual Selalu Lebih besar dari Kurs Beli Margin Keuntungan Pedagang Valas
•
Kurs Jual/Beli = Kurs Beli/Jual Valas Lawan
Jual Beli Jual Beli
Rp.8600/usd Rp.8200/usd USD/Rp 8200 USD/Rp.8600 Rp. 79/jpy Rp. 73/jpy JPY/Rp73 JPY/Rp 79 Rp.1500/frf Rp.1150/frf FRF/Rp1150 FRF/Rp1500
Berapa Rp akan kita peroleh dengan Berapa Rp akan kita peroleh dengan
menyerahkan 500 DEM, 1000 YJP, 250 USD ? menyerahkan 500 DEM, 1000 YJP, 250 USD ?
Diketahui 500 DEM Rp / DEM
1000 YJP --- dicari Rp = Rp / YJP -- > Posisi “ Beli “ 250 USD Rp / USD
500 DEM x Rp 4250 / DEM = Rp 2125 000 Beli 1000 YJP x Rp 73 / YJP = Rp 73.000 250 USD x Rp 8200 / USD = Rp 2050 000
Konsumen Dealer
Rp ..?
500 DEM, 1000 YJP, 250 USD
Latihan Latihan
◆ Berapa Rp harus kita serahkan untuk mendapatkan 500 DEM, 1000 YJP, 250 USD
◆ Berapa FRF, YJP,USD harus diserahkan
untuk memperoleh Rp 1.000.000,-
Jawaban 1 Jawaban 1
500 DEM Rp / DEM
Diket 1000 YJP dicari Rp = Rp / YJP Posisi “ Jual”
250 USD Rp / USD
500 DEM x Rp 4750 / DEM = Rp 2375 000 Jual 1000 YJP x Rp 79 / YJP = Rp 79 000 250 USD x Rp 8600 / USD = Rp 2150.000
Konsumen Dealer
500 DEM, 1000 YJP, 250 USD
Rp ..?
Jawaban 2 Jawaban 2
Konsumen Dealer
Rp 1.000.000,-
FRF, YJP, USD..?
Jual Rp 1 000 000 x FRF / Rp 1150 = FRF 869.565
Jual Rp 1 000 000 x YJP / Rp 73 = YJP 13698.630
Jual Rp 1 000 000 x USD / Rp 8200 = USD 121.951
Cross Rate Cross Rate
Cross rate adalah kurs silang antara dua mata uang asing yang Cross rate adalah kurs silang antara dua mata uang asing yang berada di suatu negara domestik tertentu. Misalnya kurs silang berada di suatu negara domestik tertentu. Misalnya kurs silang antara USD terhadap JPY di bursa valas Indonesia.
antara USD terhadap JPY di bursa valas Indonesia.
Jual USD / FRF = jual ( USD / X x X / FRF ) Ket :
1 Dealer jual FRF dengan currency USD ( tidak ada dalam notasi) 2 Yang ada dealer jual FRF atas Rp ( jual Rp / FRF ) Konsumen
membeli FRF dengan Rp
3 Konsumen tidak memiliki Rp Melainkan memiliki USD
4 Konsumen membeli Rp dengan USD dealer menjual Rp dengan USD ( Jual USD / Rp )
5 Notasinya menjadi jual ( USD / Rp x Rp / FRF )
Jual USD / FRF = USD / Rp 8200 x Rp 1500 / FRF = 0,18292 USD / FRF Beli YJP / DEM = YJP / Rp 79 x Rp 4250 /DEM = 53, 797 YJP / DEM
Contoh
Tuan Robert menukarkan 100 FRF akan mendapatkan berapa USD ?
Jawab :
Beli 100 FRF x USD / FRF USD / Rp 8600 x Rp 1150 / FRF
= 0,1337 USD / FRF
100 FRF x 0,1337 USD / FRF
= 13,37 USD
Nyonya Margareth Menyerahkan 100 USD akan menerima berapa FRF ?
Beli 100 USD x FRF / USD FRF / Rp 1500 x Rp 8200 / USD
= 5, 4666 FRF / USD
100 USD x 5,4666 FRF / USD
Source: http://www.ozforex.com.au/cgi-bin/spotrates.asp?sBase=CAD
Currency Market Hedges Currency Market Hedges
◆
A forward contract forward contract is a contract for the delivery of a
commodity, foreign currency, or financial instrument at a price specified now, with delivery and settlement at a specified
future date.
Spot rate Rp.10.000/$
90-day forward rate Rp. 9.500/$
2. Forward Exchange Market
2. Forward Exchange Market
Currency Market Hedges Currency Market Hedges
◆
The firm has the option of selling 1 million US Dollar forward 90 days. The firm will receive Rp. 9.500.000.000,- in 90 days (1
million US Dollar x Rp.9.500).
◆
Therefore, if the actual spot price in 90 days is less than Rp.
9.500,-, the firm benefited from entering into this transaction.
◆
If the rate is greater than Rp. 9.500,-, the firm would have benefited from not entering into the transaction.
Fillups Electronics has just sold equipment worth 1 million US Dollar with credit terms of “net 90.” How can the firm hedge the How can the firm hedge the
currency risk?
currency risk?
Currency Market Hedges Currency Market Hedges
◆
A futures contract futures contract is a contract for the delivery of a
commodity, foreign currency, or financial instrument at a specified price on a stipulated future date.
◆
A currency futures market exists for the major currencies of the world.
3. Currency Futures 3. Currency Futures
Currency Unit Per IMM Contrak
AUD 100.000
GBP 62.500
CAD 100.000
FRF 250.000
DEM 125.000
JPY 12.500.000
Contoh 1 :
Pada tanggal 1 Januari 2002, Tuan Budi memerlukan DEM 575.000 untuk membayar hutangnya kepada mitra dagangnya di luar negeri. Hutang tersebut akan jatuh tempo pada tanggal 10 Mei 2002, atau 100 hari kemudian. Untuk menghindari kerugian yang timbul karena fluktuasi valas, khususnya DEM, maka Tuan Budi dapat memilih tindakan :
a. Melakukan / membeli Currency future contract ( CFC ) b. Melakukan / membeli forward contract
Jika pilihan pertama yang diambil :
Pilihan IMM contract yang terdekat adalah Rabu ke-3 bulan Maret 2002, dengan kemungkinan pembelian :
Membeli 4 x DEM future contract
4 x DEM 125.000 = DEM 500.000, sisanya ditutupi dengan usaha lainnya
Membeli 5 x DEM future contract
5 x DEM 125.000 = DEM 625.000, sisanya ditabung/ dijual di pasar spot nilai kontrak senilai DEM 500.000 atau DEM 625.000 tersebut dibayar dengan harga future contract ( Future currency price )-nya, misalnya Rp 4.500 / DEM. Dan biasanya harga ini adalah sama / senilai dengan harga, jika Tuan Budi memilih alternatif kedua ( membeli forward contract ).
Kontrak perdagangan berjangka valas yang dilakukan dengan standar volume dan jangka waktu tertentu pada international monetory market (IMM). Waktu jatuh temponya setiap hari rabu minggu ke 3 bulan :
a. Maret, Juni, September, dan Desember
b. Januari, Maret, April, Juni, Juli, September, Oktober, dan Desember ( Alternatif lain )
Perbedaannya Currency Future Contract dengan Forward Contract adalah :
Ciri Future Contract Forward Contract
Besar kontrak
Jatuh tempo
Tempat transaksi
Penentuan harga
Jaminan
Komisi
Mitra transaksi
Standar Tertentu
Ada secara fisik ( SIMEX, IMM )
Mekanisme pasar Ada
Dibayar langsung
Tidak standar Tidak tentu Tidak harus Kurs saat itu Tidak ada Selisih kurs Diketahui
---*--- JatuhTempo Kewajiban Mei Kita Kontrak beli CFM
IMM sebelum Jatuh Tempo kewajiban
---*---*---*---*--- Expired CFM IMM . Maret Juni Sep Des Rabu minggu III
---*--- Jatuh Tempo Tagihan Mei Kita Kontrak jual CFM
IMM Setelah jatuh tempo tagihan
Currency Market Hedges Currency Market Hedges
◆ A currency option currency option is a contract that gives the holder
the right to buy (call) or sell (put) a specific amount of a foreign currency at some specified price until a certain (expiration) date.
4. Currency Options
4. Currency Options
Ketentuan Pokok Dalam COM ( Eitman, Stonehill, dan Moffett ( 1992 : 116 ) :
a. Penjual currency option disebut dengan writer atau grantor
b. Currency option contract dapat dilakukan dalam tujuh mata uang yang sama dengan CFC
c. Satuan kontrak adalah setengah dari satuan dalam CFC
d. Transakasi dilakukan berdasarkan harga berlaku strike atau exercise price yang disepakati
e. American option memberi hak kepada pembeli kontrak untuk merealisir option yang dibelinya pada setiap waktu anatara tanggal penulisan kontran dan saat jatuh temponya f. European option hanya dapat direalisisr saat jatuh temponya
g. Suatu currency option yang exercise price-nya sama dengan spot price disebut sebagai at the money
h. Suatu currency option yang akan menguntungkan jika direalisasi segera disebut dengan in the money.
In the money call, adalah call option yang exercise price-nya < current spot price
In the money put, adalah put option yang exercisenya > current spot price
i. Suatu currency option yang tidak akan menguntungkan jika direalisasi segera disebut dengan out the money.
Out the money call, adalah call option yang exercise price-nya > current spot price
Out the money put, adalah put option yang exercisenya < current spot price
j. Premium atau option price adalah biaya currency option yang ditetapkan di dibayar di muka oleh pembeli kepada penjual option
Contoh
1. PT A di AS memerlukan dana DEM 625.000 ( 10 x kontrak COM 62500 DEM) tiga bulan yang akan datang, dan diantisipasi melalui Currency Option Market COM dengan kesepakatan sbb;
Exercise Strike Price 3 bln tsb USD 0.50 / DEM Call Option Premium USD 0,02 / unit
a. Berapa BEP Call dan dana yang diperlukan untuk menutup kontrak tersebut
b. Jika Future Spot Rate 3 bln kemudian ternyata USD 0,53 / Dem, USD 0.52 / DEM, 0.49 / DEM, apakah sebaiknya option tersebut direalisasi atau tidak, berapa selisih untung dan ruginya
Jawab :
a. Total Strike price DEM 625.000 x USD 0,50 = 312 500 USD Total Call Premi DEM 625.000 x USD 0,02 = 12 500 USD --- + BEP Call & Total Dana USD 0,52 = 325 000 USD
b. Jika FSR 3 bln kemudian USD 0,53 / DEM
Nilai pasar DEM 625 000 x USD 0,53 / DEM = 331 250 USD --- direalisasi karena. Selisih Untung realisasi COM 6 250 USD Jika FSR 3 bln kemudian USD 0,52 / DEM
Nilai pasar DEM 625 000 x USD 0,52 /DEM = 325 000 USD Direalisasi / tidak sama saja BEP
0,49 0,53 Max. profit penjual
Max. loss pembeli
Unlimited profit pembeli
Unlimited loss penjual 0,52
Call option batal Call option dilaksanakan
0,02
- 0,02
STRADDLE
Melakukan sekaligus Call options dan Put options, jika valas berfluktuasi tajam dan tidak menentu
Contoh
Diketahui di pasar options
Strike price 4800 Rp / AUD Call Options premi 50 Rp / unit Put Options premi 150 Rp / unit
Total Put options ( 150 + 50 ) 200 Rp / unit Gambar
BEP put
BEP call Put option
dilaksanakan
450 0
515 0 500
0 460
0
465 0
480 0
485 0
Call option pembeli Put option pembeli
- 50
Call option dilaksanakan Strike Price
Strike Price 4800 Strike price 4800 Put opt premi 150 Call Option Premi 50 Call Opt Premi 50 Put Opt Premi 150 --- + --- + BEP Call 5000 BEP Put 4600 Jika FSR < 4600 Realisasikan Put option dan lupakan call option. Miss FSR 4500 kita berhak menjual dengan harha 4800 dan BEP 4600 selisih untung jual 4600 – 4500 = 100 Rp / unit
Jika FSR > 5000 Realisasikan call option dan lupakan puts option misalkan FSR 5150 kita berhak membeli 4800 BEP 5000 selisih untung beli ( 5150 – 5000) = 150 rp/unit
BEP put BEP call
Put option dilaksanakan
4500 4600 4650 4800 4850 5000 5150
Call option pembeli Put option
pembeli
- 150 - 50
Call option dilaksanakan
BEP total Call BEP total Put
Strike Price
Review of Hedging Techniques Review of Hedging Techniques
Futures Purchase currency Sell currency
hedge futures contract(s). futures contract(s).
Money Borrow local Borrow foreign
market currency. Convert currency. Convert hedge to foreign currency. to local currency.
Invest till needed. Invest till needed.
Forward Negotiate forward Negotiate forward hedge contract to buy contract to sell
foreign currency. foreign currency.
To Hedge Payables To Hedge Receivables
EURO CURRENCY MARKET ( ECM )
ECM adalah pasar uang internasional yang kemudian dikenal sebagai Euro Dollar Market. Pasar ini muncul karena semakin banyaknya transaksi internasional, terutama di Eropa yang menggunakan USD.
Faktor-faktor lain yang menyebabkan berkembangnya Euro Dollar adalah : a. Adanya peraturan pemerintah USA yang membatasi pinjaman luar negeri,
sehingga MNC-USA melakukan pinjaman USD di bank-bank Eropa
b. Tidak ada ketentuan reserve requirement ( cadangan ) untuk deposito Euro Dollar, sehingga menarik pelaku bisnis untuk membuka deposito ini c. Ada batasan bunga tertinggi untuk deposito di USA, sementara di ECM
tidak ( lebih menarik )
Perhatikan contoh berikut ini :
Tingkat bunga pinjaman bank di USA 6 %
Tingkat bunga pinjaman bank di Euro 5 %
Tingkat bunga deposito di Euro 4 %
Tingkat bunga deposito di USA 3 %
Perhatikan bahwa spread tingkat bunga pinjaman dan deposito di USA lebih besar ( 6 % - 3 % ) dibanding spread yang sama di Euro ( 5 % - 4 % ).
Menarik yang mana ?
European Monetary Union European Monetary Union
◆ In 2002, the full implementation of the
“euro” was completed. The national currencies of the 12 participating
countries were phased out in favor of the “euro.” The newly formed
European Central Bank controls the
monetary policy of the EMU.
Member nations of the EMU Member nations of the EMU
◆ Austria
◆ Belgium
◆ Finland
◆ France
◆ Germany
◆ Greece
◆ Ireland
◆ Italy
◆ Luxembourg
◆ Netherlands
◆ Portugal
◆ Spain
◆
Notable European Union countries not in the EMU:
◆