Simulation study of
reliability coefficient and discrimination index
Adi Setiawana* and Winsy Ch. D. Weku,b
aDepartment of Mathematics, Faculty of Science and Mathematics, Satya Wacaha Christian
University, Jl. Diponegoro 52–60 Salatiga 50711, Indonesia
bDepartment of Applied Mathematics, College of Science, Chung Yuan Christian University, 200 Chung
Pei Road, Chung Li District, Taoyuan City, Taiwan 32023
bDepartment of Mathematics, Faculty of Mathematics and Natural Science, Sam Ratulangi
University, Jl. Kampus UNSRAT, Manado, Indonesia
Abstract
In this paper it will be presented how resampling method with replacement is used to construct a new simulated table and based on the simulated table is determined the reliability coefficient (by using Cronbach’s alpha) and discrimination index (by using Ferguson’s delta). Simulation study is done to find the relationship (is expressed by using Pearson correlation coefficient ) between the discrimination index and reliability coefficient. We conclude that there exists a significant coefficient correlation between Cronbach’s alpha reliability coefficient and Ferguson’s δ discrimination index. The simulation study can also be done with a Likert scale in the next following research.
Keywords resampling, reliability coefficient, discrimination index, Ferguson’s delta, Cronbach’s alpha.
1.
Introduction
In preparing the measurement tool widely used in psychology, reliability coefficient is very important. The reliability coefficient estimates the degree of measurement error in the data and hence the reproducibility of the measurements (Hankins, 2007). Discrimination index is used to distinguish between individuals without reference to an external criterion (Hankins, 2008). In this paper it will be presented how resampling method with replacement is used to construct a new simulated table and based on the simulated table is determined the reliability coefficient (by using Cronbach’s alpha) and discrimination index (by using Ferguson’s delta). Simulation study is done to find the relationship (is expressed by using Pearson correlation coefficient ) between the discrimination index and reliability coefficient. Related recent papers related to this paper are Setiawan (2014a) and Setiawan (2014b).
2.
Literature review and research methods
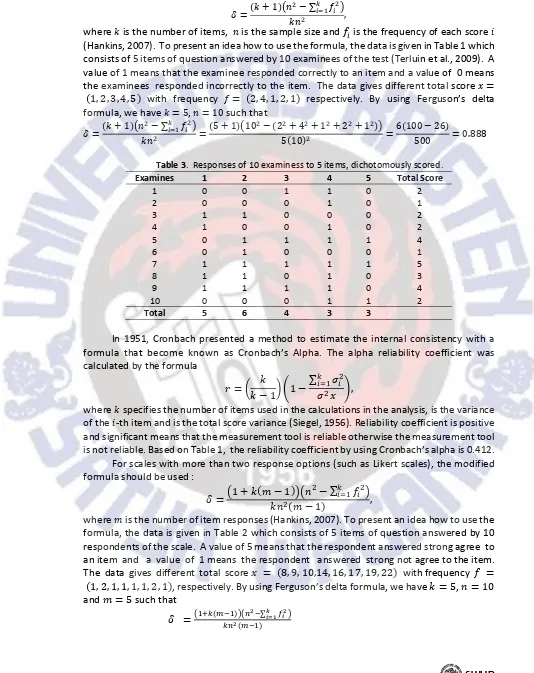
In the literature review it will be explained a method to calculate reliability coefficient by using Cronbach’s alpha and discrimination index by using Ferguson’s delta formula. Ferguson’s original formula is appropriate for scales with dichotomous items:
SWUP (Hankins, 2007). To present an idea how to use the formula, the data is given in Table 1 which consists of 5 items of question answered by 10 examinees of the test (Terluin et al., 2009). A value of 1 means that the examinee responded correctly to an item and a value of 0 means the examinees responded incorrectly to the item. The data gives different total score =
1, 2,3, 4,5 with frequency = 2,4,1, 2,1 respectively. By using Ferguson’s delta
Table 3. Responses of 10 examiness to 5 items, dichotomously scored.
Examines 1 2 3 4 5 Total Score
where u specifies the number of items used in the calculations in the analysis, is the variance of the -th item and is the total score variance (Siegel, 1956). Reliability coefficient is positive and significant means that the measurement tool is reliable otherwise the measurement tool is not reliable. Based on Table 1, the reliability coefficient by using Cronbach’s alpha is 0.412. For scales with more than two response options (such as Likert scales), the modified formula should be used :
i=-1 + u Ž − 1 .- − ∑ !
# .
u Ž − 1 ,
=- "ò òo .• ¼”o-ò ¼”" ””"òo”" ”" ”" ”" ”" ”.–
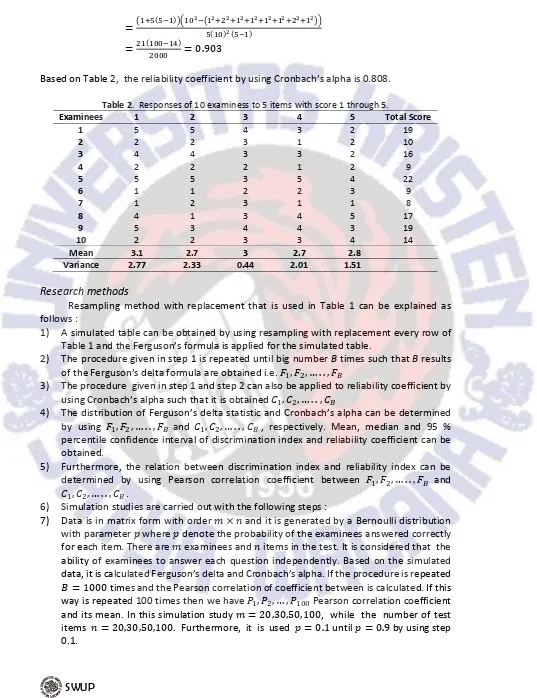
= ¼¼o ï¼¼¼ = 0.903
Based on Table 2, the reliability coefficient by using Cronbach’s alpha is 0.808.
Table 2. Responses of 10 examiness to 5 items with score 1 through 5.
Examinees 1 2 3 4 5 Total Score
1) A simulated table can be obtained by using resampling with replacement every row of Table 1 and the Ferguson’s formula is applied for the simulated table.
2) The procedure given in step 1 is repeated until big number B times such that B results of the Ferguson’s delta formula are obtained i.e. ô , ô , … . . , ô'
3) The procedure given in step 1 and step 2 can also be applied to reliability coefficient by using Cronbach’s alpha such that it is obtained , , … . . , '
4) The distribution of Ferguson’s delta statistic and Cronbach’s alpha can be determined by using ô , ô , … . . , ô' and , , … . . , ', respectively. Mean, median and 95 % percentile confidence interval of discrimination index and reliability coefficient can be obtained.
5) Furthermore, the relation between discrimination index and reliability index can be determined by using Pearson correlation coefficient between ô , ô , … . . , ô' and
, , … . . , '.
6) Simulation studies are carried out with the following steps :
7) Data is in matrix form with order Ž × and it is generated by a Bernoulli distribution with parameter where denote the probability of the examinees answered correctly for each item. There are Ž examinees and items in the test. It is considered that the ability of examinees to answer each question independently. Based on the simulated data, it is calculated Ferguson’s delta and Cronbach’s alpha. If the procedure is repeated
a= 1000 times and the Pearson correlation of coefficient between is calculated. If this
SWUP 8) Total score of examinees has a normal distribution k, such that if
r , r ,… . , r7are the total score then
~ =r − rq.
9) has a standard normal distribution where rq and s are mean and standard deviation, respectively. Thus, the probability of examinee to answer every item correctly is Φ ~ for = 1,2, … , Ž, where Ž is the number of examinees. In this simulation study Ž =
20,30,50,100, while the number of test items = 20,30,50,100. In this case, we use
µ
= 65,σ
= 10;µ
= 65,σ
= 5;µ
= 60,σ
= 10;µ
= 60,σ
= 5 ;µ
= 55,σ
= 10;µ
= 65,σ
= 5;µ
= 50,σ
= 10 andµ
= 50,σ
= 5.10) Simulation that is used in this paper is Monte Carlo simulation.
3.
Results and discussion
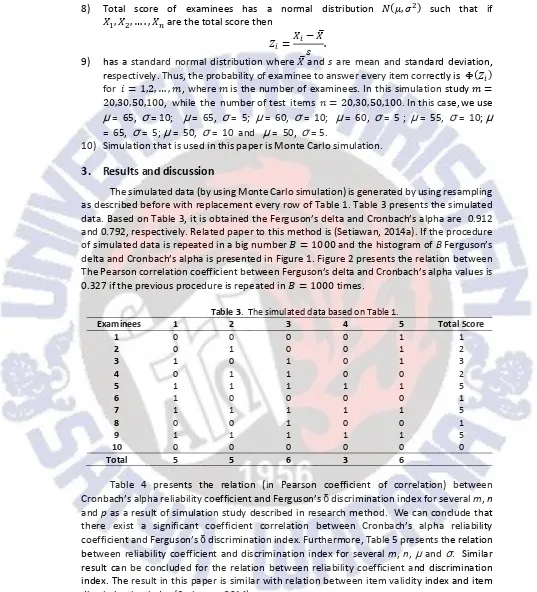
The simulated data (by using Monte Carlo simulation) is generated by using resampling as described before with replacement every row of Table 1. Table 3 presents the simulated data. Based on Table 3, it is obtained the Ferguson’s delta and Cronbach’s alpha are 0.912 and 0.792, respectively.Related paper to this method is (Setiawan, 2014a). If the procedure of simulated data is repeated in a big number a= 1000 and the histogram of B Ferguson’s delta and Cronbach’s alpha is presented in Figure 1. Figure 2 presents the relation between The Pearson correlation coefficient between Ferguson’s delta and Cronbach’s alpha values is 0.327 if the previous procedure is repeated in a= 1000 times.
Table 3. The simulated data based on Table 1. Cronbach’s alpha reliability coefficient and Ferguson’s δ discrimination index for several m, n
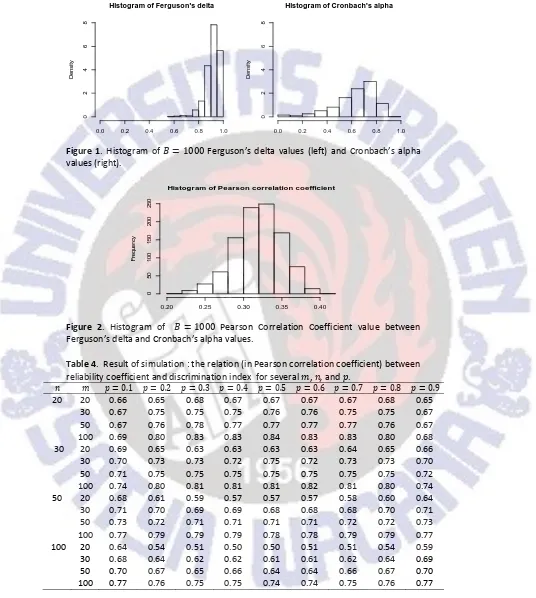
Figure 1. Histogram of a= 1000 Ferguson’s delta values (left) and Cronbach’s alpha values (right).
Figure 2. Histogram of a= 1000 Pearson Correlation Coefficient value between Ferguson’s delta and Cronbach’s alpha values.
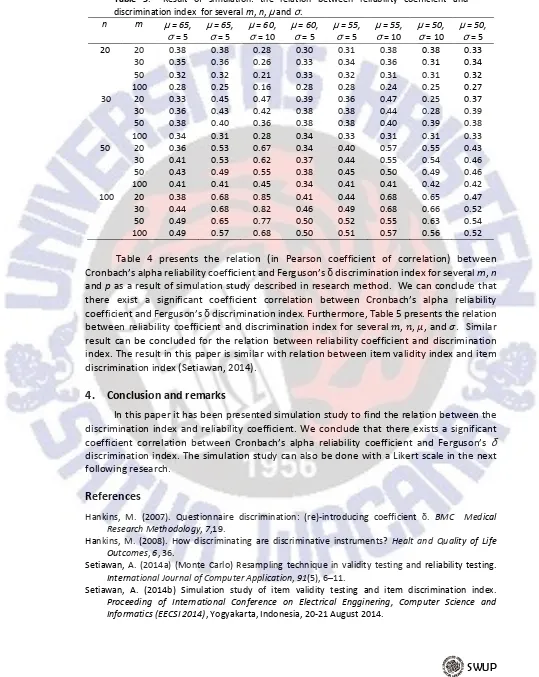
Table 4. Result of simulation : the relation (in Pearson correlation coefficient) between reliability coefficient and discrimination index for several Ž, , and .
SWUP Cronbach’s alpha reliability coefficient and Ferguson’s δ discrimination index for several m, n
and p as a result of simulation study described in research method. We can conclude that there exist a significant coefficient correlation between Cronbach’s alpha reliability coefficient and Ferguson’s δ discrimination index. Furthermore, Table 5 presents the relation between reliability coefficient and discrimination index for several Ž, , k, and . Similar result can be concluded for the relation between reliability coefficient and discrimination index. The result in this paper is similar with relation between item validity index and item discrimination index (Setiawan, 2014).
4.
Conclusion and remarks
In this paper it has been presented simulation study to find the relation between the discrimination index and reliability coefficient. We conclude that there exists a significant coefficient correlation between Cronbach’s alpha reliability coefficient and Ferguson’s δ discrimination index. The simulation study can also be done with a Likert scale in the next following research.
References
Hankins, M. (2007). Questionnaire discrimination: (re)-introducing coefficient δ. BMC Medical Research Methodology, 7,19.
Hankins, M. (2008). How discriminating are discriminative instruments? Healt and Quality of Life Outcomes, 6, 36.
Setiawan, A. (2014a) (Monte Carlo) Resampling technique in validity testing and reliability testing.
International Journal of Computer Application, 91(5), 6–11.
Setiawan, A. (2014b) Simulation study of item validity testing and item discrimination index.
Siegel (1956). Nonparametric statistics for the behavioral science. McGraw-Hill Book Company Inc, New York.