Erlin
Current efforts on Computer Support Collaborative Learning (CSCL) include the design of computational models of collaborative learning interaction such as to improve support guidance to human participation. However, during collaborative learning activities, the interaction process among learners is too complex and it is difficult for teachers or designers to analyze and measure learning effects. Computational models of collaborative learning interaction have been known as a method that provide functional computer-based representations to help educators understand, explain, and identify patterns of group behavior and hence support group learning processes. The aim of this paper is to give an overview on three computational models of learner’s interaction and support possibilities afforded by the various types of computational models of collaborative learning processes. This paper demonstrates how these models can be used to study the nature of interaction patterns within collaborative learning in e-learning.
Keywords: computational model, centrality, density, conversation analysis
1. Introduction
E-learning environments have proved effective in a number of contexts. They would appear to be particularly effective where participants are engaged in Computer Supported Collaborative Learning (CSCL). A new challenge for CSCL is to create computational models of learner’s interaction in collaborative learning to support and guide human participation in e-learning process.
Soller, Jermann, Muhlenbrock, and Martinez in [1] have proposed that computational models of collaborative learning interaction provide functional computer-based representations that help us understand, explain, and predict patterns of group behavior. Some help the system automatically identify group members' roles, while others help scientists understand the cognitive processes that underlie collaborative learning activities such as knowledge sharing or cognitive conflict.
As Barry Wellman in [2] indicated in the magazine Science, “human computer interaction has become socialized. Much of the discussion [...] is collaborative learning interaction more fully, several important questions need to be ask such as: Who is involved with the collaborative learning? Who are the active participants? Who is participating peripherally? Meanwhile, Soller in [4] raised other question on how to determine if learners would tolerate a sentence opener-based interface as a communication medium.
This paper present, three computational models that are used to study the nature of interaction patterns, and discusses on information gained and constraint of using these models to analyze and support learning interaction.
these three models. Finally, section 4, present some conclusions and some proposals of future work.
2. Computational Models of Learner’s
Interaction
Computational model is a mathematical model in computational science that requires extensive computational resources to study the behavior of a complex system by computer simulation [5].
Recently, amount of interest in using computational models to understand the learner’s interaction of collaborative learning is considerable, because the interaction process among learners is complex. Understanding and supporting group interaction is particularly difficult.
Soller, et al., in [1] have argued that during collaborative learning activities, factors such as students’ prior knowledge, motivation, roles, language, behavior, and group dynamics interact with each other in unpredictable ways, making it very difficult to measure and understand learning effects.
Modeling the interaction involved in collaborative learning may help teachers and designers to better analyze and dynamically support collaborative learning interaction on-line.
This paper overviews on learners’ interaction based on computational models perspective proposed by several researchers. We describe three computational models of learner’s interaction: namely, the individual centrality model [6], the group cohesion model [3], and the conversation analysis model [4].
2.1. Individual Centrality Model
Centrality indicates the extent to which an individual interacts with other members in the network [7]. The individual centrality model represents the role and status of each member of the group. By using the centrality concept of a social network analysis, this model can automatically identify the roles and status of each member [6].
Degree centrality is a method of evaluating centrality on the basis of a learner’s direct linkage to other learners. Degree centrality is presented by in-degree centrality and out-in-degree centrality. In-in-degree centrality means the degree of relations for learner A when learner A in a group receives messages from others in communicative situations (A←B). Learners with high in-degree centrality have more interactive
activities and thereby receive more information or comments from others. Out-degree centrality, on the other hand, means the degree of relations for learner A when learner A in a group sends messages toward others in communicative situations (A→B). Learners with high out-degree centrality are more active in providing information to others in discussion or providing comments on the opinions of others [8]. The formulas of degree centrality included in in-degree centrality and out-in-degree centrality are as follows:
di d0
di (Mi) = --- , d0 (M0) = ---
(g-1) (g-1)
di(Mi) is a participant’s in-degree centrality, do(Mo) is the participant’s out-degree centrality, di is the sum of messages received by the participant from other participants, do is the sum of messages that the participant sends toward others, and g is the number of participants in the group.
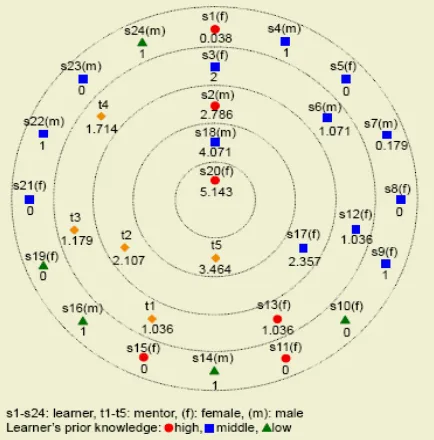
Figure 1. Graph of Out-Degree Centrality (Suh & Lee, 2006)
opinions of others. They also have friendly relations with many participants and have important roles in delivering information to their community. The degree centrality graph also gives us information on each learner’s other attributes, such as gender and level of prior knowledge [6].
Degree centrality is not the only one measure of importance. Motoki Watabe in [10] have proposed that if we are interested in finding the section that can most efficiently obtain information from every other section, one should be near from everyone. In this sense, the actor is the nearest position on average can most efficiently obtain information. Thus closeness centrality is the most appropriate. If we are interested in finding the section that can most frequently control information flow in the network, an actor should be between other actors because the actor can interrupt information flow between them. Thus, betweeness centrality is the most appropriate measure. Measures of centrality include degree, betweenness, closeness, and information centrality [7].
However, Dillenbourg [11] have argued that the degree of interactivity among peers is not defined by the frequency of interaction, but by the extent to which these interactions influence the peer cognitive processes.
2.2. Group Cohesion Model
There are several measures of cohesion, including density. One common measure is the average number of ties it takes for a person in the group to “reach” another person in the group. Density captures how closely a group or subgroup is knit. According to Ehrlich and Carboni [12], it is a proportion that indicates the number of actual ties
present in the group relative to the number of possible ties in the group (i.e., if everyone had a relationship with everyone else in the group). Density can be calculated within a group or between two groups. When calculating the density of an individual’s network, Social Network Analysis (SNA) looks at how closely connected a person’s friends are to each other.
Martinez, Dimitriadis, Rubia, Gomez, and de la Fuente [13] found that the density of a network was affected by the teacher’s presence. Reffay and Chanier [14] illustrated that SNA can help study the cohesion of small groups engaged in collaborative distance learning as a way to locate isolated participants, active subgroups, and various roles of the participants in the interaction structure.
Density provides a measure of the overall ‘connections’ between the participants. The density of a network is defined as the number of communicative links observed in a network divided by the maximum number of possible links [15]. This varies between 0 and 100%. When the density is 0, the network is without any connection; and when the density is 100%, all the participants of a network are connected to one another. The more participants connected to one another (by, for example, their message exchanges), the higher will be the density value of the network [16].
Furthermore, de Laat, et al. [3] explore the advances that SNA can bring, in combination with other methods, when studying CSCL. When applying a whole network perspective, SNA can be used to provide an indication of the cohesion of network. In table 1, they use their own data as way to synthesize and extend our understanding of teaching and learning processes in CSCL.
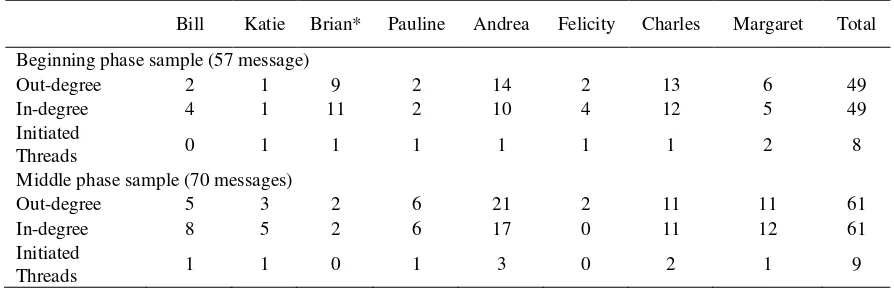
Table 1. Out and in-degree of the participants and initiated threads in the three phase samples for workshop one (de Laat, et al., 2007)
Bill Katie Brian* Pauline Andrea Felicity Charles Margaret Total
Beginning phase sample (57 message)
Out-degree 2 1 9 2 14 2 13 6 49
In-degree 4 1 11 2 10 4 12 5 49
Initiated
Threads 0 1 1 1 1 1 1 2 8
Middle phase sample (70 messages)
Out-degree 5 3 2 6 21 2 11 11 61
In-degree 8 5 2 6 17 0 11 12 61
Initiated
End phase sample (33 messages)
Out-degree 5 0 6 1 8 4 2 2 28
In-degree 11 0 3 0 4 5 2 3 28
Initiated
Threads 2 0 0 0 2 0 0 1 5
*Brian was the designated university tutor in this group
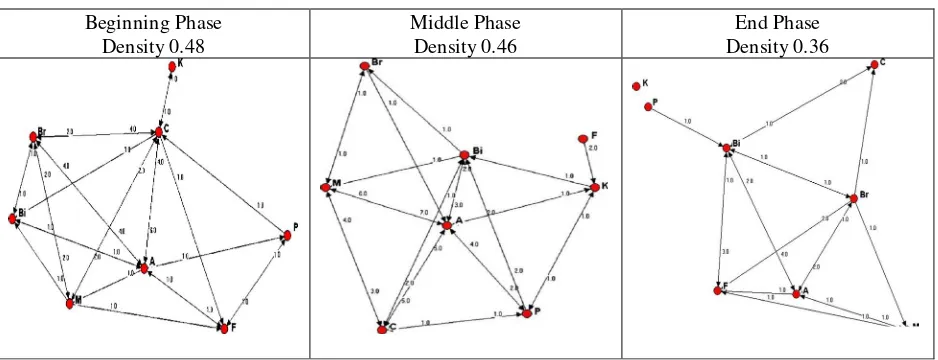
Table 2 shows density values, using UCINET [16], another software tool for network data analysis and visualization. The overall connection between the participants, especially in the beginning and the middle phase, is reasonably high, which suggests that the members of this community are closely collaborating on their group task. In the beginning phase, the density is 48%, and for the middle phase
the value is 46%. In the last phase of the collaboration the value drops somewhat, to 36%. One has to keep in mind that density values tend to be higher in smaller networks; it is, of course, much easier to maintain many connections with a few participants than with very many participants.
Table 2. Interaction Pattern between eight participants for each phase (de Laat, et al., 2007)
Beginning Phase Density 0.48
Middle Phase Density 0.46
End Phase Density 0.36
The values of density in the graph above present the level of cohesiveness that result from group work. That is, it can show the changes in group cohesiveness by calculating the density and we can then analyze the learning process of the group.
2.3. Conversation Analysis Model
The quality of communication in group discussions influences the team members’ learning experience and achievement [17]. According to Soller [4] skill in learning collaboratively means knowing when and how to question, inform, and motivate one’s teammates, knowing how to mediate and facilitate conversation, and knowing how to deal with conflicting opinions.
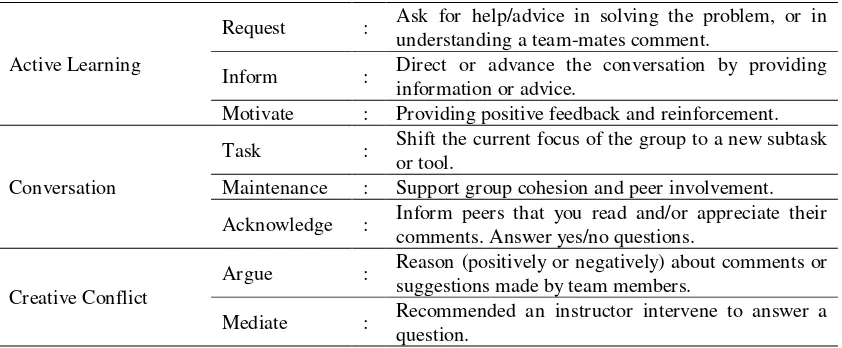
Table 3. Definitions of Collaborative Learning Conversation Skills and Sub-skills (Soller, 2001)
Active Learning
Request : Ask for help/advice in solving the problem, or in understanding a team-mates comment.
Inform : Direct or advance the conversation by providing information or advice.
Motivate : Providing positive feedback and reinforcement.
Conversation
Task : Shift the current focus of the group to a new subtask or tool.
Maintenance : Support group cohesion and peer involvement.
Acknowledge : Inform peers that you read and/or appreciate their comments. Answer yes/no questions.
Creative Conflict
Argue : Reason (positively or negatively) about comments or suggestions made by team members.
Mediate : Recommended an instructor intervene to answer a question.
The students who benefit most from collaborative learning situations are those who encourage each other to justify their opinions, and articulate and explain their thinking. Active Learning conversation skills, such as Encourage, Explain, Justify, and Elaborate, describe the core communication activities of effective learning groups. The three sub-skill categories encompassing Active Learning are Inform, Request, and Motivate.
M
Encourage --- " Very Good" , "Good Point"
Reinforce --- "That's right"
Rephrase --- " In other words"
Lead --- " I think we should"
Suggest --- " I Think"
Elaborate --- " To elaborate" , " Also"
Explain/Clarify --- " Let's me explain in this way"
Justify --- " To justify "
Assert --- " I'm reasonable sure"
Information --- " Do you know"
Elaboration --- " Can you tell me more "
Clarification --- " Can you explain why/how"
Justification --- " Why do you think that "
Opinion --- " Do you think "
Illustration --- " Please show me "
Appreciation --- " Thank you "
Accept/Confirm --- " OK", " Yes "
Reject --- " No "
Request Attention --- " Excuse me "
Suggest Action --- " Would you please "
Request Confirmation --- " Right?" , " is this ok?"
Listening --- " I see what you're saying "
Apologize --- " Sorry "
Coordinate Group Process --- " OK, Let's move on " , " Are you ready"
Request Focus Change --- " Let me show "
Summarize Information --- " To summarize"
End Participation --- " Goodbye"
Example of result that can be obtained from the conversation analysis model is shown in figure 3 that shows data from one student who naturally played three different roles during three consecutive dialogue segments. Qualitative analysis of the transcript shows that the student played the role of a questioner during the first segment, asking several clarification questions such as, “What’s that mean?”
He played an advisor during the second segment, making specific recommendations to the group. During the third segment, he played a quite different role, marked by conformance and commitment to maintain progress on his teammates’ solution. This supports the idea that a student’s role may be partly, or fully, determined by the types of conversation acts he is using.
Figure 3. Summary of one student’s contribution types over three consecutive dialogue segments (Soller, 2001).
3. Computational Models Analysis
We have discussed computational model of learners’ interaction from individuals to overall participants view. Successful collaborative learning relies on effective interaction of learners. Hence, computational model of learners’ interaction have
been attracting attention of many researchers in collaborative learning environment.
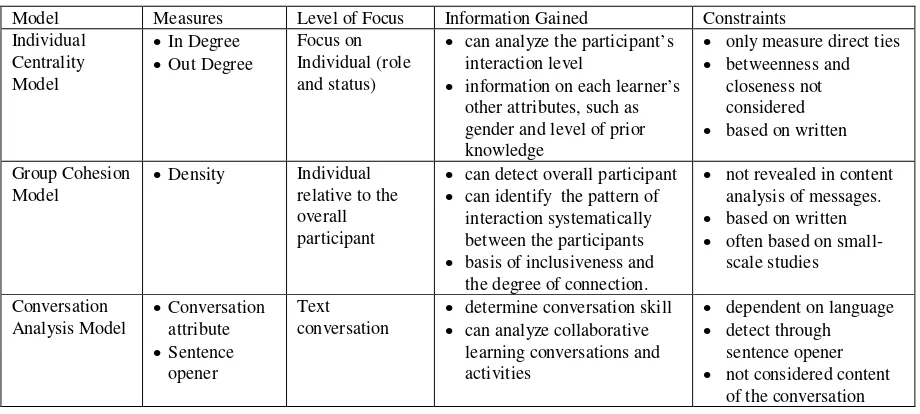
Table 4 shows the analysis of three computational models. Each of the models is analyzed base on majors’ level of focus information gained and constrains.
Table 4. Computational models analysis based on three computational models
Model Measures Level of Focus Information Gained Constraints Individual
can analyze the participant’s interaction level
information on each learner’s other attributes, such as gender and level of prior knowledge
only measure direct ties
betweenness and
can detect overall participant
can identify the pattern of interaction systematically between the participants
basis of inclusiveness and the degree of connection.
4. Conclusion and Further Work
This paper has given an overview of computational models to represent learner-to-learner interaction process during collaborative learning. These models are used to analyze participant’s interaction level, identify the pattern of interaction between the participants and analysis collaborative learning conversations and activities.
However, improvement can be done to give better understanding of the learners’ interaction. We need to explore further on other models of centrality and not only on text based interaction alone. Aspect on betweenness, closeness and information centrality should be considered in individual centrality model.
None text base such as voice and video has not been explored. For conversation model, there is a need to extend to other languages such as Malay or Chinese. One should consider applying content analysis on the conversation, rather than depending only on sentence opener. Content analysis approach has the potential in assessing the quality of the conversation.
Future work will apply various type of computational model to generate a model for learners’ interaction using agent to support interaction in collaborative learning. Some indicators on the basis of collaborative learning models and strategies will be defined.
References
[1] Soller, A., Jermann, P., Muhlenbrock, M.& Martinez, A. (2004). Designing Computational Models of Collaborative Learning Interaction. Proc. ITS 2004 Workshop, 5-12.
[2] Wellman, B. (2001). Computer Networks as Social Networks: Collaborative Work, Telework, and Virtual Community. Annu. Rev. Sociol. 22:213–38. Science, 293, 2031–2034.
[3] de Laat, M., Lally, V., Lipponen, L., & Simon, R.J. (2007). Investigating patterns of interaction networked learning and computer-supported collaborative learning: A role for Social Network Analysis. ijCSCL 2(1), pp. 87-103
[4] Soller, A. (2001). Supporting Social Interaction in an Intelligent Collaborative Learning System. Journal of Artificial Intelligence in Education, 12.
[5] http://en.wikipedia.org/wiki/Computational_model
[6] Suh, H. J., & Lee, S. W. (2006). Collaborative Learning Agent for Promoting Group Interaction, ETRI Journal, Vol 28, No.4, 461-474.
[7] Wasserman, S., & Faust, K. (1997). Social network analysis: Methods and applications. Cambridge: Cambridge University Press.
[8] Suh, H., J., Kang, M., Moon, K., & Jang, H. (2005). Identifying Peer Interaction Patterns and Related Variables in Community-Based Learning. Proc. Computer Supported Collaborative Learning (CSCL), 265-273.
[9] http://www.netminer.com/
[10]Watabe, M. (1998). Exercise for Chapter 6: Centrality; Answers http://www.sscnet.ucla.edu/soc/faculty/mefarland/soc112/cent-ans.htm
[11]Dillenbourg, P. (1999). What do you mean by ‘collaborative learnin’? In P. Dillenbourg (Ed.), Collaborative Learning. Cognitive and Computational Approaches. Oxford: Elsevier Science 1-19.
[12]Ehrlich, K & Carboni, I. (2005). Inside Social Network Analysis http://domino.watson.ibm.com/cambridge/research.nsf/...
[13]Martinez, A., Dimitriadis, Y., Rubia, B., Gomez, E., & de la Fuente, P. (2003). Combining qualitative evaluation and social network analysis for the study of classroom social interactions. Computers & Education, 41(4), 353–368. [14]Reffay, C., & Chanier, T. (2003). Social Network Analysis Used for Modelling Collaboration in Distance Learning
Groups. Intelligent Tutoring Systems: 6th International Conference, ITS 2002, Biarritz, France and San Sebastian, Spain, June 2–7, 2002. Proceedings Retrieved 1 September, 2006, http://www.springerlink.com/content/Ogfrmknm1tyh2p6k
[15]Scott, J. (1991). Social network analysis: A handbook. London: Sage.
[16]Borgatti, S.P., Everett, M.G., & Freeman, L.C. (2000). Ucinet 5.0 (Version 5.4) [windows]. Natrick: Analytic technologies.
[17]Jarboe, S. (1996). Procedures for enhancing group decision making. In B. Hirokawa and M. Poole (Eds.), Communication and Group Decision Making (pp. 345-383). Thousand Oaks, CA: Sage Publications.
[18]Soller, A., Linton, F., Goodman, B., & Gaimari, R. (1998). Promoting Effective Peer Interaction in an Intelligent Collaborative Learning System. B.P. Goettl et al. (Eds.): ITS '98, LNCS 1452, pp. 186-195
![Figure 2. The Collaborative Learning Conversation Skill Taxonomy (structure adapted from McManus and Aiken’s - Collaborative Skills Network [19])](https://thumb-ap.123doks.com/thumbv2/123dok/2120196.1609808/6.612.119.490.88.665/collaborative-learning-conversation-taxonomy-structure-mcmanus-collaborative-network.webp)