POST TSUNAMI
“GREEN” ENVIRONMENTAL DATA
ASSESSMENT
in the Province of Nanggroe Aceh Darussalam
POST TSUNAMI “GREEN” ENVIRONMENTAL
DATA ASSESSMENT
in the Province of Nanggroe Aceh Darussalam
Technical Report
Post Tsunami “Green” Environmental Data Assessment
in Province of Nanggroe Aceh Darussalam
© Wetlands International - Indonesia Programme, 2006
Team of Authors
:
Novana Sari
Fadia Miralka
Ferry Hasudungan
Lili Muslihat
Nyoman Suryadiputra
Design & Layout
:
Triana, Ferry Hasudungan, Novana Sari
Translator :
Wendy
Suryadiputra
Foto sampul
:
Iwan Tri Cahyo W.
A copy of this report can be obtained from:
Wetlands International – Indonesia Programme
Jl. A.. Yani No. 53 Bogor 16161
Jawa Barat – INDONESIA
Tel.
0251 312189
Fax. 0251
325755
E-mail:
[email protected]
These activities were carried out with financial support from:
This publication should be cited as follows:
Novana Sari, Fadia Miralka, Ferry Hasudungan, Lili Muslihat and Nyoman Suryadiputra 2006. Post
Tsunami “Green” Environmental Data Assessment In the Province Of Nanggroe Aceh
Preface
This report comprises the results of a study of the bio-physical environment and the activities
undertaken for its rehabilitation in the Province of Nanggroe Aceh Darussalam (NAD) during the
conditions prevailing prior to and following the tsunami of 26 December, 2004. The data was
collected during the months August-September 2006, and involved a range of different
stakeholders. The data collected gives a general picture of environmental conditions in NAD
Province before and after the tsunami.
The data and information in this report describe the impact of the tsunami disaster on the
bio-physical environment and the potential for rehabilitation. It is hoped that the results of this study will
be useful to the efforts currently being made to achieve the aims of the rehabilitation program.
The UNEP - “Green” Environment Data Assessment (UNEP-GDA) Project is the result of
collaboration between UNEP and Wetlands International-IP (WI-IP) aimed at collecting, compiling
and evaluating environmental or “Green” data on the Province of NAD, covering activities which
include: environmental activities carried out by working groups, agriculture and physical-chemical
soil conditions, forestry both inland and coastal, protection areas, biodiversity, wetlands, marine
and inland fisheries. This Green data can also be accessed via the Online Document Repository
(ODR).
We are aware that the contents of this report still leave much to be desired, but hope that they can
be used to inform studies of post-tsunami conditions in NAD carried out by other parties.
The Authors,
Acknowledgements
Wetlands International-Indonesia Programme would like to express their sincere gratitude to all
those who have been involved directly or indirectly in collecting environmental data before and after
the tsunami in NAD.
Thanks go to :
Badan Rekonstruksi dan Rehabilitasi (BRR) NAD-Nias, Bapedalda Propinsi NAD, all the
concerned Government Agencies and District (Kabupaten) Governments of NAD Province
for the information they provided to the DCAC
National and International Non-Governmental Organisations for the information they provided
to the DCAC
The donor, UNEP
,for providing the funds to enable this project to be carried out.
All the staff of WI-IP in Bogor and Banda Aceh for their support, both administrative and
technical, throughout the project.
Glossary of Terms and Abbreviations
ACIAR
Australian Centre for International Agriculture Research
ADB
Asian Development Bank
BAKORNAS PBP
Badan Koordinasi Nasional (National Coordination Agency)
Bakosurtanal
Badan Koordinasi Survey dan Pemetaan Nasional (National Survey
and Mapping Coordination Agency)
BALITTANAH
Balai Penelitian Tanah (Soil Research Institute)
BAPEDALDA Badan
Pengendalian
Dampak Lingkungan Daerah (Regional
Environmental Impact Control Agency)
BAPLAN
Badan Planologi Kehutanan (Forestry Planning Agency)
BAPPEDA
Badan Perencanaan Pembangunan Daerah (Regional Development
Planning Agency)
BAPPENAS
Badan Perencanaan Pembangunan Nasional (National Development
Planning Agency)
BKSDA
Badan Konservasi Sumber Daya Alam (Natural Resources
Conservation Agency)
BPDAS
Badan Pengelolaan Daerah Aliran Sungai (Watershed Management
Agency)
BPS
Biro Pusat Statistik (Central Bureau of Statistics)
BPTP
Balai Pengkajian Teknologi Pertanian (Institute for the Study of
Agricultural Technology)
BRR
Badan Rehabilitasi dan Rekonstruksi NAD-Nias (Agency for the
Rehabilitation and Reconstruction of Aceh and Nias)
CBO
Community Based Organization
CITES
Convention on International Trade in Endangered Species of Wild
Fauna and Flora (an international agreement among governments to
regulate the trade in specimens of wildlife species in danger of
extinction, so that it does not threaten their conservation in the wild.)
DAS
Daerah Aliran Sungai (Watershed)
Dephut
Departemen Kehutanan (Ministry of Forestry)
DKP
Dinas Kelautan dan Perikanan (Marine Affairs and Fisheries Office)
Ditjen Pankim–Deptrans
Direktorat Jenderal Settlement Preparation Departemen Transmigrasi
(Directorate General for Settlement Preparation, Ministry of
Transmigration)
DPUP
Departemen Pekerjaan Umum Provinsi (Provincial Department of
Public Works)
Fatemeta
Fakultas Teknologi Mekanisasi Pertanian (Faculty of Agricultural
Mechanisation Technology)
Faperta
Fakultas Pertanian (Faculty of Agriculture)
GTZ
Gesellschaft fur Technische Zusammenarbeit; (A corporation
belonging to the German government, which is active in the field of
international cooperation and operates across nations)
ICRAF
International Center for Research in Agroforestry
IPB
Institut Pertanian Bogor (Bogor Agricultural University)
IRRI
International Rice Research Institute
IUCN
International Union for Conservation of Nature and Natural Resources
IUCN Red List
According to the IUCN Red List system, there are nine categories of
threat: Extinct, Extinct in the Wild, Critically Endangered, Endangered,
Vulnerable, Near Threatened, Least Concern,
Data Deficient, and Not
Evaluated. A species is put onto the list of species threatened with
extinction if it falls into the category Critically Endangered, Endangered
or Vulnerable.
LAO PDR
Lao People’s Democratic Republic
Leuser-SOCP
Leuser-Sumatran Orangutan Conservation Programme
LIPI
Lembaga Ilmu Pengetahuan Indonesia (Indonesian Institute of
Sciences)
LSI
IPB Main Library
LSM
Lembaga Swadaya Masyarakat/LSM (Non Governmental
P2DT
Proyek Penelitian Database Tanah (Soil Database Research Project)
P3MT
Proyek Penelitian Pertanian Menunjang Transmigrasi (Project for
Agricultural Research in Support of Transmigration)
PHKA
Perlindungan Hutan dan Konservasi Alam (Forest Protection and
Nature Conservation)
PHPA
Perlindungan Hutan dan Pelestarian Alam (Forest Protection and
Nature Conservation), previous name of PHKA
PKSPL
Pusat Kajian Sumberdaya Pesisir dan Lautan (Centre for the Study of
Marine and Coastal Resources)
PODES
Potensi Desa (Village Potential)
Puslitbangtannak
Tim Pusat Penelitian dan Pengembangan Tanaman Pangan Bogor
(Team from the Bogor Centre for Food Crop Research and
Development)
Puslittan
Pusat Penelitian Tanah (Soil Research Centre)
Satker Pesisir
Satuan Kerja Pesisir (Coastal Work Units)
Satkorlak
Provincial level co-ordinating unit of Bakornas
Satlak
District or municipal level co-ordinating unit of Bakornas
STIK
Sekolah Tinggi Ilmu Kehutanan (Forestry Academy)
SUSI
Survei Terintegrasi (Integrated Survey)
USU
Universitas Sumatra Utara (University of North Sumatra)
UNORC
United Nation Recovery Coordinator for Aceh and NIas
WALHI
Wahana Lingkungan Hidup Indonesia (Indonesian Forum for
Environment)
WIIP
Wetlands International – Indonesia Programme
WWF
World Wildlife Fund for Nature
Contents
Page
PREFACE ...iii
ACKNOWLEDGEMENTS ... iv
GLOSSARY OF TERMS AND ABBREVIATIONS ... v
CONTENTS ...viii
LIST OF TABLES ... x
LIST OF ILLUSTRATIONS ... xi
LIST OF ANNEXES ...xii
CD CONTENTS ...xiii
CHAPTER 1. INTRODUCTION ... 1
1.1 BACKGROUND
AND AIMS ... 1
1.2 IMPLEMENTATION ... 2
1.2.1 Location ... 2
1.2.2 Time ... 2
1.2.3 Personnel ... 3
CHAPTER 2.
METHOD ... 4
CHAPTER 3.
RESULTS AND DISCUSSION ... 5
3.1
GENERAL CONDITIONS IN NANGGROE ACEH DARUSSALAM PROVINCE ... 5
3.2
SOIL AND AGRICULTURE ... 8
3.2.1
Soil ... 8
3.3 WETLANDS
AND FISHERIES ... 14
3.3.1
Inland and Marine Fisheries ... 14
3.3.2 Coral
Reefs ... 14
3.3.3 Wetlands ... 16
3.4 FORESTRY
AND
BIODIVERSITY ... 23
3.4.1 Forest Cover ... 24
3.4.2 Forest Area ... 24
3.4.3 Disturbances/Pressures on Forest Areas ... 29
3.4.4
Some Results of Disturbances/Pressures on Forest Areas ... 31
3.4.5 Biodiversity ... 31
3.5 ENVIRONMENTAL
REHABILITATION AND RECONSTRUCTION ACTIVITIES
BY WORKING GROUPS
... 34
CHAPTER 4.
DISCUSSION AND EVALUATION ... 37
4.1 CONSTRAINTS ... 37
4.2 RECOMMENDATIONS ... 37
LIST OF TABLES
Table 1.
List of DCAC activities August – October 2006 ... 2
Table 2.
Plantations: area and production ... 12
Table 3.
Coral Reef: Location and Damage ... 15
Table 4.
Area of mangrove forest with rehabilitation potential & area damaged by
tsunami, in NAD Province ... 18
Table 5.
Area of Swamp impacted by Tsunami ... 20
Table 6.
Gunung Leuser National Park ... 27
Table 7.
Important Bird Areas (IBA), according to BirdLife International ... 28
Table 8.
Encroachment & Logging in the Leuser Ecosystem ... 29
Table 9.
Active Forest Concession Areas in NAD Province, 2006 ... 30
Table 10.
Revoked Forest Concessions in NAD Province, 2006 ... 30
Table 11.
Degradation of 3 (three) watersheds in NAD Province ... 31
Table 12.
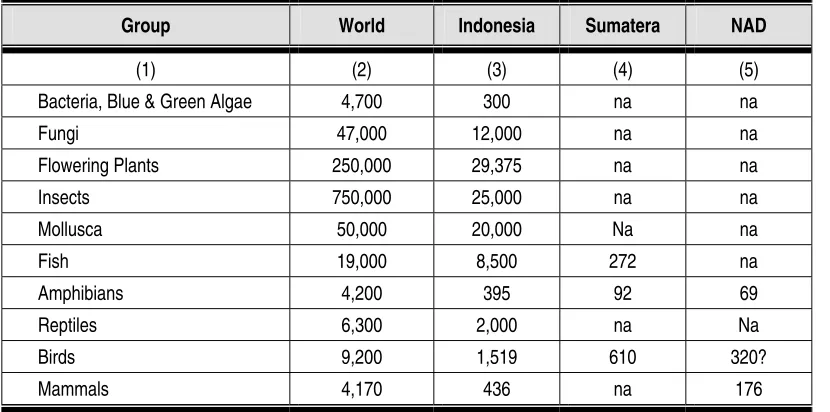
Biodiversity Statistics ... 32
LIST OF ILLUSTRATIONS
Figure 1.
Map of Nanggroe Aceh Darussalam Province ... 5
Figure 2. Topography of NAD Province ... 6
Figure 3. Soil Map of NAD Province ... 6
Figure 4. Map of Kabupaten Simeulue District... 7
Figure 5. Rice Production (1999 – 2005) in NAD Province... 19
Figure 6. Production of Secondary Crops (1999 – 2005) in NAD Province ... 11
Figure 7. Vegetable Crops: Area under Cultivation and Area Harvested in NAD
Prov. (2004 – 2005) ... 11
Figure 8. Plantation Damaged by Tsunami in 2004 ... 12
Figure 9.
Map of coral reef distribution in NAD Province... 16
Figure 10. Map of mangrove distribution in NAD Province... 17
Figure 11. Lagoon between Menusah and Pulot village in Kecamatan Leupung
sub-district, Aceh Besar, NAD ... 19
Figure 12. Area (left) and production (right) of brackish aquaculture ponds during
2003 – 2005 ... 21
Figure 13. Area (left) and production (right) of freshwater aquaculture during 2003 –
2005 ... 22
Figure 14. Conservation Forest in NAD Province ... 26
Figure 15. Forest functions, based on Governorial Decree No. 19 of 1999 ... 26
Figure 16. Forest areas, based on ease of access, in NAD Province ... 28
Figure 17. Some species of vegetation found in NAD Province
...
33
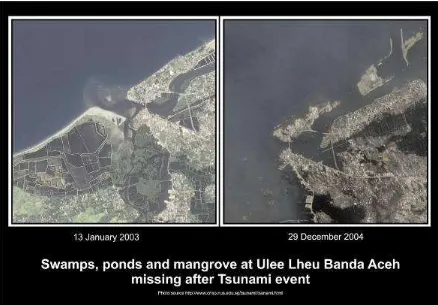
Figure 18. Satellite photo: Conditions in Ulee Lhue, Banda Aceh before and after
the Tsunami ... 34
LIST OF ANNEXES
Annex 1.
List of Stakeholders contacted/visited by UNEP GDA Team ... 53
Annex 2. List of Literature on the Environment Pre- and Post-Tsunami, by
Organisation/Institution ... 57
Annex 3.
Chemical Conditions of Soil in NAD Province ... 75
Annex 4.
(Soil Research Centre, Pusat Penelitian Tanah,, 1983)... 77
Annex 5.
Results of Physical Analysis of Soil in NAD Province ... 78
Annex 6.
Agriculture Pre- and Post-Tsunami... 79
Annex 7.
Production of Rice and Secondary Crops in NAD Province ... 81
Annex 8.
Vegetables: Area Planted and Area Harvested in NAD Province
(2004-2005) ... 82
Annex 9.
Plantations: Area and Production (2000-2005)... 82
Annex 10. Fishing Statistics Pre-Tsunami ... 83
Annex 11. Coral Reef Statistics: Pre- and Post-Tsunami ... 89
Annex 12. Wetlands Statistics... 95
Annex 13. Forest Cover ... 118
Annex 14. Conservation Forest in NAD Province ... 120
Annex 15. Forest Function Based on Decree No.19 (1999) of the Governor of NAD
Province ...121
Annex 16. Land Use and Status in Nanggroe Aceh Darussalam Province ... 122
Annex 17. List of Fauna in NAD Province... 129
Annex 18. List of Stakeholders Involved in Environmental Activities in NAD ... 146
CD Contents
1.
“Green” Environmental Data Assessment (UNEP-GDA) Project Technical Report
2.
Data and Information on Coast, Wetlands and Fisheries
3.
Data and Information on Soil and Agriculture
4.
Data and Information on Forestry, Biodiversity and Protection Areas
5.
Data and Information on Environmental Rehabilitation and Reconstruction Activities by
Working Groups
6.
Map: “Coastal Management”
1. Introduction
1.1.
BACKGROUND AND AIMS
The disastrous earthquake and tsunami of 26 December 2004 devastated almost the entire coastal
region of Nanggroe Aceh Darussalam (NAD) Province and the neighbouring islands of Simeulue
and Nias. This catastrophe not only took many thousands of lives but also caused enormous
material (physical) and non-material (socio-economic) loss. To deal with the post tsunami
conditions, the government embarked upon a three-phase restoration program: stage 1 emergency
response, stage 2 rehabilitation and stage 3 reconstruction.
NAD Province is currently at the stage of rehabilitation; this applies to all aspects, including the
environment. The many parties actively engaged in efforts to restore the environment (donors,
NGOs and government) need data and information which is detailed, comprehensive and relevant
to the environmental rehabilitation program to be undertaken. For this reason, it is essential to have
an environment database which can be used in the rehabilitation and reconstruction of the
environment in NAD Province.
To meet this need for environmental data and information (‘Green Data’), the UNEP – Post
Tsunami ‘Green’ Environmental Data Assessment (UNEP-GDA) in the Province of Nanggroe Aceh
Darussalam project was undertaken, funded by the United Nations Environment Programme
(UNEP), during August-September 2006. The Green data thus obtained can also be accessed
through the Online Document Repository (ODR), and comprises the following:
Data and information on environmental conditions before the tsunami,
Data and information on environmental conditions and rehabilitation after the tsunami,
Data and information on the environmental rehabilitation and reconstruction activities
undertaken by the various stakeholders after the tsunami.
All the data and information listed above was collected, compiled and analysed on the basis of the
following aspects:
Soil and agriculture,
Coastal areas and wetlands,
Inland and marine fisheries,
Biodiversity,
Terrestrial and coastal forests and protection areas,
Environmental rehabilitation and reconstruction by stakeholders.
1.2 IMPLEMENTATION
1.2.1 Location
The project encompassed the entire province of NAD, especially those areas impacted by
the tsunami.
1.2.2 Time
The project lasted from August to October 2006. In brief, the UNEP-GDA Team’s tasks
were to draw up a work plan, coordinate the team, collect and compile Green data. Table
1 below presents an outline of DCAC (Data Collecting and Assessment Consultant)
activities from August to October 2006.
Table 1. List of DCAC activities August – October 2006
No.
Activity
Time
Location
Description
1
Coordination of
UNEP-GDA Team
August 2006,
weeks I-III
WI-IP
office,
Bogor
•
Draw up a work plan for DCACs and
the UNEP-GDA Team as a whole.
•
Coordinate the whole UNEP-GDA
Team, both DCACs from Bogor and
DCACs from Aceh, with regard to who
will collect and need which data,
where, when, and how it will be
obtained.
•
Visits to institutions implementing
green projects (Annex 1).
Output
: maps, secondary data, etc
•
Coordinate Team for visit to Banda
Aceh to collect data.
2
Trip I to Banda Aceh
and surrounding area,
to collect data
August 2006,
weeks II-IV
WI-IP Aceh
office
,
Banda
Aceh
•
For their trip to Banda Aceh the
DCACs from Bogor were divided into
2 contingents: Week II (1 person) and
Week III (3 persons).
•
Coordination with Aceh DCACs
concerning what data had already
been obtained and what data had not
•
Visits to institutions implementing
green projects (Annex 1).
Output
: digital mapping from GTZ,
latest report from BPTP NAD, working
groups’ activities from BRR, etc.
No.
Activity
Time
Location
Description
3
Input Green data
September
2006
WI-IP
office,
Bogor
•
DCACs attend ICZM Workshop held
by GTZ in Banda Aceh (6-7
September 2006).
Output
: data on mangrove, coral
reefs, inland fisheries, from
stakeholders.
•
Compile Green data.
•
Enter Green data into ODR
•
Write Progress Report
4
Final Report
October 2006
WI-IP
office,
Bogor
•
Write Final Report
•
Submit Final Report
1.2.3 Personnel
The data were collected and compiled by the Data Collecting and Assessment Consultants
(DCAC), including:
1.
I Nyoman Ngurah Suryadiputra
Project Manager
2. Novana
Sari
Team Coordinator
3.
Fadia Miralka
Fisheries and Wetlands Consultant
4. Ferry
Hasudungan
Biodiversity and Forestry Consultant
5.
Lili Muslihat
Soil and Agriculture Consultant
6.
Ita Sualia
Data Collector (in Banda Aceh)
7.
Eko Budi Prihanto
Data Collector (in Banda Aceh)
8. Sulfianto
Data collector (in Simeulue)
2. Method
Green data consists of observation/survey results and secondary data, both qualitative and
quantitative, classified according to previously determined categories or aspects. These are:
a.
Environmental activities undertaken by working groups
b.
Agriculture and the physical & chemical conditions of soil and water
c.
Terrestrial and coastal forestry, biodiversity and protection areas
d.
Wetlands, inland and marine fisheries
The time-line for the Green data is from before until after the disastrous earthquake and tsunami,
i.e. 1999-2006. Data were obtained through the internet, visits to relevant institutions, and from
WI-IP’s reference collection. Material came in a wide range of formats, including hardcopies,
softcopies, research reports, project proposals, papers, leaflets, maps, scripts and articles.
3. Results
and
Discussion
3.1
GENERAL CONDITIONS IN NANGGROE ACEH DARUSSALAM
PROVINCE
Aceh is situated between latitudes 2
o- 6
oNorth and longitudes 95
o- 98
oEast and is approximately
125 m above sea level. Most of the province has a humid tropical climate, with the exception of the
northern part of Aceh. Rainfall ranges 2000-4000 mm/year with a high air and soil temperature
regime (>22
OC) throughout most of the year.
NAD Province covers a total of 59,950.77 km
2, comprising 17 ‘kabupaten’ districts, 4 municipalities,
241 ‘kecamatan’ sub-districts and 5,985 villages (including ‘kelurahan’). Forest covers 33,356.13
km
2, wet ricefields 3,565.10 km
2, and dry land 23,029.54 km
2(Bappeda, 2005). Based on
Presidential Regulation No. 30 for year 2005, the length of the north-east coast is 761 km and the
west-south coast 706 km.
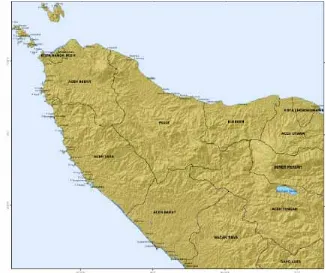
Figure 1. Map of Nanggroe Aceh Darussalam Province
Figure 2. Topography of NAD Province.
Histosol (peat), Entisols and Inceptisols are found in flat to undulating regions in alluvium and/or
sedimentary geological formations. Molisols and Alfisols are found in karst hills, Ultisols and
Oxisols in sedimentary rock and metamorphic rock formations, while Andisols occur in
mountainous regions with volcanic rock formations.
Figure 3. Soil Map of NAD Province
93
3
188
608
1,326
2,564
0 500 1,000 1,500 2,000 2,500 3,000
a
rea
(
x1
0
00
h
a
)
0-3 3-8 8-15 15-30 >30 slope
Kabupaten Simeulue
Kabupaten Simeulue District is a group of 41 large and small islands situated between longitudes
95
°
45’ 23” and 96
°
26’ 41” East, and latitudes 2
°
19’ 3” and 2
°
26’ 41” North. Administratively, it is
part of the province Nanggroe Aceh Darussalam (NAD). Its capital is Sinabang on Pulau Simeulue
island. The whole of the Kabupaten Simeulue District extends across a total of ±187,277.62 Ha,
has 264 km of coastline, and 9,851.796 km
2of waters. It is subdivided into 8 kecamatan
sub-districts, 16 bano/mukim and 135 villages.
Figure 4. Map of Kabupaten Simeulue District
As regards climate, this district has an average temperature range 25.5
0C – 26.3
0C with an annual
average of 25.8
0C. The highest temperature occurs in May and the lowest in August, November
and December. Atmospheric humidity ranges from 88.8 % to 91.0 %, the highest humidity being in
September and December and the lowest in January.
%
P. Pinang P. SIUMAT
P. TEUPAH
Tg. Cakar BAhar Tl. Tanjung Raya
6 0 6 12 Kilometers
3.2
SOIL AND AGRICULTURE
The tsunami at the end of 2004 in NAD province caused considerable damage to agricultural land.
Efforts to rehabilitate it have begun but are generally still at the level of evaluation and monitoring
of land resources, although some trials have also been carried out. Rehabilitation has been limited
to making physical improvements to the land, so an effort is needed to improve the fertility of its
soil, including washing out its salinity, sodicity, and high pH. Urgent repairs need to be made to the
supporting infrastructure in order to speed up the land rehabilitation process and to overcome the
difficulties the farmers are experiencing. The farmers’ economic capacity needs to be restored by
providing them with the means of production, working capital, and technical guidance on farming
which is oriented toward business and environment. Coordination among the various parties
concerned in land rehabilitation needs to be made more effective.
3.2.1 Soil
For the assessment by WI-IP, the chemical and physical properties of soils were obtained
by analysing soil samples taken from a number of selected locations throughout those
parts of NAD province affected by the tsunami.
Chemical Properties
Soil fertility was studied by assessing the chemical properties of the soil samples.
Substances tested for included: organic C, phosphate, total N content, potassium, cation
exchange capacity (CEC), base saturation, aluminium, and soil reaction. The soils’
chemical properties can be seen in Annex 3 and their criteria in Annex 4.
Physical Properties
The physical properties of soil are important to the interrelationship between soil, water and
vegetation. The most important factors are aeration and the availability of water in the soil.
Aeration depends on the soil’s structure (the number of pores) and permeability. Soil with
sufficient pores does not necessarily have good aeration if some of the pores are filled with
water.
The results of the analysis of physical soil properties in Annex 5 shows that in lowland tidal
swamp plains or alluvial basins the soil does not (yet) possess structure, the number of
aeration pores is low, and permeability moderate. This is because the land is saturated
with water. In land with sandy texture, the development of soil structure is still low with a
moderate to high number of aeration pores and high permeability.
3.2.2 Agriculture
The characteristics and types of agricultural land in Aceh Province tend to differ according
to whether it is in lowland, which marks the transition from shore to hills, or in the uplands.
Lowlands are more often used for food and secondary crops, while the uplands are usually
for plantations.
Agricultural Land Area and Production Before and After the Tsunami
As can be seen from Annex 6, the total area of agricultural land used for food crops (rice and
secondary crops) in 2004 was around 1,578,380 ha, which consisted of 356,397 ha ricefield,
983,389 ha dry field, and 240,594 ha gardens. This land provided a source of livelihood for
the community and had a strategic value in improving the economy in NAD Province.
The tsunami devastated approximately 61,816 ha of the land for food crops and
horticulture, comprising 37,471 ha wet ricefield and 24,345 ha dry upland fields (FAO,
2005). According to data from the National Disaster Management Team of the Ministry of
Agriculture, however, the area of land damaged was wet ricefield 20,206 ha, plantation
102,461 ha and dry fields 31,265 ha, together adding up to a total of 153,932 ha, as well as
the loss of 1,904,587 head of livestock.
Prior to the earthquake and tsunami disaster, agricultural land resources, comprising wet
ricefield and dry fields, had experienced considerable improvement both as regards the
increase in area and the increase in yield. The pattern of crops planted in irrigated ricefield
(technical, semi-technical and rural) was rice–rice–secondary crop; that for rain-fed
ricefields was rice–secondary crop. Productivity was 4.02 kw/ha for wet ricefield and 22.02
kw/ha for dryland rice (Dinas Tanaman Pangan & Hortikultura, NAD). Figures reported by
the Institute for the Study of Agricultural Technology (BPTP) recorded pre-tsunami
productivity of wet ricefields as 4.31 – 5.90 ton/ha with an average of 4.7 ton/ha dry hulled
rice. Two months after the tsunami, farmers tried to replant the wet ricefields they had
already cleaned out; their first post-tsunami crop showed a 20-40% decrease in yield.
Rice production from 1999 to 2001 decreased from 1,478,602 ton to 1,246,614 ton, then
increased during 2002-2004 to 1,552,083 ton (Figure 5). Agricultural production,
specifically rice and secondary crops, for 1990 -2005 is presented in Annex 7.
Figure 5. Rice Production (1999-2005) in NAD Province
1,478
1999 2000 2001 2002 2003 2004 2005
Year
Following the tsunami, the degradation of 20,000
30,000 ha of farmland caused rice
production to fall from 1,522,083 ton in 2004 to 1,403,139 ton in 2005, a drop of about
148,944 ton (9.6%). Maize production, which had risen steadily from 36,642 ton in 2000 to
94,427 ton in 2005, did not appear to be affected by the tsunami. Soybean production,
which had been high in 1999 (106,480 ton), showed a very worrying decline during 2000 to
2003 plummeting to a low of only 18,698 tons, then rising again in 2004 and 2005 to
31,170-31,076 ton. The production of other crops, such as peanuts, mung beans, cassava
and sweet potato, fluctuated from 2002 with a rise in 2004 followed by a slight decrease in
2005 (Figure 6).
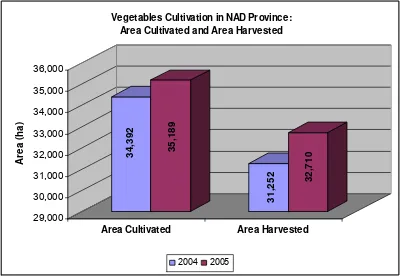
Besides staple food crops, horticulture supplied the community with fruit and vegetables. In
2004, the area under cultivation for vegetables was 34,392 ha, of which 31,252 ha was
harvested , yielding a total of 1,976,774 kw, a productivity rate of 63 kw/ha (Figure 7). For
fruit, the total area harvested was 13,505 ha, production 268,356 ton and productivity 19
ton/ha (54.61 kg/tree/year). After the tsunami, there was an increase in the area put under
cultivation for horticulture but an overall decrease in harvested area, production and
productivity. For vegetables, the cultivated area rose to 35,189 ha and harvested area to
32,710 ha, while production fell to 1,824,796 kw and productivity to 55.6 kw/ha (Annex 8).
0 20,000 40,000 60,000 80,000 100,000 120,000
Secon
d
ar
y Cr
op
s Pr
oduct
ion (
tons)
1999 2000 2001 2002 2003 2004 2005
Year
Production of Secondary Crops in NAD Province (1999-2005)
Corn Soybean Peanut Mung beans Cassava Sweet potato
Figure 7. Vegetable Crops: Area under Cultivation and Area Harvested in NAD Prov. (2004 – 2005)
3.2.3 Plantations
Plantation Area and Production Before and After the Tsunami
The estate crops sub sector plays an important role in mobilising the regional economy. In
2003, plantations contributed 6.66% to the regional income of NAD Province, and provided
new jobs for 13,935 people. However, prolonged conflict caused the economy of both
community-owned and large-scale plantations to deteriorate.
Based on 2004 figures, plantations in NAD Province cover a total of 726,103 ha, which is
made up of 199,956 ha large-scale plantations and 526,147 ha community-owned.Records
show that 254,666 ha of community-owned plantations, i.e. 48.41% of the total, were
abandoned and became degraded because their owners were too afraid to work on them.
With the conflict still unresolved, another disaster – the tsunami – struck, causing further
loss and degradation to plantation assets, affecting 22,305 ha (4.24% of total plantation
area).
34,
392
35,
189
31,
252 32
,710
29,000 30,000 31,000 32,000 33,000 34,000 35,000 36,000
Area (
h
a)
Area Cultivated Area Harvested Vegetables Cultivation in NAD Province:
Area Cultivated and Area Harvested
Table 2.
Plantations: area and production
Large-scale
Plantations
Community
Plantations
Total
Area (ha) in 2004
199,956
526,147
726,103
Production (ton) in 2004
244,346
678,265
922,611
Tsunami Conflict Maintained
Plantations damaged
22,305 254,666 249,176
Source : Dinas Perkebunan Propinsi NAD (2000 - 2005)
The main commodities for plantation are coconut, rubber, oil palm, cacao, coffee, cloves
and nutmeg. Total production is 922,611 ton, of which 244,346 ton is from large-scale
plantations and 678,265 ton from community-owned (Annex 9). Plantation affected by the
tsunami tended to be situated all along the coast (22,305 ha), the most heavily affected
being the communities’ coconut plantations (10,281 ha). Other plantations affected were
rubber (4,282 ha), oil palm (2,346 ha), cacao (1,230 ha) and clove (997 ha) (Figure 8).
Nevertheless, the communities’ estate crop production did not fall after the tsunami but, on
the contrary, rose from 678,265 ton in 2004 to 721,302 ton in 2005, an increase of about
43,074 ton or 6.35%.
10,667 4,282
2,346
99
7 1,230
0 2,000 4,000 6,000 8,000 10,000 12,000
ar
ea
(
h
a)
coconut rubber oil palm clove cacao
commodity
Plantation hit by Tsunami
Damage Caused by the Tsunami
Soil has high levels of salinity and sodium
Marine mud deposits
Debris and wreckage of buildings
Damaged irrigation and drainage ditches
Salinity indicates the content of elements and organic compounds such as Na
+, Mg
2+, K
+,
Cl
-, SO
42-, HCO
3-, NO
3-and CO
32- in a solution. In the context of soil, salinity indicates the
level of salt dissolved in the soil. High salinity and sodicity levels occur because the sea
water and sediment, which are saline and contain exchangeable Na, reached far inland:
1-2 km from the shoreline (east coast) and 4-5 km (west coast). Na+ compounds have the
effect of breaking up the soil structure, giving rise to a reaction that renders the nutrients
unavailable to the plants. Such conditions disturb plant growth.
Results from a survey conducted by a Team from FAO (in collaboration with the
Agricultural Research and Development Agency Badan Litbang Pertanian and the
Directorate General for Food Crops, Ministry of Agriculture) during 29 January
8 February
2005, showed that the salinity of surface water and sediment was still high, as indicated by
electrical conductivity (EC) readings of 5
10 mS/cm (Pidie), 0.1
6.5 mS/cm (Bireuen) and
44
>100 mS/cm (Aceh Utara). By March 2005, salinity levels had begun to decline, as
indicated by EC ranges of 0.2
2 mS/cm (Pidie), 0.1
3.2 mS/cm (Bireuen), and 7
17 mS/cm
(Aceh Utara), with the result that part of the tsunami affected area could start to be
replanted (BPTP-NAD 2006).
Sediment along Aceh’s east coast was found to be 5
20 cm thick and saline. In dry
conditions, this clayey soil will become hard, cracked and difficult to work. Moreover, the
debris and wreckage from buildings together with the damage to irrigation channels will
obstruct the hydrology, the land will flood resulting in high levels of iron and aluminium
which could poison the vegetation.
Land rehabilitation
Efforts made to rehabilitate the land are as follow:
Civil Engineering Work. The first step is to clear away the debris and rubble.
Repair irrigation/drainage channels and roads so that salt can be washed away
more effectively, and construct drainage channels on land where none previously
existed.
Desalination. Land is washed at intervals of 1 or 2 weeks using either rainwater or
river water. Drainage channels must be dug for this so that the water flows away
quickly from the land.
Repair soil fertility. Land with high sodicity should be treated with gypsum
(CaSO
42H
2SO
4depending on exchangeable Na content), sulphur, calcium and
organic matter.
3.3
WETLANDS AND FISHERIES
The aspect of fisheries and wetlands is divided into ten areas: fisheries, mangrove, lakes, rivers,
swamps and reservoirs, sandy beach, brackish water aquaculture ponds (tambak), freshwater
aquaculture, coral reefs, and lagoons. Data were obtained on area, production, species of biota,
etc. The data came from a variety of government institutions, such as the Marine Affairs and
Fisheries Office (Dinas Kelautan dan Perikanan), Water Resources Office (Dinas Sumber Daya
Air) and Central Bureau of Statistics (Biro Pusat Statistik), and from local and international NGOs
such as the Indonesian Coral Reef Foundation (Yayasan Terumbu Karang Indonesia (Terangi)),
WIIP, WCS, UNESCO. Data was received in a variety of formats, with some parts left blank, which
made analysis difficult.
3.3.1
Inland and Marine Fisheries
Fisheries comprises both marine and inland fisheries, supported by a fishing fleet which
includes both unmotorised boats and boats powered by an outboard motor or engine. Prior
to the tsunami, the condition of the fishing sector tended to fluctuate and differed from
place to place, depending on the size of the fishing fleet. Fish production would rise
following an increase in the number of boats and fall following a decrease.
After the tsunami, the assistance generally given by stakeholders, i.e. government as well
as foreign and community NGOs, was to repair and build boats and fishery facilities such
as fish auction places, harbours and the like. In view of the pre-tsunami trends, it can be
expected that an increase in the size of the fishing fleet will lead to a similar increase in fish
catches (Annex 10).
3.3.2 Coral
Reefs
Prior to the tsunami, the condition of coral covering the reefs was relatively good (Annex
11), although in some places it was poor as a result of bombing and tourist activities. After
the tsunami, the percentage of living coral cover along the east and west coasts of NAD
ranged from 1 to 64.8% and consisted of Acropora and Non Acropora.
Table 3. Coral Reef: Location and Damage
No.
Location
Total Area of
Coral Reef (ha)
Pre-tsunami Level
of Degradation (%)
Post-tsunami
Condition of
Coral Reef
1 Kepulauan
Weh
(Pulau
Rubiah)
2,600* 38-44.25%
Little
change
2
Pulau Banyak
227,000
50-75%
No Data
3
West coast of NAD
65,876
No Data
Thought to be
destroyed
- LhokNga-Banda Aceh
2,900
No Data
Thought to be
destroyed
- Aceh Singkil
22,400
No Data
Thought to be
destroyed
- Lamno-Calang-Meulaboh
16,800
No Data
Thought to be
destroyed
4
Simeulue
23,776
No Data
Thought to be
destroyed
5 Pulo
Aceh
15,791
Source :
* Dinas Kelautan dan Perikanan NAD, in Bappenas 2005, Pulau Weh National Park, Sabang, Nangro Aceh Darussalam Yuni Ikawati, Puji S. Hanggarawati, Hening Parlan, Hendrati Handini and Budiman Siswodihardjo, 2001. Terumbu Karang di Indonesia. MAPPITEK-Jakarta;
The tsunami overturned and damaged coral in shallow water but did not have a big impact
in deep water. Its effect on coral reef took the form of sedimentation for less than a week
and uplift like that which occurred at Pulau Simeulue, where a 100m width of reef was
exposed to the air to a height of 50-200m as a result of which the coral died. If the length of
Pulau Simeulue’s coastline is 264km, it can be estimated that 2640 ha of coral was
damaged due to uplift. Such uplift of coral reef leads to a drop in fish production. This is
because of the reduction in fish habitat, i.e. the coral reef that provides spawning and
feeding grounds for fish.
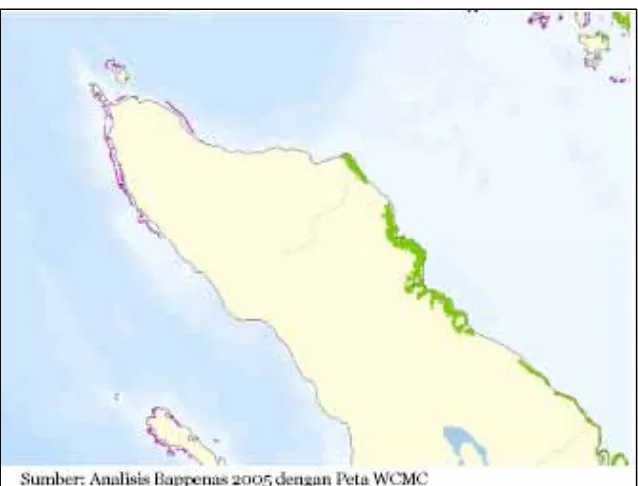
Figure 9. Map of coral reef distribution in NAD Province
Note: Coral reef (purple) is distributed along the whole of Aceh’s west coast, around Pulau
Sabang, and a little on the north coast. Mangrove (green) is distributed evenly along the
whole of the east coast. Area of coral reef detected by satellite imaging is 89,652 ha.
3.3.3 Wetlands
As defined by WIIP, wetlands are areas of swamp, brackish water, peatland, and
permanent or transient waters, with standing or flowing water that is fresh, brackish or salt,
including marine areas that are no more than six metres deep at low tide (Annex 12). An
analysis of these areas is described below.
Mangrove Forest
Figure 10. Map of mangrove distribution in NAD Province
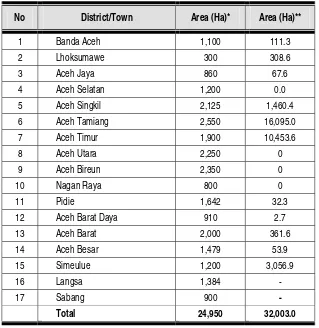
Table 4. Area of mangrove forest with rehabilitation potential & area damaged by
tsunami, in NAD Province
No
District/Town
Area (Ha)*
Area (Ha)**
1 Banda
Aceh
1,100
111.3
2 Lhoksumawe
300
308.6
3 Aceh
Jaya
860
67.6
4 Aceh
Selatan
1,200
0.0
5 Aceh
Singkil
2,125
1,460.4
6 Aceh
Tamiang
2,550
16,095.0
7 Aceh
Timur
1,900
10,453.6
8 Aceh
Utara
2,250
0
9 Aceh
Bireun
2,350
0
10 Nagan
Raya
800
0
11 Pidie
1,642
32.3
12
Aceh Barat Daya
910
2.7
13 Aceh
Barat
2,000
361.6
14 Aceh
Besar
1,479
53.9
15 Simeulue
1,200
3,056.9
16 Langsa
1,384
-
17 Sabang
900
-
Total
24,950 32,003.0
Source : data obtained from several sources
* Area with rehabilitation potential, Provincial & District Forestry Office (Dinas Kehutanan Propinsi & Kabupaten);
** Area of mangrove forest damaged by tsunami LAPAN, 2005
From the interpretation of volunteers’ photographs of the coast and a variety of other
information, it can be estimated that the level of tsunami damage to mangroves was as
follows:
1.
Aceh Besar 100% (approximately 26,823 ha)
2.
Banda Aceh 100% (< 500 ha)
3.
Pidie 75 % (17,000 ha)
4.
Aceh Utara and Bireun 30% (26,000 ha)
5.
Aceh Barat 50% (14,000 ha)
The tsunami not only devastated the mangrove forests by uprooting the trees from the
substrate, it also lifted the substrate with the result that the mangrove were no longer
inundated or reached by the tides. Field orientation in Tibang village revealed that all of
the mangrove forest on the coast had been totally destroyed. However, the young
mangrove that the community had planted around their tambak aquaculture ponds had
escaped serious damage.
Lakes
Lakes in NAD are the Laut Peneng Suasa, Lincier, Bungara, Laut Bangko, Laut Tawar and
Aneuk Laot. During pre-tsunami conditions, Laut Tawar had increased in size from 5,472
ha in 2000 to 5,782 ha in 2004. Vegetation around the lake comprised Cyperus, Nympahae
alba, Colocasia esculenta, Phragmites karka. For the other lakes, no comparative data is
available. Post-tsunami lake conditions cannot be described as too little data was obtained.
Lagoons
Six lagoons were formed as a result of the tsunami on the west coast of NAD. Previously,
these had been estuaries, fish ponds and ricefields that faced the sea. About 11 species of
fish inhabit these lagoons: Kakap (Lates carcarifer), Bayam (Lutjanus argentimaculatus),
Merah mata (Caranx sp.), Kerape (Ephinephelus spp.), Kirung (Mesopristes argentus),
Saridin (Ambassis sp.), Ciri (Leiognathus equlus), Kapur-kapur (Gerres acinaces), Cabeh
(Scatophagus arguna), Marang (Siganus javus) and Belanek (Mugil cephalus) (Based on
assessment by Wetlands International-Indonesia Programme).
Figure 11. Lagoon between Meusanah and Pulot village in Kecamatan Leupung
sub-district, Aceh Besar, NAD. (Source : Cahyo Wibisono, I.T. & Suryadiputra, I N.N. 2006)
Rivers
Swamps-Reservoirs
The biggest swamp forest is in Aceh Singkil and covers 38,141.78 ha. NAD’s swamp area
has shrunk rapidly, from 132,988.41 ha in 2002 to only 68,079 ha in 2004. Vegetation
commonly found are Ketepeng (Senna alata), ki kebo (Mimosa pigra),
Scirpus spp.,
Spaghnum spp., Hymenachne pseudointerupta.
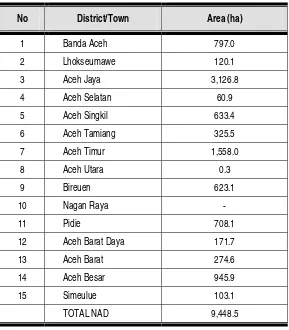
From the interpretation of satellite images by LAPAN in 2005, it is known that 9,448.5 ha of
swamp were affected by the tsunami. The district with the greatest area of swamp damage
was kabupaten Aceh Jaya (3126.8 ha), and that with the least was kabupaten Aceh Utara
(0.3 ha). Further details are given in Table 5 below.
Table 5. Area of Swamp impacted by Tsunami
No
District/Town
Area (ha)
1 Banda
Aceh
797.0
2 Lhokseumawe
120.1
3 Aceh
Jaya
3,126.8
4 Aceh
Selatan
60.9
5 Aceh
Singkil
633.4
6 Aceh
Tamiang
325.5
7 Aceh
Timur
1,558.0
8 Aceh
Utara
0.3
9 Bireuen
623.1
10 Nagan
Raya
-
11 Pidie
708.1
12
Aceh Barat Daya
171.7
13 Aceh
Barat
274.6
14 Aceh
Besar
945.9
15 Simeulue
103.1
TOTAL
NAD
9,448.5
Source: Lapan, 2005
Sandy beach
Formations found on sandy beaches are pes-caprae and Barringtonia. Pes-caprae
formations are dominated by the herb Ipomea pes-caprae, known locally as galaran or
katang-katang. Starting from the back of the beach, this herb slowly creeps towards the
front and sides. Barringtonia formations are usually found behind Pes-caprae. Soil
conditions are usually sandy but mixed with ordinary mineral soil (Cahyo Wibisono, I.T. &
Suryadiputra, I N.N., 2006). Approximately 300 km of coast were hit by the tsunami.
Coconut and sea pine are usually found in this area.
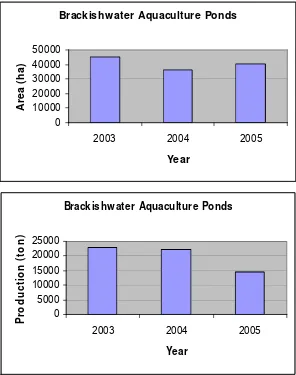
Brackish water aquaculture
It can be seen from the data for 2003 to 2005 that the area devoted to brackish water
aquaculture decreased in 2004 then increased in 2005, but that production decreased
throughout the period 2003 – 2005. In 2003, brackish aquaculture ponds (tambak) covered
44,882.8 ha in 2003, decreasing to 40,077.7 ha in 2005 (Figure 12). Species of biota
generally cultivated in these ponds included jumbo tiger prawns (udang windu), white
shrimp (udang putih), milk fish (bandeng) and crabs.
Brackishw ater Aquaculture Ponds
0
10000
20000
30000
40000
50000
2003
2004
2005
Year
A
rea (
h
a)
Brackishw ater Aquaculture Ponds
0
5000
10000
15000
20000
25000
2003
2004
2005
Year
P
rod
uc
ti
on
(
ton
)
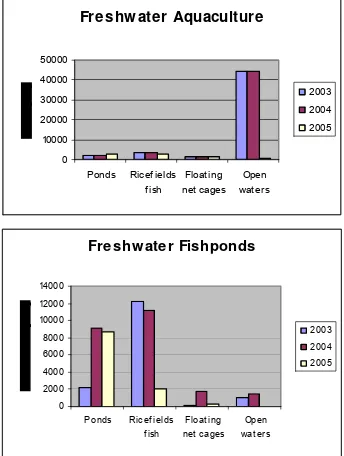
Freshwater aquaculture
Freshwater aquaculture includes fish farming in ponds and floating net cages, in public
waters and in wet rice fields (mina padi). Data from BPS for 2003-2004 and from the
Marine Affairs and Fisheries Office (Dinas Kelautan dan Perikanan) for 2005 show a
decrease in area for ricefield fish (mina padi), floating nets and public waters. However,
fishpond production increased during 2003-2005, whereas ricefield fish production fell
sharply, and production from floating net cages and open waters fluctuated.
Freshw ater Aquaculture
0 10000 20000 30000 40000 50000
Ponds Ricef ields
f ish
Float ing net cages
Open wat er s
2003
2004
2005
Freshw ater Fishponds
0 2000 4000 6000 8000 10000 12000 14000
Ponds Ricef ields
f ish
Float ing
net cages
Open
wat er s
2003
2004
2005
3.4
FORESTRY AND BIODIVERSITY
Collection of data on forest cover, conservation area and biodiversity commenced in the second
week of August 2006. At the time of writing, efforts are still under way to obtain more information.
Forest Cover
Some data on this aspect was obtained from the NAD Provincial Forestry Office (Dinas
Kehutanan), Forest Watch Indonesia (FWI), the Leuser International Foundation (LIF), and several
parts of the Ministry of Forestry. Supporting data is still required in order to analyse and detect the
current trends, so as to be able to describe the condition of forest cover in NAD. The main
institution which must be visited to obtain this data is the Forestry Ministry, including the
Information Documentation Centre PUSDOKINFO, Inventorisation & Mapping (Inventarisasi &
Perpetaan), Planning Agency (Badan Planologi).
Conservation Area
Data on this aspect was obtained from the Conservation Office BKSDA NAD, in the form of leaflets,
softfiles and maps, as well as from the Forestry Office for NAD Province, and from the literature
(Wetlands International IP library, BirdLife Indonesia). From this data, it is possible to describe the
status, size and location of the conservation areas. However, it has not yet been possible to
accommodate information regarding the activities and issues which have been developing in each
area, as access to such information is still severely restricted.
Several criteria concerning areas important for wildlife are also included in this section, such as the
RAMSAR criteria, IBA & EBA from BirdLife International, and KPB from CI. However, this has been
limited due to the brevity of time provided for this data collection programme.
Biodiversity
Very little data has yet been collected on this aspect. In fact, a wealth of information on biodiversity
has been amassed by the LDP (Leuser Development Program, also known as the Unit
Management Leuser or UML), which worked for a long time on the Leuser Ecosystem Area (KEL or
Kawasan Ekosistem Leuser). However, the LDP has now completed its term of work, while its
successor the LIF (Leuser International Foundation) says that all the information resulting from the
LDP activities has been submitted to LIPI as the Scientific Authority. Up until the time of writing this
report, it had not yet been possible to make a special visit to LIPI in Cibinong.
3.4.1 Forest
Cover
Definition: Land where trees dominate the type of vegetation. The FAO defines forest as
“land with tree crown cover of more than 10% and area of more than 0.5 ha. The trees
should be able to reach a minimum height of 5 metres at maturity” (Forest Watch
Indonesia, 2003).
Note: It must be pointed out that a crown threshhold of 10% represents a very sparse tree
cover; most of Indonesia's natural forest is closed crown forest.
The Government of Indonesia employs a forest land use definition in several land use
categories comprising ‘Permanent Forest’.
In its report (Annex 13), the FWI states that permanent forest is land which is officially
designated as national forest and falls under the authority of the Forest Ministry. This term
refers to land use (land for various forestry interests), not to land cover (land on which
trees are growing). For this reason, land with 'permanent forest' status does not mean the
same as forest cover.
3.4.2
Forest Area
Definition:
There are several definitions of forest areas, but that used by Law No. 41, 1999 on
Forestry is as follows:
Forest area (Kawasan hutan) is a specific area designated or determined by the
Government to be maintained as permanent forest. The Government defines forest on the
basis of its primary function as:
1. conservation
forest
(hutan konservasi)
2.
protection forest (hutan lindung), and
3.
production forest (hutan produksi)
Conservation forest is forest with specific characteristics, whose primary function is to
preserve the biodiversity of flora, fauna and their ecosystems. It consists of the following :
a.
nature reserve forest (kawasan hutan suaka alam) is forest with specific
characteristics whose primary function is to preserve the biodiversity of flora, fauna
and their ecosystems, and which also functions as the region for a life support
system,
b.
nature conservation forest (kawasan hutan pelestarian alam) is forest with
specific characteristics whose primary function is to protect the life support system,
preserve the species biodiversity of flora and fauna, and utilise biological natural
resources and their ecosystems in a sustainable manner, and
Under the provisions of Law No. 5 of1990 concerning the Conservation of Biological
Natural Resources and their Ecosystems, the following classification of conservation areas
is described:
Nature Conservation Reserve (Kawasan Suaka Alam) is an area with specific
characteristics, both terrestrial and aquatic, whose primary function is to preserve the
biodiversity of plants, animals and their ecosystems, and which also functions as an area
for life support systems. Nature Conservation Reserves consist of:
i.
Nature reserve (Kawasan cagar alam) is a nature conservation reserve which
because of its natural condition possesses particular flora, fauna and their
ecosystems, or a specific ecosystem that needs to be protected, and whose
development progresses in a natural manner.
ii.
Wildlife reserve (Kawasan suaka margasatwa) is a nature conservation reserve
which possesses special characteristics in the form of biodiversity and/or unique
species of fauna whose future survival can be supported by protecting its habitat.
Nature Conservation Area (Kawasan Pelestarian Alam) is an area with specific
characteristics, both terrestrial and aquatic, which functions to protect the life support
system, preserve species diversity of plants and animals, and utilise biological natural
resources and their ecosystems in a sustainable manner, comprising :
i.
National park (Kawasan taman nasional) is a nature conservation area which
possesses a pristine ecosystem, managed through a zonation system, which is
utilised for the purposes of research, scientific knowledge, education, to support
cultivation, tourism and recreation.
ii.
Ecotourism park (Kawasan taman wisata alam) is a nature conservation area
whose main purpose is to be used for eco-tourism and recreation.
iii.
Grand forest park (Kawasan taman hutan raya) is a nature conservation area
for the purpose of providing a variety of indigenous and/or introduced plants and
animals for research, science, education, breeding enhancement, culture,
recreation and tourism purposes.
Based on the definitions above, Nanggroe Aceh Darussalam Province has the following
conservation areas (Annex 14):
1.
Taman Wisata Laut P. Weh (Pulau Weh Marine Park)
2,600 ha
2.
Taman Wisata Alam P. Weh (Pulau Weh Ecotourism Park)
1,300 ha
3.
TWL Kepulauan Banyak (Kepulauan Banyak Marine Park)
227,500 ha
4.
Taman Buru Lingga Isaq (Lingga Isaq Hunting Park)
80,000 ha
5.
Tahura Cut Nyak Dhien (Cut Nyak Dhien Grand Forest Park)
6,220 ha
6.
SM Rawa Singkil (Rawa Singkil Wildlife Reserve)
102,500 ha
7.
CA Pinus Jantho (Pinus Jantho Nature Reserve)
16,640 ha
Conservation Forest Area in NAD Province
Taman Buru Lingga Isaq, 80,000, 18% Tahura Cut Nyak Dhien, 6,220, 1%
SM Rawa Singkil, 102,500, 23%
TWL Kepulauan Banyak, 227,500, 53% Taman Wisata Laut P.
Weh, 2,600, 1% CA Pinus Jantho,
16,640, 4%
Taman Wisata Alam P. Weh, 1,300, 0% CA Serbajadi, 300,
0%
Figure 14. Conservation Forest in NAD Provinc (Source : BKSDA Provinsi Nanggroe Aceh Darussalam, 2006).
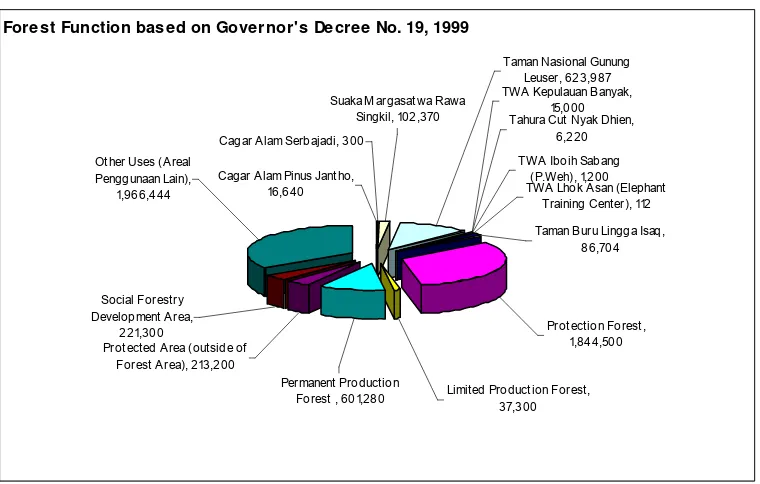
Despite some small differences in the figures for land area, this division of conservation
areas is reinforced in the directive Forest Function in the Province of Aceh (Fungsi Hutan
Wilayah Propinsi Daerah Istimewa Aceh) by the Governor of NAD Province, in the
decisions contained in the Governor's decree SK No.19 of 1999, dated 19 May 1999
(Annex 15). The graph below shows the types of forest function and their area in hectares.
Figure 15. Forest Functions, based on Governorial Decree SK No. 19 of 1999
(Source : Dinas Kehutanan Provinsi Nanggroe Aceh Darussalam, SK Gubernur NAD No. 19/1999).
Forest Function based on Governor's Decree No. 19, 1999
Ot her Uses (Areal Penggunaan Lain),
1,966,444
Social Forest ry Development Area,
221,300
Protected Area (outside of Forest Area), 213,200
Permanent Production
Forest , 601,280 Limited Product ion Forest , 37,300
Prot ect ion Forest , 1,844,500 Taman Buru Lingga Isaq,
86,704 TWA Lhok Asan (Elephant
Training Center), 112 TWA Kepulauan Banyak,
15,000 Taman Nasional Gunung
Leuser, 623,987 Suaka M argasatwa Rawa
Singkil, 102,370 Cagar Alam Serbajadi, 300
Cagar Alam Pinus Jantho, 16,640
TWA Iboih Sabang (P.Weh), 1,200 Tahura Cut Nyak Dhien,
Leuser Ecosystem
The Leuser Ecosystem (Kawasan Ekosistem Leuser or KEL), cannot be separated from
the forest cover of the NAD region. The Leuser Ecosystem, which includes the Gunung
Leuser National Park, Wildlife Reserve, Protection Forest and a number of
non-conservation areas, forms a natural defence situated between Laut Tawar lake in
Nanggroe Aceh Darussalam Province and Lake Toba in North Sumatera Province.
Administratively, it extends across 11 kabupaten districts (7 in NAD Province and 4 in
North Sumatera) which are: Aceh Tenggara, Aceh Barat, Aceh Utara, Aceh Timur, Aceh
Selatan, Aceh Tengah, Aceh Singkil, Deli Serdang, Langkat, Tanah Karo and Dairi.
This whole area forms one of the richest tropical rainforests in the world, measuring 2.6
million hectares. KEL was first introduced through the Forestry Minister’s Decree No.
227/Kpts-II/1995, later reinforced by Presidential Decree No. 33 of 1998.
The wealth of biodiversity in KEL is both enormous and unique. Research and observation
carried out by the Leuser Management Unit (UML) recorded the biodiversity of flora and
fauna found in KEL, including:
over 4,500 species of plant,
434 species of bird,
392 species of mammal,
171 species of herpetofauna (amphibians & reptiles)
350 species of insect, and
81 species of fish (UML Database, 2002 in Irfan, 2002).
This means that approximately 45 % of the estimated total number of plant species in the
Western Indo-malayan Region, 85% of all bird species in Sumatera and 54% of the
estimated total number of terrestrial animal species in Sumatera, are all found within the
Leuser Ecosystem.
A large part of KEL is the Gunung Leuser National Park, the size of which has been
officially decreed as shown in Table 6.
Table 6. Gunung Leuser National Park
Gunung Leuser National Park
Ministerial Decrees
Total area
(ha)
Area in
NAD
Area in
North Sumatera
Agriculture Minister: SK. Mentan No.
913/Kpts/Um/10/1982, & SK. Mentan No.
165/Kpts/Um/3/1982
792,675 573,690 218,985
Forestry Minister: SK. Menhut No. 276/Kpts-VI/97
1,094,682
na
Na
Note: Data is still limited and needs to be supplemented to give a clear picture of the extent and boundaries of
Other criteria pertaining to land/forest areas
Based on its function, or the condition of its supporting ecosystem, institutions competent
in environmental matters categorise forest areas under a number of terms, including the
following:
Important Bird Area (IBA) Æ BirdLife International
Table 7. Important Bird Areas (IBA), according to BirdLife International
Status & Area (ha)
IBAs in Nanggroe Aceh Darussalam
Province
Area (ha)
Conservation
Non-conservation
Gunung Leuser
1,700,000
1,094,692
605,308
Trumon Singkil
157,000
-
157,000
Simeulue 180,000
-
180,000
Forest areas based on accessibility
Source : Forest Watch Indonesia, 2003
Figure 16. Forest areas, based on ease of access, in NAD Province