61
This chapter discussed research place and time of the study, research type of the study, population and sample of the study, data collecting procedure, Instrument of the study, Instrument validity, reliability, data analysis procedures.
A. Place and Time of The Study
The study conducted at the tenth-grade students of SMA Nusantara Palangka Raya which is located on Jl. Dr. Wahidin Sudirohusodo No. 18 Palangka Raya. The research has been conducted for two months. It was August-September.
B. Research Type of The Study
This study used quantitative design. It was quantitative design because quantitative was the data that from of number using statistic data. According to Donald Ary, “Quantitative research a gunnery employing operational definitions to generate numeric data to answer predator mined hypotheses or questions.89 The design of this study was quasi – experimental design. This study used quasi – experimental design of this study to see the effect of cartoon towards students’ writing skill in narrative text. According to Millan, the purpose of quasi-experimental design was to determine cause and effect between independent and dependent variable. A common situation for implementing quasi-experimenta
89
study involves several classes or schools that used to determine the effect of curricular materials or teaching methods.90 In this study, cartoon was the independent variable which may cause/ influence students’ writing skill in the narrative text as the dependent variable.
This study used pre-test and post-test on the control and experiment group, to see the effectiveness of c a r t o o n by looking pre-test, and post-test measurement and comparing the gain scores between both classes. The effectiveness can be seen from the improvement of students’ score of experiment group in the post-test. The score was taken by the writer after students were given some treatments and from the comparison of both classes. The experiment group was given the technique by using c art o on in the classroom and the controlling group without using cartoon.
According to Morgan, the best alternative for an experimental design was a quasi-experimental format. The nonrandomized control group, pretest– posttest design was one of the most widely used quasi-experimental designs in educational research. The design was as follow91 :
90
James H. McMillan, Sally Schumacher, Research in Education Evidence-Based Inquiry6th Edition, (Boston: Allyn and Bacon, 2006), p. 24.
91
Tabel 3.1
The Schema of Quasi Experimental design
Subject Pre-test Treatment Post-test
E Y1 X Y2
C Y1 - Y2
Where are:
E : Experimental group used cartoon C : Control group used picture Y1 : Pre – test
X : Treatment Y2 : Post – test
Both of experiment group and control group took some pre test and post test, and the study was done at the same time. The experiment group learned English by using the cartoon (the treatment) and the control group taught by the traditional method, where the students just taught by using the picture and they asked to tell the picture in the form paragraph.
C. Population and Sample of the Study
1. Population
The population was all cases, situation, or individuals who share one or more characteristics.92 The population of this study was the tenth grade of SMA Nusantara Palangka Raya. The numbers of the population were 33 students. It consisted of two classes and each
92
class consists of 13-20 students.
Table 3.2 The Number of the Tenth Grade Students of
SMA Nusantara Palangka Raya
No Classes The Number of Students
1 X-1 20
2 X-2 13
The Total Number 33
2. Sample
The small group that called a sample and the larger group about which the generalization was made called a population. A population
was defined as all members of any well-defined class of people, events, or objects. For example, in this study which students in American high schools constitute the population of interest, you could define this population as all boys and girls attending high school in the United States. A sample was a portion of a population.93 This study used the sample of the population, the researcher applies cluster sampling. Cluster sampling was a probability sampling technique that randomly selects and used whole naturally occurring group such as intact classrooms or entire voting precincts as the samples (clusters).94The writer took two classes, class X-1 as an experimental class and class X-2 as a control class which would be related to this study.
93
Donald Ary, Lucy Cheser Jacobs & Asghar Razavich, Introduction to Research in Education, Eight Edition, Canada: Wadsworth Engage Learning, 2010. p.148 .
94
D. Data Collecting Procedure
The procedure to collected the data consists of some steps as follows: 1. The writer observed on Monday, October 5, 2015, the school by
headmasters’ permission.
2. The writer asked the class with the English teacher who taught English in the class that become the class of research:
a. The number of the class. b. The number of the students.
3. The writer determined the class into experiment group and control group.
4. The writer gave pre-test on Monday, August 01st, 2016 to the students consist of X-1 as the experiment class and the writer gave pre-test on Wednesday, August 03rd, 2016 to the students consist of X-2 as the control class, writer gave writing test to the students’ in the form of essay test consist of five items.
5. The writer taught of the experimental class using cartoon story. (see appendix 2)
Table 3.3 Procedure in Teaching Writing (Meeting 1 till 4)
Teaching process using cartoon story (for experimental group) No. Step of writing Teacher’s activities
1. Pre writing activity - Prepare picture narrative text of cartoon story and material narrative text.
cartoon story.
- The writer explained what narrative text and also explained parts or generic structures.
- The students write the story based on the topic that has given by the teacher.
2. Whilst writing activity
- Gave the pictures narrative text of cartoon story to the students as the instructional media for writing stage.
- Asked the students to write their own narrative text based on the pictures of cartoon story.
- The students began to write a narrative text by pictures of cartoon story.
- Discussed the answer with the students. 3. Post writing activity - Collecting the students’ work.
- Asked the students to infer what they understand about the narrative text and cartoon story.
Table 3.4 Procedure in Teaching Writing (Meeting 1 till 4)
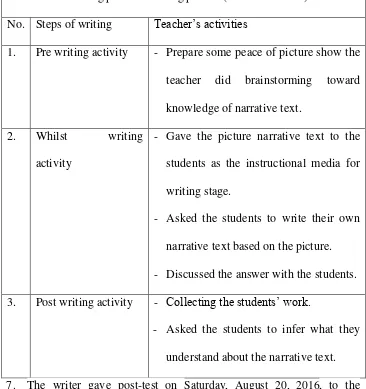
Teaching procedure using picture (for control class) No. Steps of writing Teacher’s activities
1. Pre writing activity - Prepare some peace of picture show the teacher did brainstorming toward knowledge of narrative text.
2. Whilst writing activity
- Gave the picture narrative text to the students as the instructional media for writing stage.
- Asked the students to write their own narrative text based on the picture. - Discussed the answer with the students. 3. Post writing activity - Collecting the students’ work.
- Asked the students to infer what they understand about the narrative text. 7. The writer gave post-test on Saturday, August 20, 2016, to the
students consist of X-1 as the experiment class and the writer gave post-test on Thursday, August 25th, 2016 X-2 as the control class writer gave writing test to the students’ in the form of Essay test
consist of 3 items.
8. The writer gave score to the data from experiment group and control group.
post test using t-test.
10. The writer interpreted the analysis result. 11. The writer concluded the activity.
Cartoon story as experimental study toward students’ writing score is the concept of this study. It is limited to the tenth Grade students at SMA Nusantara Palangka Raya in studying Narrative text.
To measure the standard score of the tenth-grade students at SMA Nusantara Palangka Raya in writing narrative, the writer used the Evaluation standard of English Subject which used by the English teacher at SMA Nusantara Palangka Raya. The minimal completeness Standard of English subject at SMA Nusantara Palangka Raya was 65. It meant that the students pass the test if they got 65 or more. But they got under 65, it meant they do not pass the test.95 We saw the standard in the following table;
Tabel 3.5 Evaluation Standard of English Subject
Interval Interpretation
65-100 0-64
Master Not master
1. Tabulating
The last to process the data is inserted into a certain table and arrange the numbering then calculated them.
95
E. Instrument of the Study
Instruments of the study are very needed in research. It was because the instruments were tools to get the data of the study, in which the data are the important things to help the writer in answering the problem of the study and also to prove the hypothesis. The data also needed to find the aim of the study.
Test
Tests were valuable measuring instruments for educational research. A test was a set of stimuli presented to an individual in order to elicit responses on the basis of which a numerical score can be assigned. This score, based on a representative sample of the individual’s behavior, was an indicator of the extent to which the subject the characteristic being measured.96
The test used to find out of the result of students’ achievement in learning writing and it was the main technique in collecting data. This study collected the main data from pre-test and post-test. From the two tests, this study found the effectiveness of using cartoon story towards students’ writing skill in the narrative text at the tenth grade of Nusantara Palangka Raya. A pre-test was given before any teaching. Pre-test was given because this study needs to compare the scores to the post-test scores which was given after the treatment. A post-test as the last test was given to get the quantitative data about their writing ability after the writer taught narrative text with cartoon story. This study used essay test in this study.
96
F. Instrument Validity
1. Content Validity
Sudijono in Maya syarah stated the content validity of a learning result test was the validity that was a gain after doing the analyze, investigation or examination of the content that was contained in the learning result test.97 Djiwandono in Maya Sarah stated content validity demand a content suitability between a skill being measured and a used test to measure.98 Dornyei state content validity concern expert judgment about test content.99 In this study content validity, the writer constructs the test based on what material in the syllabus.
2. Face validity
Face validity of test was when the test was indeed testing what it claims to test; the test samples the actual content of what the learner has achieved or expects to achieve.100 Therefore, the appearance of the test in the study as follows; the test items used English, consisted of narrative text discourse, and the test was suitable with the syllabus of English writing for the tenth-grade students of SMA Nusantara Palangka Raya.
For face validity of the test items as follow:
a) The test was written test in essay test instruction.
97Mayasyarah, The Effectiveness of Video Compact Disc as an Audiovisual Medium
toward The Students’ Listening Comprehension Score of The Tenth Grade Students at
MAN Model of Palangka Raya, Unpublished Thesis, p. 16.
98 Ibid
99Zoltan Dornyei, Research Method in Applied Linguistics Quantitative, Qualitative A Mixed Methodologies, p. 51.
100
b) The evaluation was based on the scoring system. c) Kind of the essay was writing narrative text. d) The Language used was English
e) The test was suitable with the syllabus of English writing for tenth-grade students at SMA Nusantara 1 Palangka Raya.
3. Construct Validity
Dornyei stated construct validity show how the test results conform to a theory of which the target construct was a part.101 Djiwandono in Mayasyarah states the construct validity was to show the finding score that reflects the same construct with the target skill of its measuring.102 The writer formulates the test item as a test of the writing test. The test used to measure the writing skill of the students at the tenth grade of SMA Nusantara Palangka Raya in Academic year 2016/2017.
In this study, the validation of instrument was mainly direct to the content validity. According to Sudijono in Mayasyarah, the validity of learning result test was the validity that was a gain after doing the analyze, investigation or exam of the content that was contained in the learning result test.103 Related to the writing test, the
content validity was check by exam and the test use to measure the
101
Zoltan Domyei, Research Method in Applied Linguistics Quantitative, Qualitative A Mixed Methodologies, p. 51.
102
Mayasyarah, The Effectiveness of Video Compact Disc as an Audiovisual Medium
toward The Students ’ Listening Comprehension Score of The Tenth Grade Students at MAN Model of Palangka Raya, Unpublished Thesis, p. 17.
103
Mayasyarah, The Effectiveness of Video Compact Disc as an Audiovisual Medium
objective. The writer was used inter-rater method (test of validity). Inter-rater was two rater who scores the students’ writing to get the score compositions as possible.The writer used product moment correlation as the formula to calculate the validity from the test result.104
𝒓xy = √* ( )( )
( ) + * ( ) +
Where:
𝒓xy : Index Correlation Number “ r” product moment.
N : Number of Case.
𝚺XY : Multiplication Result between Score X and Score Y.
𝚺Y : Total Value of Score X.
𝚺Y : Total Value of Score Y. Interpretation:
rXy > rt= Valid rxy< rt = Invalid
According to Riduwan in Maya syarah, he states the criteria of interpretation the validity:105
0.800 - 1.000 = Very High Validity 0.600 - 0.799 = High Validity 0.400 - 0.599 = Fair Validity
104
Anas Sudijono, Pengantar Statistik Pendidikan, Jakarta: PT. RajaGrafindo Persada,1997,p. 193.
105
0.200 - 0.399 = Poor Validity 0.201 - 0.199 = Very Poor Validity
G. Reliability
Reliability indicated how consistent a test measure whatever it does measure.106 The reliability of a measuring instrument was the degree of consistency with which it measures whatever it was measure.107 Reliability
was a concern with the effect of such random error of measure on the consistency of the score. But some error involved in measures were predictable or systematic.108
Reliability procedures were a concern with determining the degree of inconsistency in score caused by random error.109 A reliable test was
consistent and dependable.110 Scores reliability was the consistency of scoring by two or more scores.111
A simple way to determine the reliability of rating was to have two or more observer independent rate the same behavior and then correlate the observers’ ratings. The result correlation called the interrater.112 It indicated accuracy in the scoring composition of a rater incorrect the students’ test score twice.
In this study, the writer used inter-rater to correct the student’s score. The
106
Donald Ary, Lucy Cheser Jacobs & Asghar Razavich, introduction to research in education, Eight Edition, 2010, p. 224.
107
Ibid, p. 236. 108
Ibid, p.238. 109
Ibid, p.239. 110
H. Douglas Brown, Teaching by Principles an Interactive Approach to Language Pedagogy, Second Edition, p. 386.
111
Ibid, p. 387. 112
rater was the self writer, Dra. Femie Karolina Borang and Tatar Rimalati, S.Pd as a teacher of English in SMA Nusantara Palangka Raya. The writer used analytic scoring. In analytic scoring, scripts were rated on several aspects of writing or criteria rather than gave a single score. Depending on the purpose of the assessment, scripts might be the rate on such feature as content, organization, cohesion, register, vocabulary, grammar, or mechanic.113
H. Data Analysis Procedures
In analyzing data, the writer did the following procedures : 1. Collecting the students’ score of pre-test and post-test
2. Arranging the obtained score into the distribution of frequency of score table.
3. Calculating mean, median, standard deviation and standard error of variable X1 from the experiment group.
4. Calculating the mean, standard deviation, and standard error of variable X2 from the control group.
5. The calculating the standard error from the difference mean between variable X1 and X2.
6. The writer used manual calculation t-test and SPSS 16 to answer the problem of the study with formula:
113
a. It calculated the standard error of the difference between X-1 and X-2 as follow:114
SEM1- SEM2 = √( ) ( )
b. Then, it inserted to the formula to get value of tobserved as follow:115
To =
Which the criteria:
If observed (the value) ≥table, it means Ha was accepted and Ho was
rejected.
If tobserved (the value) ≤ ttable, it means Ha was rejected and Ho was accepted
where:
: Differentiation of Two Means.
SEm1- m2 : The Standard Error of the Difference between Two Means. With the criteria:
SEm1- m2 : If ttest> ttable : Ha is accepted and Ho is rejected. If ttest< ttable : Ha is rejected and Ho is accepted.
7. Interprets the result of ttest. Previously, it accounted the degrees of freedom (df) with the formula:116
Df = ( N1 + N2- 2 )
114
Triwid syafarotun Najah, p.97 115
Ibid, 116
Where:
Df: Degrees of freedom
N1: Number of subject group 1 N2: Number of subject group 2 2: Number of variables
After that, the value of ttest consulted on the ttable at the level of significance 1% and 5%. In this study, the writer used the level of significance at 5%. If the result or ttest was higher than ttable, it meant Ha was accepted. But if the result of ttest was lower than ttable, it means Ho was accepted
8. After calculated the data by using manual, then calculated the result ttest to test the hypothesis of the study by using SPSS 16 program.