Kertas 1
September 2013 1 ¼ Jam
Kertas ini mengandungi 22 halaman bercetak
BAHAGIAN PENGURUSAN SEKOLAH BERASRAMA PENUH DAN SEKOLAH KECEMERLANGAN
KEMENTERIAN PENDIDIKAN MALAYSIA PENTAKSIRAN DIAGNOSTIK AKADEMIK SBP 2013
PERCUBAAN SIJIL PELAJARAN MALAYSIA
MATEMATIK Kertas 1 1 Jam 15 Minit
JANGAN BUKA KERTAS SOALAN INI SEHINGGA DIBERITAHU
Arahan:
1. Kertas soalan ini mengandungi 40 soalan.
2. Jawab semua soalan.
MATHEMATICAL FORMULAE
The following formulae may be helpful in answering the questions. The symbols given are the ones commonly used.
RELATIONS
12 Pythagoras Theorem c2 = a2 + b2
distance travelled time taken sum of data
number of data
sum of (class mark × frequency) sum of frequencies
SHAPES AND SPACE
1 Area of trapezium =
2 1
× sum of parallel sides × height
2 Circumference of circle = d = 2r 3 Area of circle = r2
4 Curved surface area of cylinder = 2rh 5 Surface area of sphere = 4r2
1 Express 5.741104 as a single number.
Ungkapkan5.741104sebagai nombor tunggal. A 0.05741
B 0.005741 C 0.0005741 D 0.00005741
2 Round of 85 462 correct to three significant figures. Bundarkan 85 462 betul kepada tiga angka bererti.
7 In Diagram 1, PQRST is a regular pentagon. UTR is a straight line. Dalam Rajah 1, PQRST ialah pentagon sekata. UTR ialah garis lurus.
Diagram 1 Rajah 1 The value of x + y =
Nilai x + y =
A 36
B 73
C 109
D 146
8 In Diagram 2, UTV is a tangent to the circle PQST at T . PQR and RST are straight lines.
Dalam Rajah 2, UTV ialah tangen kepada bulatan PQST di T. PQR dan RST adalah garis lurus.
Calculate the value of x. Hitungkan nilai x. A 11.5
B 23
C 26
D 29
P
Q R
S
T
U V
xº 33º
62º
Diagram 2 Rajah 2
P
Q R
T S
U
35 y
9 Diagram 3 shows two pentagons, R and S, drawn on square grids.
Rajah 3 menunjukkan dua pentagon R dan S, dilukis pada grid segiempat sama.
Diagram 3 Rajah 3
S is the image of R under an enlargement.
Which of the point A, B, C or D is the centre of the enlargement? S adalah imej bagi R di bawah suatu pembesaran.
Yang manakah di antara titik A, B, C atau D ialah pusat pembesaran?
A
B
C D
10 Diagram 4 is drawn on a Cartesian plane. Rajah 4 dilukis pada suatu satah Cartesan.
Diagram 4 Rajah 4
Given
R = clockwise rotation of 90° about the centre (3,2) S = reflection in the line x = 5.
Find the coordinates of the image of point K under the combined transformation SR. Diberi
R = putaran 90° ikut arah jam pada pusat (3, 2) S = pantulan pada garis x = 5
Cari koordinat ime titik K di bawah gabungan penjelmaan SR. A (3, 5)
B (3, 4) C (4, 3) D (4, 4)
11 Which of the following represents part of the graph y = - tan ? Antara berikut, yang manakah mewakili sebahagian graf y = - tan ? A B
C D 2
0 2
4
4 6
6 -2
K y
x
90°
y
0 90°
y
0
180°
y
0 180°
y
12 In Diagram 5, TQRS and RUV are straight lines. Q is the midpoint of TR . Given PR = 2RU = 10 cm and sin x° =
5 4
. Find the value of cos y°.
Dalam Rajah 1, TQRS dan RUV ialah garis lurus. Q adalah titik tengah bagi garis lurus TR. Diberi bahawa PR =2RU = 10 cm dan sin x° =
5 4
. Cari nilai kos y°.
A
13 12
B
13 10
C
13
5
D
13 5
Diagram 5 Rajah 5 T
y° Q
S
V R
P
13 In Diagram 6, O is the origin , OT and OR are straight lines on the Cartesian plane. The value of sin is
Dalam Rajah 6, O ialah asalan , OT dan OR adalah garis lurus pada suatu satah Cartesan. Nilai bagi sin adalah
A 17
8
B
17 8
C
15 8
D
15 8
O y
Diagram 6 Rajah 6
.
T(15, 8).
R(15, -8) x14 Diagram 7 shows a cuboid.
Rajah 7 menunjukkan sebuah kuboid.
Name the angle between the plane AHG and the plane BCHG Namakan sudut di antara satah AHG dan satah BCHG
A AGH
B GAB C AGB D AHC
15 Diagram 8 shows a box and a tower on a horizontal plane. The angle of depression of the box from the top of the tower is 48°.
Rajah 8 menunjukkan sebuah kotak dan sebuah menara di atas satah mengufuk. Sudut tunduk kotak tersebut dari atas menara adalah 48°.
If the height of the tower is 202 m, find the distance between the base of the tower and the box, in metre.
Jika tinggi menara itu adalah 202 m, cari jarak di antara tapak menara dengan kotak tersebut, dalam meter.
A 181.78 B 181.88 C 224.34 D 224.44
C Diagram 7
Rajah 7 B
F
A D
E
G H
Diagram 8 Rajah 8
202 m
Box
16 In Diagram 9, PQ and ST are two vertical poles on a horizontal plane. R is a point on PQ such that RQ = ST.
Dalam Rajah 9, PQ dan ST adalah dua batang tiang tegak pada satah mengufuk. R adalah satu titik pada tiang PQ dengan keadaan RQ = ST.
The angle of elevation of P from S is Sudut dongakan P dari S ialah A SPR
B SRP C PSR D RSQ
17 In Diagram 10, KRS is a tangent to the circle RQP with centre O, at R. QPS is a straight line.
Dalam Rajah 10, KRS adalah tangen kepada bulatan RQP berpusat O, di R. QPS ialah garis lurus.
Find the value of x. Cari nilai x.
A 7 B 17 C 45 D 52
Diagram 9 Rajah 9
K R S
O Q
P
38° x°
Diagram 10 Rajah 10
Q T
.
R P18 Given the speed of a car is (3x - 4) ms-1. Find the distance of the car that travels in (2 + x) seconds.
Diberi laju sebuah kereta ialah (3x – 4) ms-1. Carikan jarak perjalanan kereta itu dalam masa ( 2 + x )saat.
as a single fraction in its simplest form.
Ungkapkan
sebagai satu pecahan tunggal dalam bentuk termudah.
20 In Diagram 11, A and B are two points on a common parallel of latitude y°S. Dalam Rajah 11, A dan B adalah dua titik yang berada pada selarian latitud y°S.
Diagram 11 Rajah 11
If an aeroplane flew at 200 knots from A to B for 1.2 hours, the value of y is
Jika sebuah kapal terbang terbang dari A ke B dengan kelajuan 22 knot selama 1.2 jam, nilai y ialah
Diberi bahawa
22 Given ,
hitungkan nilai x. A -4
B -3
C 3
D 4
23 Simplify : Permudahkan :
25 Solve the simultaneous linear inequalities 4x8 and 3x47. Selesaikan ketaksamaan linear serentak 4x8 dan 3x47. A 4x1
B 1x4 C 5x2 D 4x1
26 Diagram 12 is a pictograph showing the number of sales of three types of books in one week. Number of English books sold are not shown.
Rajah 12 ialah piktograf yang menunjukkan jualan tiga jenis buku dalam satu minggu. Bilangan buku Bahasa Inggeris yang telah dijual tidak ditunjukkan.
Science Sains
Mathematics Matematik
English Bahasa Inggeris .
Represents 12 books Mewakili 12 buah buku
Diagram 12 Rajah 12
If the sales of Mathematics books were 20% of total sales in the week, calculate the number of English books sold.
Jika jualan buku Matematik ialah 20% daripada jumlah jualan minggu tersebut, hitung bilangan buku Bahasa Inggeris yang telah dijual.
A 11
B 20
C 108
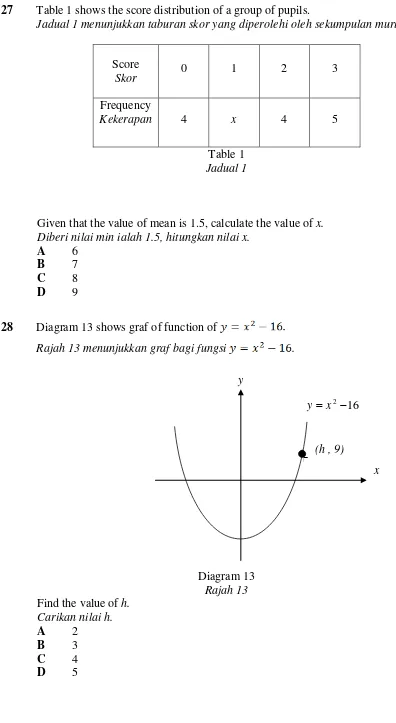
27 Table 1 shows the score distribution of a group of pupils.
Jadual 1 menunjukkan taburan skor yang diperolehi oleh sekumpulan murid.
Score
Skor 0 1 2 3
Frequency
Kekerapan 4 x 4 5
Table 1 Jadual 1
Given that the value of mean is 1.5, calculate the value of x. Diberi nilai min ialah 1.5, hitungkan nilai x.
A 6
B 7
C 8
D 9
28 Diagram 13 shows graf of function of
Rajah 13 menunjukkan graf bagi fungsi .
Diagram 13 Rajah 13 Find the value of h.
Carikan nilai h.
A 2
B 3
C 4
D 5
y
x
x
16
2
x y
29 Diagram 14 is a Venn Diagram showing universal set ξ, set P dan set Q.
Rajah 14 ialah gambar rajah Venn yang menunjukkan set semesta ξ, set P dan set Q.
Diagram 14 Rajah 14 Kawasan yang manakah menunjukkan set Q’.
Which region represent the set Q’.
A I
B II
C I and II I dan II D I, II and III
I, II dan III
30 Diberi bahawa set H = { 1, 3 }, set J = { 1, 2, 3, 4, 5} , set R = { 0, 1, 3, 5, 6, 7, 8, 9}
dan set ξ = HJR, cari n(H J’).
Given that set H = { 1, 3 }, set J = { 1, 2, 3, 4, 5} , set R = { 0, 1, 3, 5, 6, 7, 8, 9}
and set ξ = HJR, find n(H J’).
A 4
B 5
C 6
D 7
31 List all the subsets of set {m, n}.
Senaraikan semua subset bagi set {m, n}. A {m}, {n}
B ∅, {m}, {n} C {∅}, {m}, {n} D ∅, {m}, {n}, {m, n}
IV Q
ξ P
32 Find the y-intercept of the straight line −14y = −11x + 20. Cari pintasan-y untuk garis lurus −14y = −11x + 20.
A −10 7 B −11
14 C
−1411
D 10
7
33 Diagram 15 shows two straight lines PQ and QR on a Cartesian plane. Rajah 15 menunjukkan dua garis lurus PQ dan QR pada satah Cartesan.
Diagram 15 Rajah 15
The length of PQ is 10 units and the gradient of QR is −3
4 . Find x-intercept of PQ.
Panjang PQ ialah 10 units dan kecerunan QR ialah − 34 . Cari pintasan-x bagi PQ.
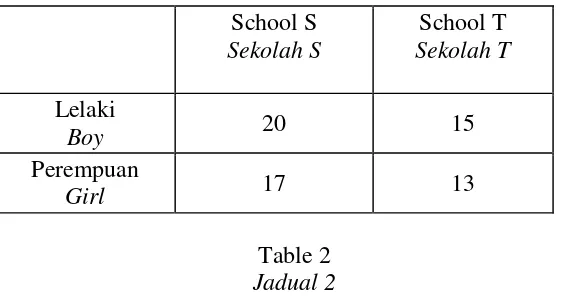
34 Table 2 shows the number of students participating in an Anti-drug Campaign from two schools, S and T.
Jadual 2 menunjukkan bilangan pelajar yang menyertai suatu Kempen Anti Dadah dari dua buah sekolah, S dan T.
School S Sekolah S
School T Sekolah T
Lelaki
Boy 20 15
Perempuan
Girl 17 13
Table 2 Jadual 2
A student is chosen at random from the students who participated in the Anti-drug Campaign. Find the probability that a boy from School T will be chosen.
Seorang pelajar dipilih secara rawak daripada pelajar-pelajar yang menyertai Kempen Anti Dadah. Cari kebarangkalian seorang pelajar lelaki dari Sekolah T akan dipilih.
A 1
5
B 13
28
C 15
28
D 3
13
35 A box contains 7 white balls and 10 black balls. Yahya put another 1 white ball and 3 black balls into the box. A ball is chosen at random from the box. What is the
probability that a white ball is chosen?
Sebuah kotak mengandungi 7 biji bola putih dan 10 biji bola hitam. Yahya
A 7 17
B 7
8
C 8
13
D 8
21
36
It is given that h ∝ 1
q2 and h = 2 when q = 3. Calculate the value of h when q = 9.
Diberi bahawa h ∝ 1
q2 dan h = 2 apabila q = 3. Hitung nilai h apabila q = 9.
A 1
9
B 2
9
C 9
2
D 1
81
37
It is given that Y varies directly as X2 and Y = 4 when X = 1. If Z = 5
X, calculate the value of YZ when X = 2.
Diberi bahawa Y berubah secara langsung dengan X2 dan Y = 4 apabila X = 1. Jika
Z = 5
X, hitung nilai YZ apabila X = 2.
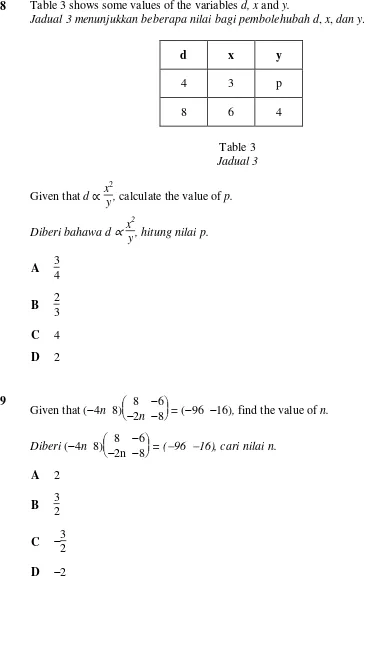
38 Table 3 shows some values of the variables d, x and y.
Jadual 3 menunjukkan beberapa nilai bagi pembolehubah d, x, dan y.
d x y
4 3 p
8 6 4
Table 3 Jadual 3
Given that d ∝x
2
y, calculate the value of p.
Diberi bahawa d ∝x
2
y, hitung nilai p.
A 3 4 B 2
3 C 4 D 2
39
Given that (4n 8)8 2n
6
8 = (96 16), find the value of n. Diberi (4n 8)8
2n
6
8 = (96 16), cari nilai n. A 2
B 3 2 C −3
2
40
8
2
3 3
6
10
3
3 5
=
A 63 35 B 24
35 C 24
35 D
63
35