Passenger Satisfaction on The Services Provided
by Halim Perdana Kusuma Airport Jakarta in 2014
Andri STMT Trisakti ndryse@gmail.
com
Suparwan Cecep Kosasih STMT Trisakti [email protected]
Haryono STMT Trisakti [email protected]
ABSTRACT
Halim Perdana Kusuma International Airport, which is integrated with the development of National Economic Zones, is included in the implementation of Master Plan for the Acceleration and Expansion of Indonesian Economic Development in Java and Sumatra islands. The operation of Halim Perdana Kusuma Airport is expected to become a locomotive for the economy of its surrounding regions. Therefore, its presence will encourage the emergence of centers of growth and new economic activities. The operation of Halim Perdana Kusuma airport signiies the seriousness of the Indonesian government in preparing the accelerated development of national connectivity and supporting infrastructures in order to support the trade connectivity and the projected national and regional aviation hub. Service is an act, performance appearance, intangible and it quickly disappears, which can only be consumed but can not be held, where customers can participate more actively in the process of consuming it. In this case, customer assessment on the performance ofservice providers will greatly inluence the passenger satisfaction, in which passengers who have a level of importance or high expectations here to get performance comparable airports of giving the passenger satisfaction. Passenger satisfaction will have a positive impact on the airport, while the airport sales volume will likely increase if the passengers’ past experience as well as its word of mouth are positive.
Introduction
Transportation is a sector in the societal life that acts as a vein for the low of people and goods, which in its development is inluenced by the level of economic development especially the growth of trade and industry. One of the needs for transportation necessary to be studied and that calls for serious attention in the recent time is air transport, especially which is related to the quality of airport services.
The aim of this research is to know and analyze the inluence of service quality comprising responsiveness, guarantee, physical evidence, empathy, and reliability on the consumer satisfaction at Halim Perdana Kusuma airport and to know and analyze the dimension of dominant service quality inluencing the satisfaction.The transfer of some domestic lights from
Soekarno-Hatta airport to Halim Perdana Kusuma airport is the short-term plan made by the government in order to disentangle the air trafic density faced by Soekarno-Hatta airport. The density getting higher at Soekarno-Hatta airport today often causes
some delays in the light schedule. As a
part of long-term plan, the government will enlarge Halim Perdana Kusuma airport to accommodate the need of people in Jabodetabek area. The light frequency at Halim Perdana Kusuma airport is targeted
to be 126 lights a day so that it can reduce the light density at Soekarno-Hatta airport
by around 10 to 11 percents. Meanwhile, for the middle-term plan, (the government) waits for the completion of Terminal 3 at Soekarno-Hatta airport. In addition, the navigation for controlling landing and take off is still being reset.
Method of Data Collection
This research uses primary and secondary data to obtain the conclusion about its results.
a. Primary Data, obtained through Field Research approach.
Field reseach is done to obtain the primaty data directly from the object being studied, that is through:
1) Interview with the oficial having authority to share the data needed for this reseach.
2) Observation, that is visiting and directly seeing the activities at the airport.
3) Questionnaire, some questions are arranged in such a way to know the level of passenger satisfaction with the airport services provided by Halim Perdana Kusuma Jakarta airport. This questionnaire is addressed and distributed to the respondents with the interval time is before and after the light departure. In order to obtain more accurate answers from the respondents, this is done in the following ways: i. The respondents ill in the
questionnaire by themselves after being given explanation on the way to ill in the questionnaire and given opportunity to ask some questions. ii. The researcher reads the questions
in the questionnaire for the respondents with dificulties in reading the questionnaire.
iii. The researcher reminds the respondents to ill in the questionnaire completely and honestly.
b. Secondary Data, obtained through
bibliographical research.
Bibliographical researchis a way of gathering information related to airport services contained in books.
Service companies make various efforts to provide maximum customer satisfaction. An airport as a part of service industry surely has its own missions like other service companies at which an airport provides services as its main product. In addition, it must also pay attention to its customer satisfaction.
Wilson, L and Goldscimidt deine customer satisfaction as:
“Subjective judgment or opinion about the quality of service, especially related to the international aspects of service and customer experience after experiencing a number of airport service
intervension.”
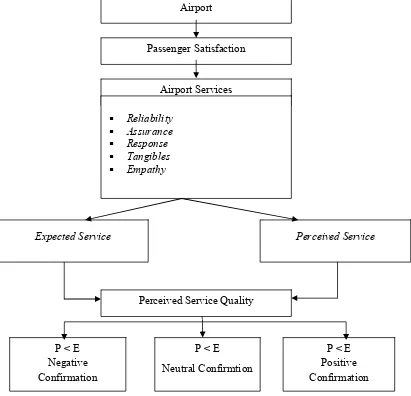
Passenger satisfaction is a methode for studying the impact and quality of service that can become an evaluation on the service results measured by using passenger satisfaction. The measurement is important for companies to know which attributes of a product can satisfy the passengers. Knowledge about customer perception will help companies make better decisions, particularly in delivering better services to the customers so that they feel satisied and give their high loyalty to the companis in turn. Theoretically, the concept of analysis on the customer or passenger
Source: Modified from “A Conceptual Model Of Service Quality” Parasuraman (1985 in Fitsimmons, 1994:1990)
Airport
Passenger Satisfaction
Airport Services
Reliability Assurance Response Tangibles Empathy
Expected Service Perceived Service
Perceived Service Quality
P < E Negative Confirmation
P < E Positive Confirmation P < E
Neutral Confirmtion
satisfaction at an airport can be seen in the igure below.
Airport Service Quality
The improvement of customer satisfaction can be achieved through the improvement of service quality. Assauri states that:
“Service quality is something the customers always desire, because it is the greatest beneit from the service they will obtain.”
In the airport services, the effort to improve the consumer (in this case, passenger) satisfaction is that the company should be able to build high quality services by providing good services. What is meant with service according to Saiffudinis:
“Any effort made individually or in cooperation in an organization to maintain and improve the service, prevent and deliver services as well as to regain trust from individual, family, group and/or community.”
One of the requirements for good service is quality service. It is because if quality service can be delivered it will meet the increasing need and demand of people (needs and demands for health).
In general, the more perfect the service performance the more perfect its quality. In the quality assurance program, the airport service performance is called an output.
According to Azwar, the other factors that can inluence the quality of airport service are:
1). Input
Included in input are energy, fund, and facilites. In general, if the energy and facilities do not match the predetermined standard (standard of personnel and facilities), and if the available fund does
not match the need, it is dificult to hope for a good service quality.
Donabebian in Wijono, states that structureincludes physical facilities like equipment and tools, human resosurces and other resources.Furthermore, Donabedian explains that: assessment on the available equipment and instruments and used as the tools for service delivery.
2). Environment.
What is meant with environment here are policy, organization, and management. In general, if the policy, organization, and management are not in accordance with the standard and/or not supportive, it is dificult to hope for a good service quality at an airport.
3). Process
Process is the all activities carried out professionally by the airport oficers and their interaction with the passengers. Wijono states this process also includes service plan, indication of act, proceduresand case handling. The goodness of process can be measured by:
• The process is relevant for the passengers or not.
• The quality of process itself is in accordance with the appropriate service standard.
This process approach is the most direct approach to service quality. Thus, it is clear that service quality inluences the customer satisfaction very much.
Variables and Variable Measurement
Variables
The questions listed in the questionnaire are classiied into ive variables. Those ive variables are:
toward the variable of reliability. It is the degree of the airport’s ability to deliver the promised services well. Here, the assessment includes the assessment on the procedures for passenger arrival and passenger departure.
2) The level of passenger satisfaction toward the variable of responsiveness. It is the degree of the airport’s ability to give responses to demand of passenger service. Here, the assessment includes the ability of employees to solve the passenger’s complaint.
3) The level of customer satisfaction toward the variable of assurance. It is the degree of expertise and knowledge needed for delivering the service in a polite way and with honor by which the passengers feel secure with the services provided by the airport. Here, the assessment includes the passenger’s belief in the employees’ knowledge and ability as well as the assurance for smoothness and comfort in the provided services.
4) The level of customer satisfaction toward the variable of tangibles. It is the degree of the appearance of physical facilities, waiting room, boarding lounge, smoking area, toilet, counter area (ticket queue) at the airport. Here, the assessment includes the completeness, cleanliness, availability, oficer’s tidiness, and the service received as expected.
5) The level of customer satisfaction toward the factor of empathy. It is the degree of the seriousness of the airport in delivering its services to the passengers. Here, the assessment includes the attention paid by the airport to every passenger and prospective passengers.
Variable Measurement
Those ive variables are described in two parts, namely expectation and
passenger’s experience. The part of experience is the experience received by the respondents when they start to enter the airport terminal until they leave the airport terminal.
Data Processing
The data that has been gathered is subsequently processed through some stages:
1) Editing :
Scrutinizing every questionnaire returned (to the researcher) in order to make sure the necessary data has been illed in completely, clearly, and correctly.
2) Coding :
Giving code to every data obtained from every question in the questionnaire to make the data processing easier.
3) Spring :
To assess the result of the questionnaire, the predetermined scoring is made for every respondent.
Data Analysis
Data analysis is carried out to every variable in order obtain a description of the level of passenger satisfaction toward the airport services. Here, the formula of Importance-Performance Analysis
(Rangkuti, F. 2003) is used.
Where:
Tki = Level of respondent suitability
Xi = Assessment score for the company’s performance
Yi = Assessment score for the customer’s interest
score of customer’s interest, the following formula is used:
Where: X= Average score of the level of execution/satisfaction
Y= Average score of the level of interest n = the number of respondents
Finally, the data processing results in a Cartesian Diagram, which consists of four parts and used to analyze the company’s performance and the level of customer’s interest.
No Variables inluencing Airport Services Performance X
Expectation
Y
X
YLevel of Suitability (%)
A. Reability
1. How smooth do the procedures to enter this airport? 203 224 4.06 4.48 90.63 2. How is the inspection to you done by Angkasa Pura II
as the airport management?
215 224 4.30 4.48 95.98
B. Assurance
3. How do you believe in the ability of Angkasa Pura II employees/oicers in serving you?
211 227 4.22 4.54 92.95
4. How are the skill and agility of Angkasa Pura II employees/oicers in serving you?
220 230 4.40 4.60 95.65
5. How does the situation of the airport environment inluence your comfort?
189 228 3.78 4.56 82.89
C. Responsiveness
6. How is the responsiveness of Angkasa Pura II employees/oicers in handling your complaint?
203 232 4.06 4.64 87.50
7 How does Angkasa Pura IIas the airport management respond your complaint?
201 229 4.02 4.58 87.77
D. Tangibles
8. How is the Comfort, Cleanlines and Tidiness of Passenger’s waiting room?
191 208 3.82 4.16 91.83
9. How is the Completeness, Readiness, and Cleanliness of the tools for use?
210 229 4.20 4.58 91.70
10. How is the Completeness, Readiness, and Availability of the needed facilities?
200 217 4.00 4.34 92.17
11. Do you think the PSC tarif Rp40.000 is suitable with the perceived service and quality?
201 218 4.02 4.36 92.20
12. How tidy and clean are the appearance of PT Angkasa Pura II employees/oicers as the airport management?
197 233 3.94 4.66 84.55
E. Empathy
13. How is the attention paid to you by Angkasa Pura II employees/oicers?
187 218 3.74 4.36 85.78
14. Is the igure of an Angkasa Pura II employee/ oicer in paying attention to you suitable with your expectation?
188 211 3.76 4.22 89.10
Total 56.36 62.56
Average (
X
andY)4.03 4.47
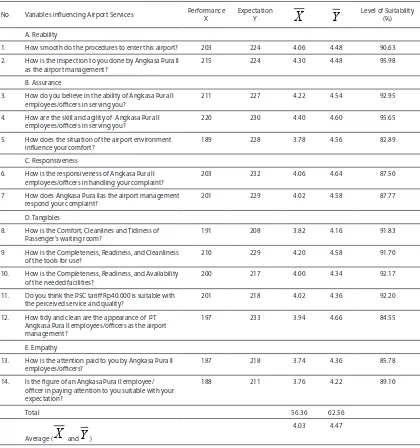
Table 1 The Average Score of Expected Performance and the Level of Passenger Satisfaction toward the Services Provided by Halim Perdana Kusuma International
Airport Jakarta
Discussion
From the general description of respondents obtained from the recapitulation (the number of sample is 30 passengers or prospective passengers randomly taken (simple random sampling), it can be known that based on the type of job the most respondents are entrepreneurs (34%), based on education the most respondents are university alumni (56%), based on income the most respondents have income more than Rp5.000.000 as many as 66 %, and the majority of respondents choose the airport because of location factor (62%). The data obtained from the questionnaire given to the respondents can be processed further to know which variables are considered by the passengers as important for Halim Perdana Kusuma airport services.
The level of suitability between the assessment score for the igure of expected oficers with their performance and the highest score is 89.10%. It means that the passengers are satisied enough with the igure of the airport oficers. Subsequently, the Average Score of Expected Performance and the Level of Passenger Satisfaction toward the Services Provided by Halim Perdana
Kusuma International Airport Jakarta can be seen in Table 1 above.
Seeing Table 1 above, the highest level of suitability is 95.98%. It is the factor of inspection done by the airport management to you. Whereas the lowest level of suitability is 82.89%, that is the factor of passenger’s comfort with the situation of airport environment.
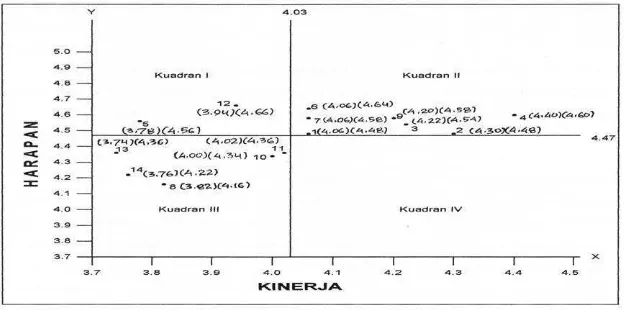
Cartesian Diagram
In order to assess the placement of the data that has been analyzed in a Cartesian diagram, the average score of expectation and the average score of performance are the objective limits as tabulated in Table1. From the result of variable measurement on the airport services, it can be known which variables are considered important by the passengers, as well as which variable scan provide high level of satisfaction to the passengers. Based on this information, the airport management can make some policies by considering which variable of service should be improved or prioritized. By processing the data in Table 1, the Cartesian diagram is as follows:
It is seen from the cartesian diagram that the location of variables inluencing the passenger satisfaction at that airport can be divided into four quadrants. The interpretation of that diagram can be explained as follows:
Quadrant 1 (First Priority)
This quadrant shows the variables with signiicant inluence on the passenger satisfaction, since the passengers give high expectation tothese variables where the level of passenger’s interest and expectation is beyond the average but the realization or performance is still low. These variables become the irst priority to be improved. The variables in this quadrant are:
- The situation of airport environment toward the comfort (=5)
- The tidiness and cleanliness of PT Angkasa Pura II employees/oficers’ appearance as the airport management (=12)
If seen from the model of service quality that identiies the gap causing a failure in the service delivery as stated by Parasuraman, then the passenger unsatisfaction in these variables are the gap between the received service and the expected service in which the passengers expect comfort with the environment and the tidiness and cleanliness of the oficers.
Quadrant II (Achievement Maintenance)
All the variables that inluence the passenger satisfaction in this quadrant need to be maintained (in term of achievement) where the passengers with high level of interest and expectation ind the airport performance equal to the expectation so that they contribute passenger satisfaction. The variables in this quadrant are:
- Smoothness of Procedures to Enter the Airport(=1)
- Inspection done by Angkasa Pura IIas the airport management (=2)
- Your belief in the ability of Angkasa Pura II employees/oficers in the servicedelivery (=3)
- The skill and agility of Angkasa Pura II employees/oficers in the servicedelivery (=4)
- The responsiveness of Angkasa Pura II employees/oficers in handling complaints (=6)
- The response of Angkasa Pura II as the airport management to any complaint (=7)
- The completeness, readiness, and cleanliness of the tools for use(=9)
Passenger satisfaction will give positive impact to the airport, where the sales volume will potentially increase if the passenger’s past experience and the word of mouth have a positive value.
Quadrant III (Low Priority)
This quadrant shows the variables that inluence the passenger satisfaction but considered not so important whereas the airport performance is low. The variables in this quadrant are:
- The Comfort, Cleanliness, and Tidiness of waiting room for passengers (=8) - The Completeness, Readiness, and
Availability of Necessary Facilities (=10)
- PSC tariff as much as Rp40.000 in accordance with the perceived service and quality (=11)
- The attention paid by Angkasa Pura II employees/oficers (=13)
Quadrant IV (Excessive/optimum)
No variable categorized in this quadrant.
Conclusion
1. Halim Perdana Kusuma airport as a state airport in Jakarta, in its operation tries to provide quality service facilities for the sake of the perfect satisfaction level for the passengers.
2. From the data collection, it inds the variables in the irst priority to be improved, such as the situation of airport environment toward the comfort for passengers, the tidiness and cleanliness of the employees/oficers’ appearance (Quadrant I).
3. The performance of Halim Perdana Kusuma airport has fulilled the passenger expectation. All variables in Quadrant II inluencing the passenger satisfaction need to be maintained, such as the smooth procedures for entering the airport, the inspection carried out by Angkasa Pura II as the airport management, the belief in the skill and agility of Angkasa Pura II employees/oficers in delivering services, the responsiveness of Angkasa Pura II employees/oficers in handling complaints, the response of Angkasa Pura II as the airport management to any complaint, and the completeness, readiness, and cleanliness of the tools for use.
Bibliography
Assauri, Sofjan. 2000. “Strategi Pemasaran Jasa”.Usahawan. Number 11 Year XXXX.
Bruce, J. 2009. Fundamental Elements of The Quality of Care; a Simple Framework: Studies in Family Planning. Vol.21, Number 5.
Fitzsimmons, James and Mona J, Fitzsimmons. 2004. Service Management for Competitive Advantage. New York: McGraw-Hill Company.
Gasperz, Vincent. 2007. Manajemen Kualitas dalam Industri Jasa. Jakarta. PT Gramedia Pustaka Utama.
Handoko, T.Hani, Sukamto and Siswanto. 2012. Kebijaksanaan Perusahaan. Yogyakarta: BPFE-UGM.
Rangkuti, F. 2003. Measuring Customer Satisfaction: Teknik Mengukur & Strategi Meningkatkan Kepuasan Pelanggan & Analisis Kasus PLN JP. Gramedia Pustaka Utama, Jakarta. Swastha, Basu and Ibnu Sukotjo W.
2001. Pengantar Bisnis Modern. Yogyakarta: Liberty, 5th edition. Supranto, J, M. A. 2007. Mengukur
Tingkat Kepuasan Pelanggan Untuk Menaikkan Pangsa Pasar. Jakarta:Rhineka Cipta, 3rd edition. Tjiptono, Fandy. 2000. Perspektif