ARTIFICIAL NEURAL NETWORK APPLICATIONS USE
MEASUREMENTS OF ELECTRICAL QUANTITIES TO
ESTIMATE ELECTRIC POWER
1Dikpride Despa, 1FX Arinto Setyawan, 2Gigih Forda Nama, 1Jofanda Delano 1Electrical Engineering Departement,Faculty of Engineering, University of Lampung 2Infomatic Engineering Departement,Faculty of Engineering, University of Lampung
1[email protected] 2 [email protected]
Abstract - Prototype measurement of electrical quantities had been built and applied to the H building in faculty of engineering,University of Lampung. Electrical quantities Measurement of electrical quantities had been saved on TIK’s server. However, it had not been used for estimation. Electric power is the electricity that tends to change following the electric load. So, electric power can be predictable or estimation based on measurement data in the past. The method of backpropogation artificial neural networks is a method that have a good approach to nonlinearity. The results of testing the estimation of electric power consumption had been done in the distribution panel of Electrical Engineering and Mechanical Engineering UNILA indicated that this method can be used to estimate electric power consumption for one month ahead with an accuracy of 0,884%. Thus this research can be applied to real-time estimation processes that can be accessed and displayed by web in real-time.
Keyword : Prototype measurement, estimation , H building in faculty of engineering University of Lampung, artificial neural networks, backpropogation
INTRODUCTION
On the existing problems, the quantities of electricity in the H building of UNILA had been measured by the smart monitoring prototype. Actually, the result of measurements can be used as an aspect of operation planning of a good and appropriate the electric power system, is prediction or estimation.
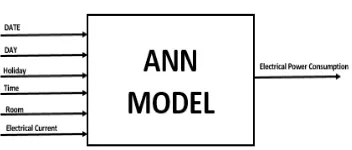
One method for estimating or predicting nonlinearity is using ANN (Artificial Neural Networks). Variables used in this ANN method are electrical system data (electrical power of each phase), date data, day data, holiday data, and room data in the past where these data are factors that influence electricity consumption.
The purpose of this research is to prove that the backpropogation neural network method can be used to predictions or estimates from the data of electrical quantities (electric power of each phase) that was measured by the smart monitoring prototype in the H Building of the Faculty of Engineering UNILA one month ahead.
LITERATURE
Characteristics of Electrical Systems In H Building Of The Faculty of Engineering, University of Lampung
Characteristic curve of the electric quantity is the result of measurement smart monitoring prototype in H Building of the Faculty of Engineering, University of Lampung that the power system in the Faculty of Engineering UNILA is a three-phase system [1],[6],[7].
Estimation
Estimates or predictions are allegations about things or events that will occur in the future. The estimation of the electric al system is very important to know because with this estimation the development planning process in terms of the operation of electric power in accordance with the needs in the future can be planned properly [2].
Electric Load Forecasting [2]
Long Term Prediction
Long-term predictions is forecasts for periods over one year. In this prediction of external factors such as problems of economic growth are the main factors in determining the direction of forecast or prediction.
Medium Term Prediction
Medium-term predictions is predictions for a period of one month to one year. In this medium-term electric energy parking lot, internal factors of electricity companies such as managerial problems of the company become the main factor in predictions or predictions.
Short Term Prediction
Short-term predictions is predictions for a period of several hours to one week (168 hours). The amount of electrical energy for each hour is determined by observing the trend of electrical energy in the past by paying attention to information that can affect the amount of the system load.
ANN (Artificial Neural Network) [3],[5]
ANN is a computational system with architecture and operations inspired by knowledge of biological nerve cells in the brain. This makes ANN very suitable to solve problems with the same type as the human brain. Artificial neural network system is determined in the following 3 things:
The patterns of relationships between neurons are called network architectures.
The method of determining the connecting weight is called the training / learning method / algorithm. Activation function used.
Basic Concepts of Artificial Neural Network Modeling
The neuron imitation in the structure of artificial neural networks is as a processing element like picture 3 that can function like a neuron. A number of input signals a multiplied by each weigher. Then the sum of all the multiplication results and the resulting output is carried out into the activator function to get the level of the output signal F (a, w). Although still far from perfect, the performance of these neuron imitations is identical to the performance of the biological cells we know [3],[5].
Figure 3. Neuron Artificial Model
Artificial Neural Network Architecture [4],[5]
Single Screen Network (Single Layer Network)
In this network, all input units in this network are connected to all output units, although with different weights.
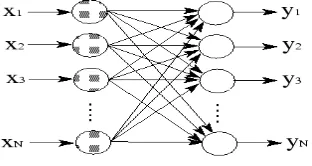
Multiple Screen Networks (Multi Layer Network)
This network is an extension of a single screen network. This network introduces one or two more hidden layers that have nodes called hidden neurons.
Figure 5. Multi Layer Network
RESEARCH METHODS
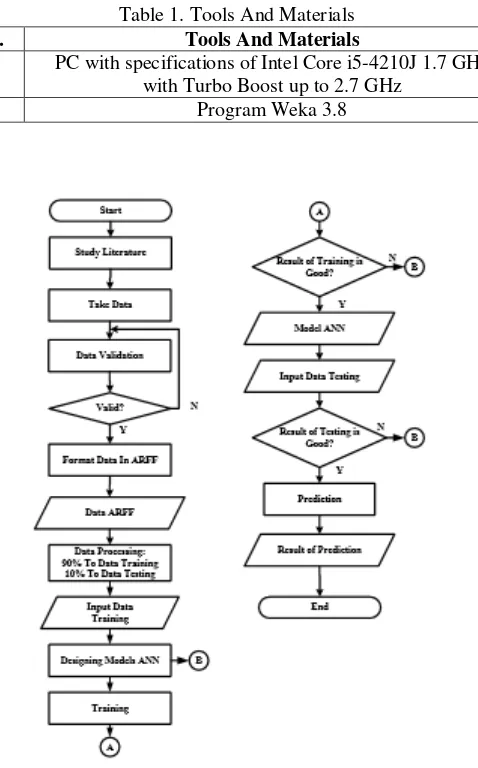
The research was conducted at Laboratory of the Department of Electrical Engineering, University of Lampung. The stages of the research are as follows:
Tools And Materials
Table 1. Tools And Materials
No. Tools And Materials
1 PC with specifications of Intel Core i5-4210J 1.7 GHz with Turbo Boost up to 2.7 GHz
2 Program Weka 3.8
Research Diagram
Figure 6. Research Diagram
Level of Accuracy ANN [5]
Relative Absolute Error:
× 100% (1)
Root Relative Square Error:
(2)
Information
= Error Prediction
= Actual Data
= Prediction Data
= Average Actual Data
RESULTS
Artificial Neural Network Model Architecture
The process to estimate or predict electric power consumption in Building H requires relatively large data, multilayer net with backpropogation algorithm and supervised learning method is the architecture of the artificial neural network model chosen to build and design this estimation or prediction system. In designing this system, the network or ANN model is given a pair of data consisting of input data and desired data (target).
Determination of Input and Output
Figure 7. Determination of Input and Output
Format Data
In the dataset used to train, test, and predict the data format is changed to the format attribute-relation file format (arff). Attribute-relation file format is the file format used in WEKA.
Results Analysis
The data used for the electric power training process for each phase are day data, date data, clock data, holiday data, room data, electric current data, and electrical power in the past from November 1, 2017 - May 13 2018.
In designing the ANN model, the trial and error process is carried out in determining the learning rate, momentum, and the number of neurons in each hidden layer or hidden layer to achieve the desired output convergence.
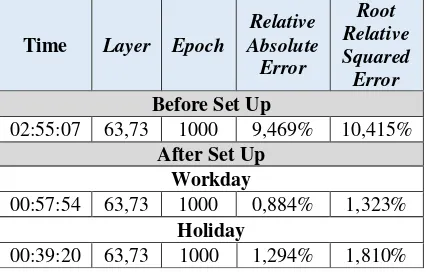
Table 3 - table 14 is a trial and error process to get the number of layers that have a good level of accuracy in JTE and JTM. But the results of the trial and error still have a small degree of accuracy so that the process of rearrangement is the sharing of data between holidays and work, the addition of input attributes (electric current), and the decay settings on the network so that the accuracy level is very good.
Training JTE
Table 3. Comparison of the Number of Layers of Phase R Electric Power Training Electrical Engineering University of Lampung
Time Layer Epoch Relative
Absolute Error
Table 4. Training of Electrical Power Phase R On Electrical Engineering University of Lampung
Table 6. Training of Electrical Power Phase S On Electrical Engineering University of Lampung
Table 7 . Comparison of the Number of Layers of Phase T Electric Power Training Electrical Engineering University of Lampung
Time Layer Epoch Relative
Absolute Error
Table 8. Training of Electrical Power Phase T On Electrical Engineering University of Lampung
Time Layer Epoch
Table 9 . Comparison of the Number of Layers of Phase R Electric Power Training Mechanical Engineering University of Lampung
Table 10. Training of Electrical Power Phase R On Mechanical Engineering University of Lampung
Workday
01:37:18 83,93 1000 0,721% 0,824%
Holiday
01:07:18 83,93 1000 1,972% 2,692%
Table 11 . Comparison of the Number of Layers of Phase S Electric Power Training Mechanical Engineering University of Lampung
Time Layer Epoch Relative Absolute
Error
Table 12. Training of Electrical Power Phase S On Mechanical Engineering University of Lampung
Time Layer Epoch
Table 13. Comparison of the Number of Layers of Phase T Electric Power Training Mechanical Engineering University of Lampung
Time Layer Epoch Relative Absolute
Error
Table 14. Training of Electrical Power Phase T On Mechanical Engineering University of Lampung
JTE JTM
Work Day Holiday Work Day Holiday
Figure 8. JTE & JTM Training Chart
In figure 8, the electric power training for each phase in JTE and JTM is known that the accuracy of the ANN model that is built reaches ± 1%. This training is intended to get information and learn from the sprinkling of data properly. The previous problem is that the data is not divided between working days and holidays where the input attributes possessed are very minimal so that it will slow down the convergence / convergence process. Overtraining problems (excessive training data) will also cause the network to memorize the data entered rather than generalize.
TESTING ANN
Table 16 – table 21 is the electrical power test in JTE dan JTM. Electrical power test is carried out to evaluate the network architecture of the results of the training is already good or not for the prediction process in the coming month. Testing is done by using new data outside the training data. This test uses day data, date data, clock data, holiday data, room data, electric current data, and electrical power in the past 14 May 2018 - 31 May 2018.
JTE
Table 16. Testing of Electrical Power Phase R On Electrical Engineering University of Lampung
Layer Relative Absolute Error Root Relative Squared Error
Workday 63,73 0,883% 0,952%
Holiday 63,73 4,174% 4,470%
Table 17. Testing of Electrical Power Phase S On Electrical Engineering University of Lampung Layer Relative Absolute Error Root Relative Squared Error
Workday 33,43,30 2,217% 2,197%
Holiday 33,43,30 7,992% 6,875%
Table 18. Testing of Electrical Power Phase T On Electrical Engineering University of Lampung
Layer Relative Absolute Error Root Relative Squared Error
Workday 63,73 2,035% 2,049%
Holiday 63,73 4,541% 4,199%
JTM
Table 19. Testing of Electrical Power Phase R On Mechanical Engineering University of Lampung
Layer Relative Absolute Error Root Relative Squared Error
Workday 83,93 0,913% 1,738%
Holiday 83,93 2,658% 2,613%
Layer Relative Absolute Error Root Relative Squared Error
Workday 43,53,40 1,393% 1,189%
Holiday 43,53,40 15,518% 13,508%
Table 21. Testing of Electrical Power Phase T On Mechanical Engineering University of Lampung
Layer Relative Absolute Error Root Relative Squared Error
Workday 73,83,40 2,731% 6,077%
Holiday 73,83,40 3,107% 2,808%
JTE JTM
Work Day Holiday Work Day Holiday
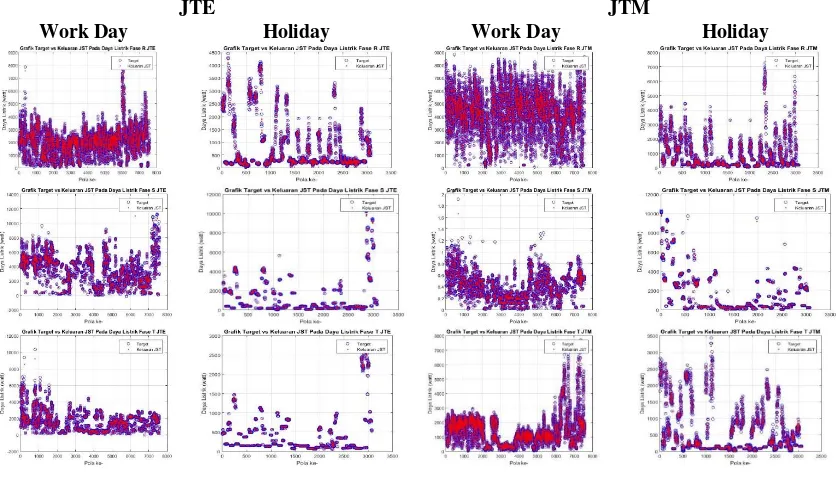
Figure 9. JTE & JTM Testing Chart
In figure 9 is the result of electrical power testing for each phase in JTE and JTM. It is known that the accuracy of testing has the smallest relative aboslute error value is 0.883% and the largest relative aboslute error value is 15.518%. So it can be concluded that the resulting network had been good to learning data.
PREDICTION
BUILDING Workday Holiday
JTE
JTM
Figure 10. JTE & JTM Prediction Chart
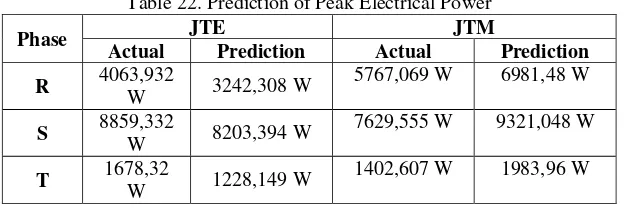
PREDICTION OF PEAK ELECTRICAL POWER
Table 22. Prediction of Peak Electrical Power
Phase JTE JTM
Actual Prediction Actual Prediction
R 4063,932
Some conclusions obtained from this research are:
1. The results of the prediction of electric power using backpropogation artificial neural network method show that with more learning inputs it produces a smaller error compared to the little learning input.
2. Relative absolute error on training result of electric power phase R,S,T in electrical engineering on work day are 0,884% ; 1,715% ; and 1,726% and on holiday are 1,294% ; 1,546% ; and 1,278%..
3. Relative absolute error on training result of electric power phase R,S,T in mechanical engineering on work day are 0,721% ; 1,157% ; and 1,542% and on holiday are 1,72% ; 2,987% ; and 1,022%.
4. Relative absolute error on testing result of electric power phase R,S,T in electrical engineering on work day are 0,883% ; 2,217% ; and 2,035% and on holiday are 4,174% ; 7,942% ; and 4,541%.
5. Relative absolute error on testing result of electric power phase R,S,T in mechanical engineering on work day are 0,913% ; 1,3535 ; and 2,731% and on holday are 2,653% ; 15,518% ; and 3,107%.
6. Peak electrical power R,S,T in electrical engineering are 3242,308 W ; 8203,394 W; 1228,149 W and mechanical engineering are 6981,48 W ; 9321,048 W ; 1983,96 W.
7. To get good training results and test results, we need to pay attention to the number of neurons in the hidden layer used during training. The suitability of the use of the number of neurons in the hidden layer has an effect on the number of errors in training and during testing.
REFERENCE
[1]. D Despa, G.F Name, M.A Muhammad, K Anwar. 2017. The Implementation of Internet of Things (IoT) Technology in Real Time Monitoring of Electrical Quantities. Bandar Lampung.
[2]. Atika Sari, Dinar. 2006. Predicts Short-Term Load Needs Using Backpropagation Neural Networks. Electrical Engineering Faculty of Engineering UNDIP, Semarang.
[3]. Kusumadewi, Sri. Building Artificial Neural Networks Using MATLAB & EXECL LINK, 2013. Yogyakarta: Graha Ilmu. [4]. Jong Jek Siang. Artificial Neural Networks and Programming Using MATLAB. ANDI Publisher. Yogyakarta. 2005 [5]. Fausett, Laurance, Fundamental of Neural Network. Precinte-hall, NJ, 2004.
[6]. Dikpride Despa, DKK, PPT Research Report Real-time Web Monitoring and Estimation of Electrical Systems with IoT Technology, Bandar Lampung, 2017.