INTERNATIONAL CONFERENCE ON
ECONOMY, ENTREPRENEURSHIP AND
HUMANITIES (ICEEH 2018)
e-ISBN: 978-967-15597-1-0
BANGI - PUTRAJAYA HOTEL, SELANGOR,
MALAYSIA
7 - 8 JULY 2018
INTERNATIONAL CONFERENCE ON ECONOMY,
ENTREPRENEURSHIP AND HUMANITIES (ICEEH 2018)
Copyright © 2018
Edusage Network (KT0415635-M)
All rights reserved. No part of this proceeding may be reproduced or
transmitted in any form or by any process without the prior written
permission of the publisher, except for the inclusion of brief quotations for a
review.
Proceeding: International Conference on Economy, Entrepreneurship and Technology (ICEEH 2018) (ISBN: 978- 967- 15597- 1- 0) Hotel Bangi - Putrajaya, Selangor, Malaysia.
1 TABLE OF CONTENTS
INFLUENCE OF ORGANIZATIONAL SUPPORT ON ENTREPRENEURSHIP PERFORMANCE OF SMES: A CASE OF MALAYSIAN HERBAL INDUSTRY ... 2
AN EMPIRICAL INVESTIGATION OF CASUAL RELATIONSHIP BETWEEN INTERNATIONAL TRADE AND ECONOMIC GROWTH DETERMINANTS IN PAKISTAN... 13
THE SUSTAINABILITY OF RENEWABLE ENERGIES IN ALGERIA: REALITY AND PERSPECTIVE... 29
TOWARD UNDERSTANDING LIVELIHOOD STRATEGIES OF URBAN REFUGEES IN MALAYSIA ... 45
THE VALIDITY AND RELIABILITY OF SELF-EFFICACY INSTRUMENT FOR ISLAMIC EDUCATION TEACHERS... 52
VALIDITY AND RELIABILITY OF THE ISLAMIC EPISTEMOLOGICAL BELIEF INSTRUMENT ... 62
FROM KNOWLEDGE SOCIETY TOWARDS RELIGIOUS WISDOM COMMUNITY:
UNDERSTANDING ICT IN ISLAMIC PERSPECTIVE ... 70
STRATEGY OF DEVELOPING SHARIA TOURISM OBJECT IN INDONESIA: SWOT APPROACH ... 82
FRACTIONALIZATIONS, MACRO DETERMINANTS AND ENTREPRENEURIAL ENTRY .... 95
FULFILLING PRIVACY AND PERSONAL DATA PROTECTION ISSUES ARISING FROM BIOPRINTING IN MALAYSIA: ADDRESSING THE HUMAN AND SOCIAL CONTEXT OF BIOMEDICAL INFORMATICS ... 103
DOES TRAINING CHARACTERISTIC CONTRIBUTE TO THE ACHIEVEMENT OF TRAINING OBJECTIVES? A CASE STUDY IN MALAYSIA ... 106
TAHAP PENGETAHUAN PEKERJA SEKTOR SWASTA TERHADAP FATWA BERKAITAN ZAKAT PENDAPATAN: KAJIAN DI CYBERJAYA, SELANGOR ... 111
AMALAN AGAMA SEBAGAI PENYEDERHANA DALAM KAJIAN KEJAYAAN FIRMA USAHAWAN: STATUS TERKINI DAN AGENDA MASA HADAPAN ... 123
Proceeding: International Conference on Economy, Entrepreneurship and Technology (ICEEH 2018) (ISBN: 978- 967- 15597- 1- 0) Hotel Bangi - Putrajaya, Selangor, Malaysia.
2
INFLUENCE OF ORGANIZATIONAL SUPPORT ON ENTREPRENEURSHIP
PERFORMANCE OF SMES: A CASE OF MALAYSIAN HERBAL INDUSTRY
Abdullahi M. A.1,2, Mohamed Z.1, Shamsudin M. N.1, Sharifuddin J.1
1Department of Agribusiness & Bioresource Economics, Faculty of Agriculture, 43400 UPM Serdang, Universiti Putra Malaysia, Malaysia.
2Department of Agricultural Economics & Extension, Faculty of Agriculture, Federal University Dutse, P.M.B. 7156, Jigawa State, Nigeria.
__________________________________________________________________________________________________
Abstract: Activities of small and medium sized enterprises (SMEs) have contributed significantly to environmental degradation that causes a disastrous effect on us and our future generation. Considering this, sustainable entrepreneurship practice has been promoted as a resolution of ecological problems capable of addressing climate change issues, public health, and safety concerns, and has become critical for competing in international markets. Pollution was exclusively identified causing environmental degradation among the upstream and downstream players in Malaysian herbal industry. In response, the Malaysian government focused on ensuring that SMEs produce products through safe and environmentally friendly practices. Literature suggests that organizational support influences the entrepreneurship practices of SMEs, hence provide them the impetus to achieve competitive advantage regarding turnover, customer attraction and market share opportunities to achieve business performance. Nonetheless, the implementation of sustainable entrepreneurship practices among the SMEs is still low due to numerous challenges. This paper intends to investigate the influence of organizational support on the entrepreneurship practices towards performance among SMEs in the Malaysian herbal industry. 300 herbal-based SMEs were surveyed using structured questionnaire. Data was analysed using descriptive statistics, exploratory factor analysis, confirmatory factor analysis, and structural equation model. The results show that organizational support have a positive effect on entrepreneurship practices and performance among the SMEs, accounting for 28% and 45% variance respectively. This finding reveals that organizational support is significantly related to entrepreneurship performance, thus substantiates previous findings on the crucial roles of organizational support in enabling organizations to achieve sustainable entrepreneurship performance. This study contributes to triple bottom line literature based on incorporation of strategic choice theory and resource-based view theory in entrepreneurship framework.
Keywords: Sustainable Entrepreneurship Practice, Organizational Support, Herbal-Based, Small and Medium-Sized Enterprises, Performance
Introduction
Small and medium enterprises (SMEs) constitute the most common form of enterprises in Malaysia.
They are known as significant contributors to the nation’s economy and sustainable development
Proceeding: International Conference on Economy, Entrepreneurship and Technology (ICEEH 2018) (ISBN: 978- 967- 15597- 1- 0) Hotel Bangi - Putrajaya, Selangor, Malaysia.
3 percent of the total waste generated in the pharmaceutical category. The result surpasses the 0.210 kg/cap/day projected by Agamuthu (2015).
Being one of the 17 megadiverse countries in the world and fourth in Asia, Malaysia is blessed with rainforest occupied with various flora and fauna, with over 2000 plant species with healing qualities and very high market potential for the herbal industry (EPU, 2013). The herbal industry has been identified as one of the economic drivers that could potentially make a significant contribution to the economic growth of the country (Rohana et al., 2017). The Malaysian herbal industry market estimate was RM10 billion in 2008 with a projected annual growth of 15 percent over the next ten years.
Considering Malaysia’s rich heritage, factors such as a shift in healthcare, the global increase in
nutraceuticals, and preference for natural products have been identified as crucial factors for Malaysia to become a significant player in the global herbal market (Sumin et al., 2016).
In line with achieving the National Agro-Food Policy (NAFP 2011-2020) objective, the Malaysian government has directed its focus on improving the managerial aspects of the SMEs particularly for environmentally friendly issues, to ensure that they are committed to implementing sustainable entrepreneurship practices. Therefore, the top management of SMEs should give more emphasis on providing adequate support capable of inculcating sustainable entrepreneurial performance. In their study, Senik et al., (2010) identified firms’ unique resources and capabilities as essential drivers of sustainable performance among SMEs in Malaysia apart from networking. Also, Singh and Mahmood (2014) posited that owner/managers with more information would have an edge in making decisions on business strategies to achieve competitive advantage and enhance performance.
Scholars argue that a firm’s internal resources determine its performance, and by supporting the internal resources the firm will be able to improve its performance and business strategies (Peng 2001; Barney, 1991; Penrose, 1959; Peteraf, 1993). Similarly, SMEs can use this strategy in creatively finding the opportunities outside their domestic market and taking advantage to exploit it and thus develop competitive advantage (Zahra & George, 2002). This strategy involves making choices between competing expansions and supporting strategies that depend on the market situation, firm’s resources and managerial goals and vision (Reid, 1983). The current business environment competes based on
firm’s support on its available resources including its skills, expertise and firms’ ability to leverage its competitive capabilities and strategically mobilize their valuable assets. A support on the firm’s resources and capabilities will improve the firm performance particularly in formulating strategy and profit determination. Singh & Mahmood, 2014 posited that the support of a firm’s internal resources and capabilities may generate competitive advantage that leads to superior performance.
The paper takes the view of scholars who argued that organizational support is an important antecedent crucial to entrepreneurship performance among SMEs (Abdullahi et al., 2018; Rezai et al., 2016; Tajasom et al., 2015; Setthasakko 2007). Also, Chaganti et al., (2002) mentioned that “top management support is intensely felt among SMEs because of their size, as such becomes vital in the
development of organizational culture.” However, the level of sustainable entrepreneurship practice
implementation towards performance is still low among the herbal-based SMEs in Malaysia due to little empirical research identifying factors affecting business in the industry. Therefore, this paper examines the role of organizational support in influencing sustainable entrepreneurship practices implementation towards performance among Malaysian herbal‐based SMEs. The study objectives are as follows:
Proceeding: International Conference on Economy, Entrepreneurship and Technology (ICEEH 2018) (ISBN: 978- 967- 15597- 1- 0) Hotel Bangi - Putrajaya, Selangor, Malaysia.
4 b. To investigate the relationship between organizational support and entrepreneurship performance among the herbal-based SMEs in Malaysia.
Literature Review
Sustainable entrepreneurship practice
Sustainable entrepreneurship practice refers to a firm's intraorganizational and interorganizational practices for managing upstream suppliers, internal operations, and downstream customers to simultaneously achieve firm performance. Although entrepreneurship is intentional and a planned behavior (Krueger et al., 2000), individuals only decide to implement sustainable entrepreneurship practices after careful thoughts, triggered by specific stimuli (Koe & Majid, 2013). This decision is crucial because it influences their behavior towards sustainable entrepreneurship, such as initiating and adopting new practices.
Over time, firm management regarding maintaining quality, long‐term, strategic relationships by selecting prospective suppliers, reducing the supplier base, and developing supplier programs have been long emphasized (Chen & Paulraj, 2004; Li et al., 2005). Thus, firms form strategic partnerships with their major suppliers to maintain long‐term healthy relationships through developing mutual trust and compatible cultures and sharing vision and information (Mentzer et al., 2000). Entrepreneurship practices related to supplier selection, evaluation, and development have become a critical strategic consideration in improving firm performance (Modi & Mabert, 2007; Narasimhan et al., 2008; Yang et al., 2010).
This study assumes the theoretical basis of resource‐based view of the firm, which posits that firm assets become the primary predictors of sustained competitive advantage when the resources are valuable, rare, inimitable, and non-substitutable (Barney, 1991; Corbett & Claridge, 2002). Therefore, the study emphasizes the view that herbal‐based SMEs' unique resources (which include all its assets and capabilities, its attributes, information, and the knowledge it controls) will enable them to implement sustainable entrepreneurship practices to attain sustainable business performance (Barney, Wright, & Ketchen, 2001).
Organizational support
Organizational support refers to a process of how top management guide and influence its employees to achieve organizational goals (Northouse, 2012). Effective leaders are needed because they contribute towards the success or failure of a group, organization, or even a whole country (Fiedler, 1996). Previous studies also have shown that a good leader can enhance firm performance (Ogbanna & Harris, 2000; Tarabishy et al., 2005; Yang, 2008), increase employees' satisfaction, and improve employees' motivation (Papalexandris & Galanaki, 2009). Organizational support by top management is a crucial driver in the successful transformation of an organization (McFadden et al., 2009). A study conducted by Abu and Sulaiman (2010) on manufacturing SMEs in Malaysia suggested that understanding the support by the top management of SME is crucial to ensure further development of SMEs in the country. Organizational support provides a sound strategic direction and encourages the motivation of employees (Hashim et al., 2012).
Proceeding: International Conference on Economy, Entrepreneurship and Technology (ICEEH 2018) (ISBN: 978- 967- 15597- 1- 0) Hotel Bangi - Putrajaya, Selangor, Malaysia.
5 significant changes realization require substantial time and energy. Consequently, leaders uninterested in sustainability initiatives may fail to provide motivational support, and active participation in change initiatives. Scholars (Kotter and Cohen, 2002; Kotter, 2007; Defee et al., 2010) argued that successful launching and implementing changes hinge on the product of organizational support from top leadership.
An organization’s effort of shifting towards sustainability may be considered an important change
initiative that requires cultural change throughout the entire organization (Harris and Crane, 2002). As such, the support by top leadership becomes a firm’s vital resource to successfully implement sustainability initiatives (Defee et al., 2010).
Based on the arguments by Abu and Sulaiman (2010) and Rezai et al., (2016) that organizational support by top management allows entrepreneurship development and continuous performance improvement among SMEs in Malaysia, the current study intends to contribute to these findings by evaluating the influence of organizational support on sustainable entrepreneurship practices towards performance among Malaysian herbal‐based SMEs. Therefore, investigating the potential impact of organizational support in guiding and maintaining entrepreneurship operation of Malaysian herbal‐ based SMEs towards sustainable business performance becomes imperative (Arham et al., 2011).
Performance
As global economic order unfolded, organizations are becoming aware of measuring their performance. Performance is multifaceted. For this research, three dimensions of performance are relevant: economic, environmental, and social performance. Hubbard (2009) suggested that measuring performance is likely to become more involved as stakeholder expectations about companies’ economic, environmental, and social responsibilities are constantly shifting.
Performance is one of the most important motives for implementing sustainable practices. Bowen et al., (2001) suggested that implementing practices of sustainability might not bring positive profitability and sales performance in the short‐term due to the initial substantial upfront costs. However, these practices will prepare firms for superior long‐term performance through the improved capacity for managing environmental risks and effecting continuous environmental and social improvement (Zhu & Sarkis, 2004). Proper implementation of improved practices about internal operations positively associated with firm sustainability performance.
Researchers have argued that the more often firms implement sustainable entrepreneurship practices, the higher performance they achieve regarding lower costs, higher product quality, faster and more reliable delivery, and process flexibility (Shah & Ward, 2003, 2007; Yang et al., 2010). These waste management practices would also be helpful in managing environmental pollutants and waste to improve environmental performance (Yang et al., 2011). Therefore, based on the above premise the study assumes that herbal‐based SMEs whose management provides support to its employees in implementing sustainable entrepreneurship practices would achieve business performance.
Description of SMEs in Malaysia
Proceeding: International Conference on Economy, Entrepreneurship and Technology (ICEEH 2018) (ISBN: 978- 967- 15597- 1- 0) Hotel Bangi - Putrajaya, Selangor, Malaysia.
6 To sum up, organizational support by SME management can influence the rate of sustainable entrepreneurship practices implementation towards achieving business performance by the firms. Based on the above arguments, this paper hypothesized that:
H1: Organizational support has a significant effect on sustainable entrepreneurship practice implementation among herbal‐based SMEs.
H2: Sustainable entrepreneurship practice implementation has a significant effect on herbal‐based SMEs entrepreneurship performance.
Methodology
Population and sample
The population for this study is the herbal-based SMEs registered with the National Pharmaceutical Regulatory Agency (NPRA), because they produce herbal products. There are about 532 or more herbal-based SMEs registered under the traditional and complementary medicine registered in different categories with NPRA in 2015 (NPRA, 2015). Consistent with the suggestions of Hair et al., (2010), a total of 300 sample is sufficient for this study 300, since a total of 532 herbal-based SMEs were involved in different categories (NPRA, 2016).
Instrument of research
The study used survey method to collect data. A structured questionnaire was designed to elicit information about firm profile characteristics, organizational support, sustainable entrepreneurship practices, and performance of the herbal-based SMEs in Malaysia. All items were designed in a
five-point Likert scale; based on ‘Strongly Disagree’ to ‘Strongly Agree’ to generate statistical measurements
among the herbal-based SMEs’ perception and opinions (Crust & Keegan, 2010). All items were adapted from previous established studies to ensure their reliability and validity. Table 1 presents a summary of the questionnaire used for the study.
Table 1: Information on the Questionnaire
Variable No of Items Source α Section A
Firm Profile Characteristics 5 Designed by researchers N/A
Section B
Proceeding: International Conference on Economy, Entrepreneurship and Technology (ICEEH 2018) (ISBN: 978- 967- 15597- 1- 0) Hotel Bangi - Putrajaya, Selangor, Malaysia.
7 Findings and Discussion
Firm profile characteristics
Table 2 provides a summary of the firm profile characteristics of the herbal-based SMEs. Majority of the firms were owned by sole proprietor (51%) followed by partnership (33%), and corporations (16%). More than two-third of the herbal-based SMEs have been established for less than 10 years (74%). It was also found that about half of the herbal-based SMEs employed less than five employees (53.4%) and have been in the market for less than 10 years (88.4%). For annual revenue, majority of the herbal-based SMEs were having less than RM300,000 (60.4%), and market their products locally (77%).
Table 2: Firm Profile Characteristics
Firm Profile Characteristics N = 300 F % Firm type
Sole Proprietorship 153 51.0
Partnership 99 33.0
Corporation 48 16.0
Firm Age
<10 years 222 74.0
> 10 years 78 26.0
Firm Size
<5 people 160 53.4
5 – 75 people 88 29.3
>75 people 52 17.3
Annual Revenue (RM)
<0.3 Million 181 60.4
0.3 – 15 Million 94 31.3
>15 Million 25 8.3
Market Experience
<10 years 265 88.4
>10 years 35 11.6
Firm Scope
Local 231 77.0
International 69 23.0
The Structural Model Evaluation
Proceeding: International Conference on Economy, Entrepreneurship and Technology (ICEEH 2018) (ISBN: 978- 967- 15597- 1- 0) Hotel Bangi - Putrajaya, Selangor, Malaysia.
8 indices examination is the initial step; a scenario of an adequate goodness-of-fit, therefore, demonstrates the soundness of the posited linkages.
Table 3: Goodness of Fit (GOF) Result
Measure Estimate Threshold Interpretation
CMIN 598.454 -- --
DF 265 -- --
CMIN/DF 2.258 Between 1 and 3 Excellent CFI 0.926 >0.95 Acceptable SRMR 0.063 <0.08 Excellent RMSEA 0.065 <0.06 Acceptable
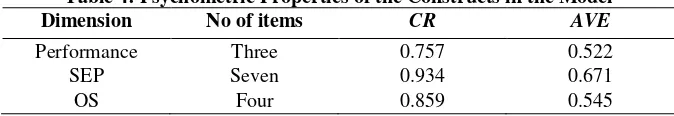
The measurement and structural model were assessed by structural equation modelling (SEM) using Amos Graphics because of its good explanatory nature via combining CFA and multiple regression analysis in a transparent manner (Zainudin, 2015). Table four presents the psychometric properties of the constructs tested in the model. As Hair et al. (2010) suggested, the required measurements refer to the investigation of convergent validity, individual item reliability, composite reliability, and discriminant validity of the measurement model. Assessment of convergent validity involves the factor loadings and cross-loadings of the indicators on their constructs, average variance extracted (AVE), and composite reliability (CR) as shown in Table three. All AVE values were higher than 0.50. However, since composite reliability is more accurate than Cronbach alpha, we used it to overcome potential deficiencies in the different indicator loadings. All composite reliability values were above the recommended threshold of 0.70, complying with the guidelines provided by Yi and Davis (2003). In the present research, AVE values ranged from 0.522 to 0.671 while CR values ranged from 0.757 to 0.934.
Table 4: Psychometric Properties of the Constructs in the Model Dimension No of items CR AVE
Performance Three 0.757 0.522
SEP Seven 0.934 0.671
OS Four 0.859 0.545
Empirical findings
Proceeding: International Conference on Economy, Entrepreneurship and Technology (ICEEH 2018) (ISBN: 978- 967- 15597- 1- 0) Hotel Bangi - Putrajaya, Selangor, Malaysia.
9
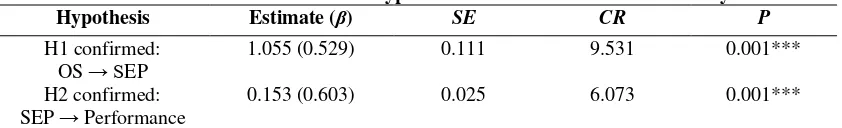
Table 5: Summarized Results for Hypotheses in the Structural Model Analysis Hypothesis Estimate (β) SE CR P
H1 confirmed: OS → SEP
1.055 (0.529) 0.111 9.531 0.001***
H2 confirmed: SEP → Performance
0.153 (0.603) 0.025 6.073 0.001***
Notes: (1) The numbers in bracket are standardized regression weights
(2) *** p < 0.001, R2= 0.28 and 0.45, SEP- Sustainable entrepreneurship practice; OS- Organizational
support; SE- standard error and CR- critical ratio.
Concluding remarks
Findings of this study show that organizational support have positive effects on sustainable entrepreneurship practice implementation towards performance as shown in the SEM analysis results. OS influences SEP implementation leading to higher business performance. Hence, supports the two hypotheses which postulated that; OS has a significant effect on SEP implementation among herbal‐ based SMEs, and SEP implementation has a significant effect on herbal‐based SMEs entrepreneurship performance. The results have shown that OS by the top management of herbal‐based SMEs has made some commitment to sustainable business performance through inculcating stainability attitude, and employee motivation towards implementing SEPs in their business activities. When top management is supportive and committed in providing an enabling work environment for its employees ensures increasing business performance. Conversely, uncommitted SMEs fail to motivate, support, and participate in such initiatives with their employees (Defee et al., 2010; Epstein, 2008; Kotter, 2007). Therefore, it is imperative for herbal‐based SMEs to concentrate on supporting its employees through a culture characterized by sustainability attitude, employee motivation, and support. This study supports the findings of Abdullahi et al., (2018) and Abu and Sulaiman (2010) that “supportive‐oriented leadership will enhance continual improvement in performance of an organization.” The results reinforce previous research on SMEs in Malaysia.
In conclusion, findings of this study suggest that SMEs top management seeking for increased business performance should strengthen their organizational support on their employees, which will provide an enabling environment for SEP implementation. A clear understanding of OS by top management is vital to sustainable business performance. Though SME size and scale of production
imposes a barrier to their success, Epstein (2008) believes that “SMEs can effectively achieve business performance when their top management is supportive to its employees.”
Limitations of the study
Like any other research, this study has its limitations, the study focus is limited on only the herbal-based SMEs registered under the National Pharmaceutical Regulatory Agency (NPRA) in Malaysia either as manufacturers, importers or wholesalers of herbal based-products categorized as traditional and complementary medicine. These SMEs have full time employees not exceeding 200 people. Therefore, the results should not be generalized for all herbal-based SMEs in Malaysia, because of the presence of other herbal-based SMEs dealing with food herbal-based products such as functional food and nutriceuticals.
Proceeding: International Conference on Economy, Entrepreneurship and Technology (ICEEH 2018) (ISBN: 978- 967- 15597- 1- 0) Hotel Bangi - Putrajaya, Selangor, Malaysia.
10 Future studies may consider studying large Malaysian firms using the same research framework since the primary respondents of this study are SMEs, we assume that this may likely cause some bias because SMEs rarely implement environmental management system due to high costs involved, non-availability of resources, well-developed entrepreneurship management systems and policies for sustainability.
Finally, the tendency of getting a different survey result using a similar sample from other developing countries in Asia, due to variation in business environment, cultural backgrounds, and competitive pressures or regulations. Future research should consider this and conduct a comparative study between the countries.
References
Abdullahi, M. A., Mohamed, Z., Shamsudin, M. N., Sharifuddin, J., & Ali, F. Effects of top leadership culture and strategic sustainability orientation on sustainable development among Malaysian herbal‐based SMEs. Business Strategy & Development.
Abu, K. Z., & Sulaiman, M. (2010). Market orientation and leadership styles of managers in Malaysia. International Journal of Leadership Studies, 6(2), 230–245.
Agamuthu, P. (2015, September). Circular Economic Utilization of Agriculture and Biomass Waste–A Potential Opportunity for Asia and the Pacific. In A background paper presented at the Sixth Regional 3R Forum in Asia and the Pacific (Vol. 24).
Agriculture NKEA, Herbs Sub-sector, Entry Point Project (EPP): High-Value Herbal Products. Ministry of Agriculture and Agro-Based Industry, Malaysia.
http://www.moa.gov.my/c/document_library.
Arham, A.F., Muenjohn, N., & Boucher, C. (2011). The role of entrepreneurial orientation in the leadership‐organisational performance relationship: A Malaysian SMEs perspective, paper presented to 24th Annual Small Enterprise Association of Australia and New Zealand (SEAANZ) Conference, Australian Technology Park, Sydney.
Awang, Z. (2015). SEM made simple: a gentle approach to learning structural equation modeling. MPWS Rich Publication.
Barney, J. (1991). Firm resources and sustained competitive advantage. Journal of Management 17 (1), 99–120.
Bowen, F. E., Cousins, P. D., Lamming, R. C., Farukt, A. C. (2001). The Role of Supply Management Capabilities in Green Supply. Production and Operations Management 10(2), 174-189. Chaganti, R., Cook, R. G., & Smeltz, W. J. (2002). Effect of styles, strategies and systems on the growth
of small businesses. Journal of Developmental Entrepreneurship, 7(2).
Chen, I. J., & Paulraj, A. (2004). Towards a theory of supply chain management: the constructs and measurement. Journal of Operations Management 22(2), 119–150.
Chung-Wen, Y. (2008). The relationships among leadership styles, entrepreneurial orientation, and business performance. Managing Global Transitions, 6(3), 257.
Crust, L., & Keegan, R. (2010). Mental toughness and attitudes to risk-taking. Personality and Individual Differences. Personality and Individual Differences, 49(3): 164-168.
Defee, C. C., Esper, T., & Mollenkopf, D. (2009). Leveraging closed-loop orientation and leadership for environmental sustainability. Supply Chain Management: An International Journal 14(2), 87-98.
Proceeding: International Conference on Economy, Entrepreneurship and Technology (ICEEH 2018) (ISBN: 978- 967- 15597- 1- 0) Hotel Bangi - Putrajaya, Selangor, Malaysia.
11 EPU (Economic Planning Unit). (2013). The Malaysian economy in figures 2013. [Online]. Available: http://www. epu.gov.my/ documents/10124/2257e64f-b08d-41b7-bed0-b6e6498c 38a3
Fiedler, F. E. (1996). Research on leadership selection and training: One view of the future. Administrative science quarterly, 241-250.
Gul, S., Ahmad, B., Rahman, S. U., Shabir, N., & Razzaq, N. (2012). Leadership styles, turnover intentions and the mediating role of organizational commitment. Information and Knowledge Management, 2(7), 44–51.
Hair, J. F., Black, W. C., Babin, B. J., & Anderson, R. E. (2010). Multivariate data analysis (7th Ed.) New Jersey: Pearson Prentice Hall.
Harris, L. C., & Crane, A. (2002). The greening of organizational culture: Management views on the depth, degree and diffusion of change. Journal of Organizational Change Management 15(3), 211-231.
Hashim, M. K., Ahmad, S., & Zakaria, M. (2012). A study on leadership styles in SMEs. Paper presented to International Conference on Islamic Leadership‐2 (ICIL 2), The Royale Chulan, Kuala Lumpur, 26‐27 September.
Hu, L. T., & Bentler, P. M. (1999). Cutoff criteria for fit indexes in covariance structure analysis: Conventional criteria versus new alternatives. Structural equation modeling: a multidisciplinary journal, 6(1), 1-55.
Hubbard, G. (2009). Measuring organizational performance: beyond the triple-bottom-line. Business Strategy and the Environment 18(3), 177-191.
Kline, R. B. (2005). Principles and practice of structural equation modelling (2nd ed.). New York, NY: Guilford.
Koe, W., & Abdul Majid, I. (2013). Sustainable Entrepreneurship among Small and Medium Enterprises (SMEs) in Malaysia. International Journal of Economics, Finance and Management, 2(4), 286-290.
Kotter, J. P., & Cohen, D. S. (2002). The Heart of Change, Harvard Business School Press, Cambridge, MA.
Kotter, J. R. (2007). Leading change-Why transformation efforts fail. Harvard business review, 85(1), 96-103.
Krueger Jr, N. F., Reilly, M. D., & Carsrud, A. L. (2000). Competing models of entrepreneurial intentions. Journal of business venturing, 15(5-6), 411-432.
Li, S., Rao, S. S., Ragu-Nathan, T. S., & Ragu-Nathan, B. (2005). Development and validation of a measurement instrument for studying supply chain management practices. Journal of
Operations Management 23(6), 618-641.
Mentzer, J. T., Min, S., Zacharia, Z. G. (2000). The nature of inter-firm partnering in supply chain management. Journal of Retailing 76(4), 549-568.
Modi, S. B., & Mabert, V. A. (2007). Supplier development: improving supplier performance through knowledge transfer. Journal of Operations Management 25(1), 42-64.
Narasimhan, R., Mahapatra, S., & Arlbjørn, J. (2008). Impact of relational norms, supplier development and trust on supplier performance. Operations Management Research 1(1), 24–30.
Northouse, P. G. (2012). Leadership: Theory and practice (6th ed.). Thousand Oaks: Sage Publication. Ogbonna, E., & Harris, L. C. (2000). Leadership style, organizational culture and performance: empirical evidence from UK companies. International Journal of Human Resource Management, 11(4), 766-788.
Proceeding: International Conference on Economy, Entrepreneurship and Technology (ICEEH 2018) (ISBN: 978- 967- 15597- 1- 0) Hotel Bangi - Putrajaya, Selangor, Malaysia.
12 Peng, M. W. (2001). The resource-based view and international business. Journal of
Management, 27(6), 803-829.
Penrose, E. T. (1959). The theory of Growth of the firm. London: Basil Blackwell.
Peteraf, M. A. (1993). The cornerstones of competitive advantage: a resource-based view. Strategic Management Journal, 14(3), 179-191.
Reid, S. D. (1983). Firm internalization, transaction costs and strategic choice. International Marketing Review,1(2), 44-56.
Rezai, G., Sumin, V., Mohamed, Z., Shamsudin, M. N., & Sharifuddin, J. (2016). Implementing Green Practices as Sustainable Innovation Among Herbal-Based SME Entrepreneurs. Journal of food products marketing, 22(1), 1-18.
Rohana, A. R., Zubaidah, S. S., Fahmi, A. B., Zanariah, N. M., & Lim H.F. (2017). Socio-economic background of herbal industry in Peninsular Malaysia. Forest Research Institute Malaysia 2017: Yogant Printing Enterprise, Shah Alam.
Senik, Z. C., Isa, R., Scott-Ladd, B., & Entrekin, L. (2010). Influential factors for SME internationalization: Evidence from Malaysia. International Journal of Economics and Management, 4(2), 285-304.
Setthasakko, W. (2007). Determinants of corporate sustainability: Thai frozen seafood processors. British Food Journal, 109 (2): 155-168.
Shah, R., & Ward, P. T. (2003). Lean manufacturing: context, practice bundles, and performance. Journal of Operations Management 21(2), 129-149.
Shah, R., & Ward, P. T. (2007). Defining and developing measures of lean production. Journal of Operations Management 25(4), 785-805.
Singh, H., & Mahmood, R. (2014). Combined effect of competitive and manufacturing strategies on export performance of small and medium enterprises in Malaysia. Global Journal of Management and Business Research.
Sumin, V., Rezai, G., & Mohamed, Z. (2016). Factors affecting the implementation of green practices among traditional and complementary herbal-based entrepreneurs in Malaysia. Borneo Akademika, 1(1), 79-87.
Tajasom, A., Mui Hung, D. K., Nikbin, D. & Hyun, S. S. (2015). The role of transformational leadership in innovation performance of Malaysian SMEs. Asian Journal of Technology Innovation, 23(2), 172-188.
Tarabishy, A., Solomon, G., Fernald, L. W. Jr., & Sashkin, M. (2005). The entrepreneurial leader's impact on the organization's performance in dynamic markets. Journal of Private Equity, 8(4), 20–29.
Yang, C., Lhin, S., Chan, Y., & Sheu, C. (2010). Mediated effect of environmental management on manufacturing competitiveness: An empirical study. International Journal of Production Economics 123(1), 210-220.
Yang, M. G. M., Hong, P., & Modi, S. B. (2011). Impact of lean manufacturing and environmental management on business performance: An empirical study of manufacturing firms. International Journal of Production Economics, 129(2), 251-261.
Yi, M. Y., & Davis, F. D. (2003). Developing and validating an observational learning model of computer software training and skill acquisition. Information Systems Research, 14(2), 146-169. Zahra, S. A. & George, G. (2002). International entrepreneurship: The current status of the field and future research agenda.
Proceeding: International Conference on Economy, Entrepreneurship and Technology (ICEEH 2018) (ISBN: 978- 967- 15597- 1- 0) Hotel Bangi - Putrajaya, Selangor, Malaysia.
13
AN EMPIRICAL INVESTIGATION OF CASUAL RELATIONSHIP BETWEEN
INTERNATIONAL TRADE AND ECONOMIC GROWTH DETERMINANTS
IN PAKISTAN
Dr. Imam Uddin1
Corresponding Author: Department of Accounting & finance, Institute of Business Management (IoBM), Karachi, Pakistan.
Imtiaz Ahmed Memon
PhD Scholar, SZAB University of LAW, Karachi, Pakistan.
___________________________________________________________________________________________________
Abstract: Growing trends towards the globalization of economies and swift and rapid development in financial and labor markets motivate us to examine the linkages between international trade and economic growth indicators of Pakistan. The results of Error Correction Model (ECM) and Granger causality tests suggest causal relationships among GDP, exports, imports, gross investment, official development assistance (ODA), remittances and trade. The results are robust to conclude that Pakistan’s economic growth has significantly been influenced by international trade and investment. This further leads us to conclude that a prime focus on investment and globalization can catalyze the process of growth in due course of time. The significance of the study lies in its methodology and results that can apply in studying other developing countries too. The overall results of the study have significant policy implications for developing the finance and trade policies in Pakistan.
Keywords: Economic Growth, Exports and Imports, Globalization, Granger Causality, Trade Openness.
Introduction
The world is moving towards the globalization faster than ever and studying the impacts of globalization on society, economy and politics at intra and inter regional levels. The debate on the casual linkages between international trade and economic growth in developed and developing countries has intensified. Several theoretical and empirical studies have devoted considerable attention to the link between the openness of international trade and economic performance. Globalization is a multi-faceted notion that shields socio-economic and political fields on a country. The globalization structure makes it stimulating for diverse meanings and to emanate a covenant on which the notion precisely means. It is well-defined by scholars and organizations throughout in economic literature. Nevertheless, there is an incomprehensive covenant on the meanings of globalization. Taken all other description into account, it becomes the amalgamation of capital, investment and labour markets or international markets (WTO, 2008). Thus, globalization is an element of generating prospects for developing economies and influencing their economic growth in a progressive way.
Proceeding: International Conference on Economy, Entrepreneurship and Technology (ICEEH 2018) (ISBN: 978- 967- 15597- 1- 0) Hotel Bangi - Putrajaya, Selangor, Malaysia.
14 higher weight on efficiency and productivity through a comparative advantage and technological spillover. Also, it condenses the prevalence of poverty by engendering additional employment prospects and escalating market magnitude (Ferrantino, et.al, 1997; Fiestas, 2005; Chaudhry et. al, 2010). Trade openness escalate the capital inflow and shrinks investment gap by increasing the investments through augmented market expansion (Chaudhry et. al, 2010). It relaxes government constraints, free operation of goods and services, and capital and labor force movements across the nations. In most of developing countries, the process of trade openness was started in the early 1980s by means of structural adjustment
program of ‘International Monitoring Fund’ (IMF) which conditionally executed by the World Bank and the concession context of the ‘World Trade Organization’ (WTO). The World Bank indicators exhibit that in the last decade of the 20th century, world trade to GDP-ratios had significantly increased
which triggers the increase in per capita income of around 3 billion people worldwide. The IMF’s
statistics presented that not only growth rate of liberalized economies increased but also the fatality of
internal debt crisis had reduced (World Bank, 2002). During the previous era of Pakistan’s economy, a
delimited trade regime was implemented owing the absence of effective organization, and feeble industrialization and manufacturing base. During the 1980s, trade openness policies were prejudiced with a significant replacement mechanism and given preferences over value-exchange rate in the economy. The then government approved numerous reforms to reinforce a free flowing of international transactions. Then, a widespread program of trade liberalization as part of the agreements with IMF and World Bank was started. The noteworthy steps of trade globalization contain a reduction in trade tariffs, removal of banned items list and renovation of Industrial Incentives Reform Cell into Tariff Commission. In addition, the adoption of flexible exchange rate system facilitated the decline of anti-exports biases. To encourage anti-exports, numerous additional measures were also commenced including the removal of exports duties, rebates of custom duties, refunds of sales tax, exports credit guarantee schemes and exports finance schemes. Pakistan had been achieved an impartial trade establishment level in the 90s due to trade reforms. In the 21st century, Pakistan continues the policy of trade openness as the existing government is working vigorously to keep an eye on tariff rationalization policies. The efforts are being made to pursue additional tariff and non-tariff hurdles and kept a tight focus on market based exchange rate system that provide a harmonization with industrial policy objectives.
In the context of a brief history of globalization and trade openness in Pakistan, this study empirically examines the impacts of trade openness on economic growth by using time series data. We use a variety of the variables that are relevant to trade and globalization such as exports and imports of goods and services, gross capital formation, official assistance and aid, remittance inflow and trade ratio as a share of GDP is linked with progress in the general trade volume of a country. In addition, the unique features of this paper incorporate key determinants of aid and official assistance which were never studied by other researchers. On that ground we can claim that this paper could be a substantial value addition in the existing body of knowledge. The paper is organized in a way that section 2 reviews previous literature; section 3 highlights theoretical framework; section 4 describes data, variables and methodology; section 5 covers the empirical results; and the final section discusses our conclusions.
Literature Review
The link between trade openness and economic growth has been investigated in length by a number of researchers but it remains controversial despite a political pronouncement which takes it as given. Adam
Smith in his famous writing of ‘the wealth of nations’1776, raised the importance of trade in economic
growth on the basis of ‘absolute advantage’. He assert that division of labor leads to specialization
which creates efficient productivity and increased outputs. Countries should produce and export the products to trading partners in which they have an absolute advantage being specialized. Later on,
Proceeding: International Conference on Economy, Entrepreneurship and Technology (ICEEH 2018) (ISBN: 978- 967- 15597- 1- 0) Hotel Bangi - Putrajaya, Selangor, Malaysia.
15
supplementary axiom that a country might have an absolute disadvantage but ‘comparative advantages’
can also be used in production and exports.
On the same note, Bhagwat et al., (1978) asserted that free trade and globalization carry forward specialization and productivity that could be acknowledged by development literature. Balassa (1978) changes numerous methods of exports and income to discover the association amid exports extension and economic growth in a sample of eleven developing countries who have a sound industrial base. Generally, the consequences recommend that an increase in exports positively affects the rate of economic growth. Tyler (1981) examines a realistic association between economic growth and exports expansion with a model of fifty-five middle income developing countries by means of cross country analysis. His results disclose a robust positive link between exports expansion and economic growth. Jung and Marshall (1985), and Chow (1987) were the foundational studies who lengthways this contour i.e. Jung and Marshall (1985) used the time series data of thirty-seven developing countries to determine a significant affiliation between exports and economic growth in four countries. Similarly, Chow (1987) carried out the Granger causality tests on time series data of eight newly industrialized countries to examine the causal pattern between exports and manufacturing productivity growth. His study notices the indication of bidirectional causality in Brazil, Hong Kong, Israel, Korea, Singapore, and Taiwan; and no causality in Argentina. Sachs and Warner (1995) build a binary index of openness that takes numerous features of trade policies including the black market premium, average tariff rates and non-tariff barriers on exchange rates. The index considers the countries open who have sophisticated growth rates. Edwards (1998) inspects the strength of openness and growth inter-connected to the usage of dissimilar gauges of openness. He found a noteworthy progressive association between openness and productivity growth. Piasolo (1995) explores the macroeconomic elements of economic growth in Korea. He marked a positive relationship between openness and growth after monitoring some additional elements of economic growth.
Proceeding: International Conference on Economy, Entrepreneurship and Technology (ICEEH 2018) (ISBN: 978- 967- 15597- 1- 0) Hotel Bangi - Putrajaya, Selangor, Malaysia.
16 The current United States Trade Representatives contended a disappointment and asserted that the Doha Development Agenda could not be accomplished through negotiations. That would be a misplaced prospect for a rapid development in LDCs (Pascal, 2006; Portman, 2006; Schwab, 2006). On the contrary, the theoretical studies argued that the claims that trade liberalization nurtures prompt progress and growth have no significant indications (Abbott et al., 2008).
Dreher (2006) examined the link between globalization and economic growth with panel data of one hundred and twenty-three countries for the period of 1970-2000. He establishes a fact that globalization affects the economic growth in a positive way. Shaikh and Shah (2008) studied the effects of globalization on Pakistan by using Computable General Equilibrium (CGE) model. Their results demonstrate that globalization affects the performance of macroeconomic indicators in a positive manner and leads to a robust economic development. Andesen and Babula (2008) found a positive connection concerning international trade and economic growth. In addition, two admonitions were also quoted by them. First, the problems of measurement errors and endogeneity which are abundantly discussed in empirical works. Another admonition communicates to the aptitude of developing countries to advance in productivity progress through trade liberalization. Lin (2010) studied the relationship between trade openness and inflation by using panel data of one hundred and six countries for the period of 1970 to 2007 and concluded a negative magnitude between trade openness and inflation rate. Iqbal et al. (2010) worked on causality among foreign direct investment (FDI), exports and economic growth in Pakistan and found that exports, imports, FDI and GDP growth are significant determinants for growth. The outcomes of their study showed that there exists a positive long run relationship among the determinants. Trade and FDI equally perform significant roles in economic growth of a country. Chang and Lee (2010) evaluated the links between general globalization index and its components including social, political and economic growth. They used the data of twenty-three ‘organization of economic
cooperation and development’ (OECD) countries for the period of 1970-2006. The results illustrate a feeble link among variants and causality in the short run but not in the long run. The causality was running from general, economic, social globalization to economic growth. Shahbaz et al. (2011) have considered a comparable connection in Pakistan using the data from 1960 to 2003. They used cointegration and multivariate Granger causality, established by Toda and Yamamoto (1995). Their empirical results exhibited long run associations among imports, exports and productivity growth as a unilateral causality from exports to productivity growth but no substantial causality between imports
and exports. Hye and Siddiqui (2011) employed ARDL and ‘rolling window regression’ approaches and
found a link between exports and growth. A noteworthy long run bond between real GDP and exports
was found. Polasek and Sellner (2011) examined the effects of globalization on country’s growth of
Proceeding: International Conference on Economy, Entrepreneurship and Technology (ICEEH 2018) (ISBN: 978- 967- 15597- 1- 0) Hotel Bangi - Putrajaya, Selangor, Malaysia.
17 diverse factors and proposed that in the long run trade openness gives positive way to the inflow of FDI. Hur and Cheolbeom (2012) used the model of ninety developed and developing countries for the years of 1958 to 2003. The conclusions of their study recommend that free trade agreement has trivial relationship with productivity growth but a momentous rising drift in contributing countries. Umaru (2013) explored the influence of globalization on economic progress of Nigeria during 1962 and 2009 by means of Annual Average Growth Rate method. He recognized that globalization influences manufacturing industry, solid mineral sectors and petrol in negative mode, but it influences agriculture, communication and transportation sectors in positive mode. GrangerButt and Javid (2013) estimated the impacts of foreign aid on fiscal conduct of government of Pakistan for the period 1960-2010. Results presented that aid diminishes both national income and borrowings as government substitute foreign aid / grants with national income and borrowings. Ying (2014) examined the relationship between
socio-political globalization and economic growth in ‘Association of South East Asian Nations’ (ASEAN)
countries for the period 1970-2008 by using Fully Modified Ordinary Least Squares method. His study showed that globalization positively influence economic growth.
Theoretical Framework
On the basis of theoretical and empirical literature reviewed above, the cultivation of theoretical framework is important to design a reasonable sagacity for the correlations to be examined. The relationships between foreign capital inflow and GDP have considered in various countries. Foreign capital inflows consisted of four components i.e. foreign aid, remittances, FDI and trade openness. Remittances stimulates community spending which rise the demand for goods (both locally produced and imported) but it does not affect investment (Abdih et. al, 2012). FDI leads to capital accumulation through which productivity as well as development upsurge. The empirical estimations on economic influence of foreign aid (ODA) in India reinforced the datum that federal government uses foreign financial inflows for non-developmental outlays. Therefore, government cogitates foreign inflows i.e., aid / ODA, loans, and grants as a substitute source of financing (Swaroop, Jha and Rajkumar, 2000). Trade openness influences international trade and growth through an increased volume of trade. A reduction in trade and tariffs can reduce the revenue of the country but the rise of trade volume outweighs its negative repercussions.
Data and Methodology
Data
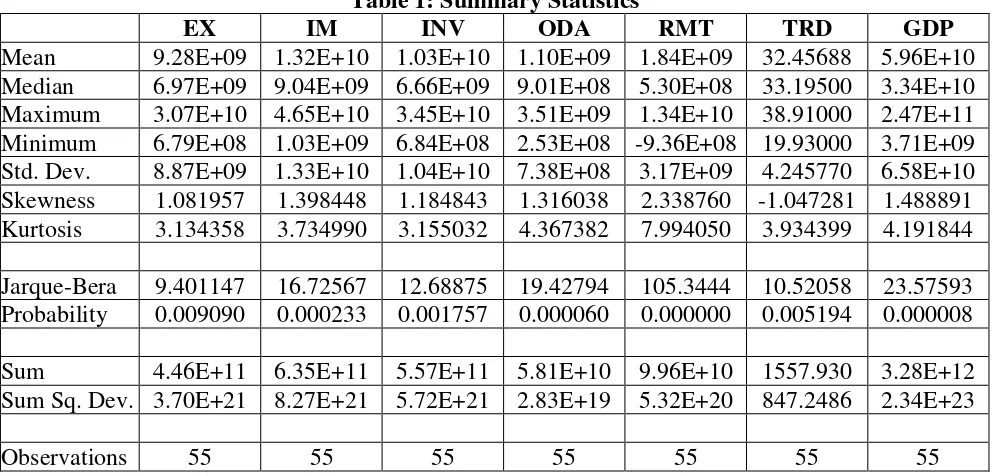
The data for this study is collected through world development indicators of the World Bank. All data series are in (constant 2005) US dollars unless indicated otherwise. Economic growth is measured by
‘gross domestic products’ (GDP), volume of trade is measured though exports and imports, gross
Proceeding: International Conference on Economy, Entrepreneurship and Technology (ICEEH 2018) (ISBN: 978- 967- 15597- 1- 0) Hotel Bangi - Putrajaya, Selangor, Malaysia.
18 Table 1: Summary Statistics
EX IM INV ODA RMT TRD GDP
Mean 9.28E+09 1.32E+10 1.03E+10 1.10E+09 1.84E+09 32.45688 5.96E+10 Median 6.97E+09 9.04E+09 6.66E+09 9.01E+08 5.30E+08 33.19500 3.34E+10 Maximum 3.07E+10 4.65E+10 3.45E+10 3.51E+09 1.34E+10 38.91000 2.47E+11 Minimum 6.79E+08 1.03E+09 6.84E+08 2.53E+08 -9.36E+08 19.93000 3.71E+09 Std. Dev. 8.87E+09 1.33E+10 1.04E+10 7.38E+08 3.17E+09 4.245770 6.58E+10 Skewness 1.081957 1.398448 1.184843 1.316038 2.338760 -1.047281 1.488891 Kurtosis 3.134358 3.734990 3.155032 4.367382 7.994050 3.934399 4.191844
Jarque-Bera 9.401147 16.72567 12.68875 19.42794 105.3444 10.52058 23.57593 Probability 0.009090 0.000233 0.001757 0.000060 0.000000 0.005194 0.000008
Sum 4.46E+11 6.35E+11 5.57E+11 5.81E+10 9.96E+10 1557.930 3.28E+12 Sum Sq. Dev. 3.70E+21 8.27E+21 5.72E+21 2.83E+19 5.32E+20 847.2486 2.34E+23
Observations 55 55 55 55 55 55 55
Model
This study uses Granger causality in Error Correction Model within a Vector Autoregressive framework
following the model used by Meraj (2013). The general specification of ‘auto regressive distribution lags’ (ARDL) is listed below:
t
The following specification of the ARDL model is used for this study:
)
Error Correction Model in Vector Auto Regressive Framework
From the equation (2), the following error correction model is derived:
)
Proceeding: International Conference on Economy, Entrepreneurship and Technology (ICEEH 2018) (ISBN: 978- 967- 15597- 1- 0) Hotel Bangi - Putrajaya, Selangor, Malaysia.
19
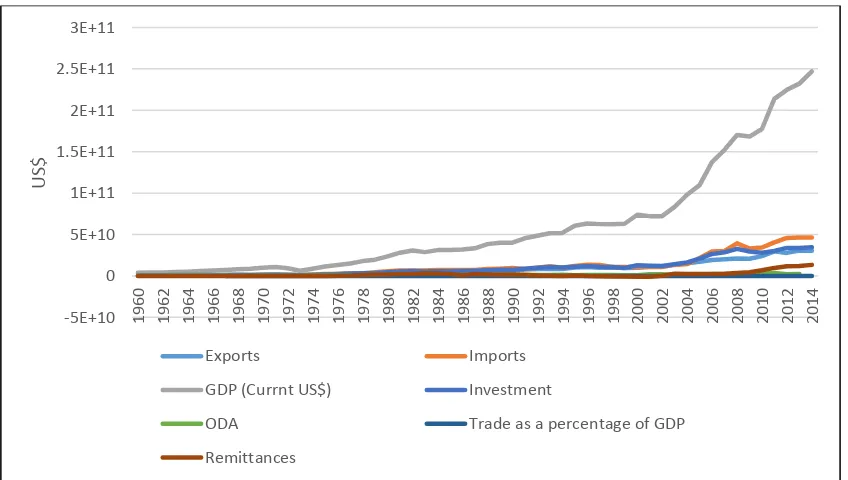
Figure 1: Trend of macroeconomic indicators during 1960–2014
During 1970 to 2013, the GDP is propagated by US$ 212.3 billion (17.2 times) to US$ 225.4 billion; variation ensued US$ 27.3 billion with a growing population of 123.1 million. In addition, US$ 185 billion raise the GDP per capita to US$ 1016. The lowest GDP was recorded in 1972 (US$ 8.3 billion) and the highest was in 2013 (US$ 225.4 billion). The GDP per capita rose by US$1016 (5.6 times) to US$1238. The average annual growth of GDP per capita was US$ 23.6 (10.6 percent).
At the end of 1950, the share of primary goods in exports was dropped to 75 percent of exports’
income owing to a modification in the policies of industrial development (Chaudhary and Ahmed, 2004). During the early 60s, the variables compacted to follow liberal trade policies but the battle with India in 1965 resulted the penalization of foreign exchange, to compensate that high duties were imposed on imports. During the 70s, the average growth rate of exports was recorded at 13.5 percent and imports was 16.6 percent and the average growth rate of trade deficit was 20.5 percent. In the 80s, the average growth rate of exports was 8.5 percent, imports was 4.5 percent, and the trade deficit was 0.9 percent. During the 90s, the average annual exports growth was 5.6 percent, imports was 3.2 percent and trade deficit was -0.6 percent. In the first decade of the 21st century, the average growth in exports was 9.9 percent, imports was 13.7 percent, and trade deficit was around 60 percent. Exports amounted to US$15.9 billion in 2009-10, that was higher than the preceding year’s figure of US$14.7 billion with the growth rate of 8 percent compared to growth rate of 3 percent in the preceding year. The imports progress in 2009-2010 was weaken by 2.8 percent as compared to the previous year. Reduced global prices, compacted internal demand, exchange rate devaluation and better production of cotton crops were the main factors for an overall drop in imports bills. Therefore, general representation of Pakistan’s trade displays that the nature of trade has transformed from primary goods to industrial products. Most of the exported goods are still primary agricultural products specifically raw cotton.
The United States started offering economic aid and martial assistance to Pakistan soon after its inception in 1947. Altogether, the US indebted approximately US$ 67 billion between 1951 and 2011 (see appendix A). The US, at numerous stages including a recently in the 1990, completely stopped its financial assistance and locked the doors of the USAID organizations. Such pattern condensed the US a
-5E+10
ODA Trade as a percentage of GDP
Proceeding: International Conference on Economy, Entrepreneurship and Technology (ICEEH 2018) (ISBN: 978- 967- 15597- 1- 0) Hotel Bangi - Putrajaya, Selangor, Malaysia.
20 distant call from a consistent and steadfast companion to Pakistan over the ages. In the 2009, in an effort to sign the US transformed promise to Pakistan, the US Congress sanctioned the Enhanced Partnership for Pakistan Act (generally famous as the Kerry-Lugar-Berman bill, or KLB). The purpose of KLB was to place security and growth on dual and distinct path, cloistering the growth agenda from erratic geopolitical and military actions and easing longer-term planning for growth. The act approved the extension economic and growth aid amounting to US$ 7.5 billion in five years’ period starting from
2010 for advancing Pakistan’s supremacy, economic development, and capitalization of inhabitants.
Remittances provides a momentous and emerging foundation of foreign exchange. The earlier upsurge of remittances inflow was started in the 70s when thousands of Pakistani laborers flew to the Gulf States in the search of a bright future. In the 2013, around 5.7 million Pakistani migrants were projected to be located abroad, compared with 3.7 million in 2000 and 3.6 million in 19901 (United Nation, 2014). It displays that around 54 percent of this evolution in the stock of immigrant took place throughout the period of 2000-2013. The elements motivating this upsurge movement consist of economic slowdown, growing poverty, speedy growth of population and considerable wage differences (Ministry of Finance, 2013). Pakistan is fronting a feeble balance of payments conditions and in these circumstances the remittances have appeared as a great source of foreign exchange income. The streams touched around US$14 billion in 2013 compared to only US$1 billion in 2001. Likewise, this proliferation in remittances has outstripped the net Official Development Assistance and FDI, which accounted for merely US$ 2.02 billion and US$1.31 billion in 2012 and 2013 respectively (WDI, 2014). Similarly, related to FDI and ODA, remittances has a tendency to robust and upsurge during economic chaos (Ahmed and Martinez, 2013; Mughal and Makhlouf, 2011).
We use equation (3) to get the empirical results, the following tests are applied to check the validity of the data:
Unit Root Testing
To check the stationarity of the data, two renowned tests are used i.e. ADF (augmented Dickey Fuller’ and PP (Philips Perron); the results are exhibited in table 2 below:
Proceeding: International Conference on Economy, Entrepreneurship and Technology (ICEEH 2018) (ISBN: 978- 967- 15597- 1- 0) Hotel Bangi - Putrajaya, Selangor, Malaysia.
21
Table 2: Unit Root Testing
Variables
Augmented Dickey-Fuller Philips-Perron
At Level At Δ At Level At Δ
Lgdp -0.507 -6.194* -0.497 -6.193*
Lex -0.961 -8.536* -1.143 -8.463*
Lim -0.559 -7.405* -0.535 -7.411*
Linv -0.973 -6.106* -0.974 -6.043*
Lod -2.203 -6.646* -2.048 -22.296*
Ltrd -2.458 -7.815* -2.408 -8.692
Lrmt -2.252 -6.353* 2.244 -6.241*
Note: *, **, *** indicate significance at 1%, 5%, 10% level of significance.
Note: All variables were I (I) non-stationary and transformed to stationary I (0) after first difference method applied; the confirmation is provided by both ADF and PP tests.
Johansen-Juselius Cointegration Test
After getting the confirmation of stationarity of the data, the next step is to check the cointegration between the variables; two different approaches are used to check this i.e. Johansen-Juselius and ARDL. The Johansen-Juselius method uses two different tests to check the cointegration i.e. Trace Statistics and Maximum Eigenvalues. The results of the tests are presented in table 3 below:
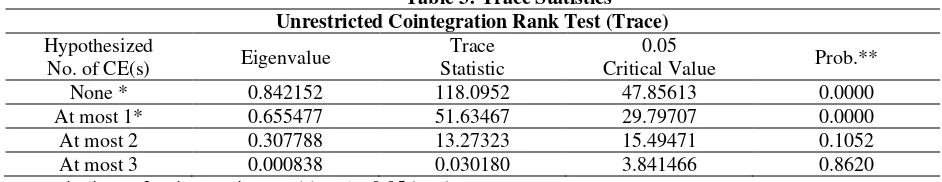
Table 3: Trace Statistics Unrestricted Cointegration Rank Test (Trace)
Hypothesized
No. of CE(s) Eigenvalue
Trace Statistic
0.05
Critical Value Prob.**
None * 0.842152 118.0952 47.85613 0.0000
At most 1* 0.655477 51.63467 29.79707 0.0000 At most 2 0.307788 13.27323 15.49471 0.1052 At most 3 0.000838 0.030180 3.841466 0.8620 Trace test indicates 2 cointegrating eqn(s) at the 0.05 level
* denotes rejection of the hypothesis at the 0.05 level **MacKinnon-Haug-Michelis (1999) p-values
Proceeding: International Conference on Economy, Entrepreneurship and Technology (ICEEH 2018) (ISBN: 978- 967- 15597- 1- 0) Hotel Bangi - Putrajaya, Selangor, Malaysia.
22
Table 4: Max-Eigen Value Statistics
Unrestricted Cointegration Rank Test (Maximum Eigenvalue)
Hypothesized No. of CE(s) Eigenvalue Max-Eigen Statistic Critical Value 0.05 Prob.**
None * 0.842152 66.46050 27.58434 0.0000
At most 1 * 0.655477 38.36143 21.13162 0.0001 At most 2 0.307788 13.24305 14.26460 0.0720 At most 3 0.000838 0.030180 3.841466 0.8620 Max-eigenvalue test indicates 2 cointegrating eqn(s) at the 0.05 level
* denotes rejection of the hypothesis at the 0.05 level **MacKinnon-Haug-Michelis (1999) p-values
The Trace statistics and Maximum-Eigen value statistics of Johansen cointegration test suggest that there are two cointegrating vectors in our VAR.
Cointegration in ARDL
ARDL is another method developed by Pesaran et al. (2001) which is being used to get the confirmation of cointegration. The substantial feature of using ARDL is that it uses both I (0) and I (I) variables as the issues of pre-test bias are well-handled in this method. By using the equation (3) mentioned above, the null hypothesis of no cointegration asserts that lag values of the model should be equal to zero. It can be written empirically as:
)
4
...(
0
6 5 4 3 2 1
0
=
=
=
=
=
=
=
Wald Test of Zero Restrictions
The results of Wald test of zero restrictions explain that the null hypothesis of no cointegration could be rejected at 5 percent level of significance; the results are presented in table-5 below:
Table 5: Wald Test Equation: ARDL
Test Statistic Value df Probability
F-statistic 3.103740 (7, 15) 0.0311
Chi-square 21.72618 7 0.0028
Proceeding: International Conference on Economy, Entrepreneurship and Technology (ICEEH 2018) (ISBN: 978- 967- 15597- 1- 0) Hotel Bangi - Putrajaya, Selangor, Malaysia.
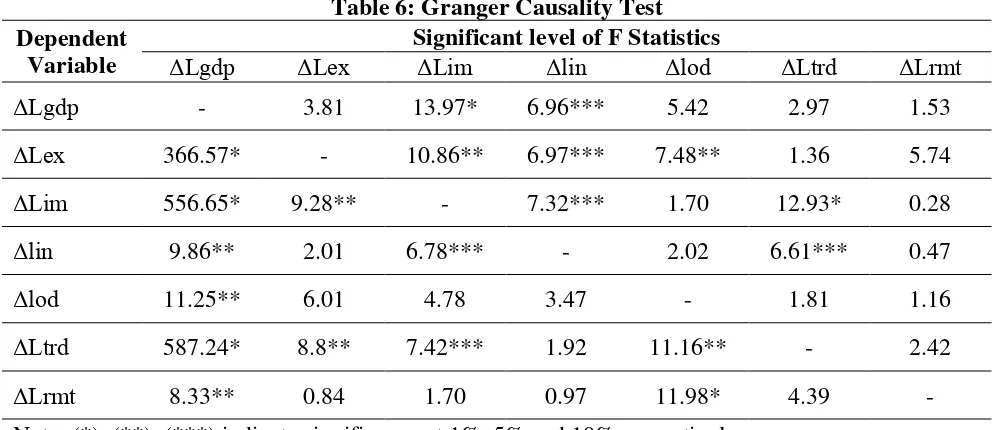
23 The empirical findings suggest that the export led growth hypothesis is valid for the case of Pakistan. The results of Granger Causality is presented in table 6 below:
Table 6: Granger Causality Test Dependent
Variable
Significant level of F Statistics
ΔLgdp ΔLex ΔLim Δlin Δlod ΔLtrd ΔLrmt
ΔLgdp - 3.81 13.97* 6.96*** 5.42 2.97 1.53
ΔLex 366.57* - 10.86** 6.97*** 7.48** 1.36 5.74
ΔLim 556.65* 9.28** - 7.32*** 1.70 12.93* 0.28
Δlin 9.86** 2.01 6.78*** - 2.02 6.61*** 0.47
Δlod 11.25** 6.01 4.78 3.47 - 1.81 1.16
ΔLtrd 587.24* 8.8** 7.42*** 1.92 11.16** - 2.42
ΔLrmt 8.33** 0.84 1.70 0.97 11.98* 4.39 -
Note: (*), (**) ,(***) indicate significance at 1%, 5% and 10% respectively
The table 7 below shows the Granger causality relationship among the variables:
Table 7: Granger Causality Relationships
GDP
Relationship Significant at Result
1. GDP and Exports
Exports Granger causes GDP 5%
Unilateral Granger causality
GDP doesn’t Granger cause Exports -
2. GDP and Imports
Imports Granger causes GDP 5% Bilateral Granger causality
GDP Granger causes Imports 5%
3. GDP and Investment
Investment Granger causes GDP 5% Bilateral Granger causality
GDP Granger causes Investment 10%
4. GDP and ODA
ODA Granger causes GDP 5%
Unilateral Granger causality
GDP doesn’t Granger cause ODA -
5. GDP and Trade Openness
Trade Openness Granger causes GDP 5% Unilateral Granger causality
GDP doesn’t Granger cause Trade Openness -
6. GDP and Remittances
Remittances Granger causes GDP 5% Unilateral Granger causality
Proceeding: International Conference on Economy, Entrepreneurship and Technology (ICEEH 2018) (ISBN: 978- 967- 15597- 1- 0) Hotel Bangi - Putrajaya, Selangor, Malaysia.
24 EXPORTS
7. Imports and Exports
Imports Granger causes Exports 10% Bilateral Granger causality
Exports Granger causes Imports 10%
8. Investment and Exports
Investment doesn’t’ Granger cause Exports -
Unilateral Granger causality
Exports Granger causes Investment 10%
9. ODA and Exports
ODA doesn’t’ Granger cause Exports - Unilateral Granger causality
Exports Granger causes ODA 5%
10. Trade Openness and Exports
Trade Openness Granger causes Exports 10% Unilateral Granger causality
Exports doesn’t Granger cause Trade Openness - 11. Remittances and Exports
Remittances doesn’t Granger cause Exports -
No causality
Exports doesn’t Granger cause Remittances -
IMPORTS
12. Investment and Imports
Investment Granger causes Imports 10% Bilateral Granger causality
Imports Granger causes Investment 10%
13. ODA and Imports
ODA doesn’t Granger cause Imports -
No causality
Imports doesn’t Granger cause ODA -
14. Trade Openness and Imports
Trade Openness Granger causes Imports 10% Bilateral Granger causality Imports Granger causes Trade Openness 5%
15. Remittances and Imports
Remittances doesn’t Granger cause Imports - No causality
Imports doesn’t Granger cause Remittances -
INVESTMENT
16. ODA and Investment
ODA doesn’t Granger cause Investment - No causality
Investment doesn’t Granger cause ODA -
17. Remittances and Investment
Remittances doesn’t Granger cause Investment - No causality
Investment doesn’t Granger cause Remittances - 18. Trade Openness and Investment
Trade Openness doesn’t Granger cause Investment -
Unilateral Granger causality Investment Granger causes Trade Openness 10%
ODA
19. Trade Openness and ODA
Trade Openness Granger causes ODA 5% Unilateral Granger
causality