SYNTHESIS AND CHARACTERIZATION OF CdS IN
SYNTHESIS AND CHARACTERIZATION OF CdS IN
DIOL VANILIN LIQUID CRYSTAL MONOMER
DIOL VANILIN LIQUID CRYSTAL MONOMER
H.L. Lee1, M. Abu Bakar1,*, J. Ismail1 and A.M. Issam2
1 Nanoscience Research Laboratory, School of Chemical Sciences, University Sains Malaysia, 11800 Penang, Malaysia University Sains Malaysia, 11800 Penang, Malaysia 2 School of Industrial Technology, University Sains Malaysia,
11800 Penang, Malaysia 11800 Penang, Malaysia
Received 30 March 2007; Accepted 20 June 2007 Received 30 March 2007; Accepted 20 June 2007
ABSTRACT ABSTRACT
H.L. Lee1, M. Abu Bakar1,*, J. Ismail1 and A.M. Issam2
1 Nanoscience Research Laboratory, School of Chemical Sciences,
2 School of Industrial Technology, University Sains Malaysia,
Nanocomposites comprising diol-vanilin and cadmium sulfide (CdS) has been synthesized via chemical precipitation method in ethanol at refluxed temperature (160 oC) for 12 hours. CdCl2. 2.5H2O and thiourea as cadmium and sulfide precursors respectively were employed. Diol vanilin is a thermotropic liquid crystal monomer which exhibits enantiotropic nematic metaphase texture when observed under polarizing microscope and confirmed by DSC thermal stability study. A series of different mass composition of diol vanilin and CdS nanocomposites ranging from 0.1:1.0 till 1.0:1.0(w/w) were prepared and characterized using XRD, TEM, SEM-EDX, POM and DSC. The X-ray diffraction pattern (XRD) showed broad peaks due to the formation of cubic CdS nanoparticles in diol vanilin matrix. The nanocomposites at low mass composition of CdS still maintained their nematic phase. However, the liquid crystal property was affected when the mass composition of CdS in nanocomposite was increased and the liquid crystal characteristic vanished when the mass composition was at 0.6:1.0. .
Keywords: CdS, diol vanilin, thermotropic liquid crystal, nanocomposite.
INTRODUCTION
The inorganic/organic nanocomposites have attracted great interest from the researchers due to their novel optical and electronic properties [1]. This could be attributed to the quantum confinement effect, nonlinear optical behaviors and the large ratio of surface to volume of these nanocrystals [2]. The nanocomposites exhibit controlled inorganic crystallite size [3] as well as the morphology. Most studied of inorganic/organic nanocomposites belong to the II-VI group and metal chalcogenides such as CdS. CdS has a wide spread applications in the field of electronics ranging from phosphors to photovoltaic cells. Two steps were generally required to synthesize metal sulfide in organic nanocomposites. Metal ions were initially introduced into an organic monomer and then a sulfur source was added for the preparation of nanocrystalline sulfide. Various preparation methods have been developed; (a) a control of particle growth using stabilizers or matrices like surfactant [4], phosphine oxides, polymers, reverse micelles, vesicles, LB films, multilayer film, xerogels and silica, (b) size fractionation by exclusion chromatography or gel electropheresis, (c) size selective chromatography [5].
In the past decades, many semiconductor/organic nanocomposites, such as CdS/poly vinyl alcohol [6], CdS/N-polyvinylcarbazole [7] and CdS/polystyrene [8], had been synthesized via a variety of methods. Nevertheless, there were a few reports on the incorporation of nanoparticles in liquid-crytalline polymer.
Several researchers [9, 10] have studied organoclay nanocomposites based on thermotropic liquid-crystalline polymer. In the most of the reported work, common polymers such as epoxy resin, polystyrene and polyvinyl alcohol (PVA) are often used as the matrix in the nanocomposites with CdS nanoparticles. However, to our best knowledge, no other researcher has reported on incorporation of CdS nanoparticle in thermotropic liquid crystal monomer even though Khiew and co-researchers [11, 12] have studied on synthesizing PbS and CdS nanoparticles in lyotropic liquid crystal using reverse microemulsion technique. In this paper, we report a simple chemical precipitation method to synthesize CdS in a nematic enantiotropic liquid crystal diol vanillin. Diol vanilin was synthesized from bisphenol N,N’-bis(4-hydroxy-3methoxy)-benzylidene-o-tolidine with 1-chloro-6-hexanol.
EXPERIMENTAL SECTION
Materials
Unless otherwise stated, all chemicals were commercially obtained and were used without further purification or distillation. The starting materials for the synthesis of CdS were CdCl2.2.5H2O (Sigma-Aldrich,
USA) and thiourea (Laboratory Chemical Co.). Absolute ethanol and sodium hydroxide were obtained from Systerm, Malaysia and Mallinckrodt Baker Inc., USA respectively. p-hydroxybenzaldehyde (Sigma-Aldrich, Germany), vanilin , o-tolidine (Fluka,
H.L. Lee, et al.
Germany), 1-chloro-6-hexanol, sodium carbonate Fluka (Germany), absolute ethanol (Systerm®,Malaysia) dimethylformamide (Fisher Scientific, UK), 1-butanol (Merck, Germany) and diethyl ether (Lab Scan, Thailand) were purchased. Doubly distilled water was used throughout the experiment.
Characterization
All samples were characterized by powder X-ray Diffraction (XRD). Data were collected on a SIEMENS D5000 X-ray diffractometer with monochromatic Cu-Kα (λ = 1.5405 Å) radiation filter in the 2θ range of 0-100o. Micrographs were obtained using a Philips CM12 using transmission electron microscope operating at 80 kV. 1 mg of the sample was dispersed in 3 mL of doubly distilled water and sonicated for 5 min. A few drops of dispersion were placed on a carbon coated copper grid and the solvent was evaporated off. A scanning electron microscope-energy dispersive X-ray (SEM-EDX) model Leica Cambridge S360 was used to observe the morphology and elemental composition of the product. The powders were mounted onto the metal holder through a double-sided tape and then coated with gold. The particle size of the sample was analysed using AnalySIS Docu Image Analyzer Ver. 3.1, GmbH, Germany. FT-IR spectra were measured on a Perkin-Elmer 2000 FTIR with a potassium bromide (KBr) beam splitter. Differential scanning calorimetry (DSC) measurements were carried out with a Perkin-Elmer DSC7 series at heating rate at 5 oC min-1 in nitrogen starting from 50 - 200 oC for diol vanilin. Melting point was obtained based on the peak of the melting temperatures from DSC analysis. The liquid crystalline mesophase was determined using a polarizing optical microscope (POM) Nikon Elipse E600 equipped with Linkam THMS 600 hot stage, Linkam TP93 temperature controller and Linkam LNP cooling system (pump).
Methods
Preparation of CdS
Solution A was prepared by dissolving 24 mg of cadmium chloride (CdCl2.2.5H2O) and 48 mg of thiourea
((NH2)2CS) into 30 mL of ethanol in a flask under
magnetic stirring at 160 oC in the oil bath. Solution B was prepared by dissolving 10 mg of sodium hydroxide (NaOH) in 10 mL ethanol. Then, 10 mL of solution B was rapidly pipetted into the solution. The mixed solution was held under reflux at 160 oC for 10 h. A white precursor was formed upon mixing of solution B into solution A. The precipitates was collected by centrifugation and washed repeatedly with doubly distilled water before being dried in the vacuum oven at 50 oC for 24 hours. The product was then used for characterization work.
Preparation of bisphenol N,N’-bis(4-hydroxy-3methoxy)-benzylidene-o-tolidine (I)
Bisphenol N,N’-bis(4-hydroxy-3methoxy)-benzyl-idene-o-tolidine was prepared with 0.1 mol of vanilin added drop wisely into solution of 0.05 mol o-tolidine in absolute ethanol. The mixture was refluxed for 6 hours with stirring. The product was then filtered, washed several times with diethyl ether and dried in the vacuum oven at 70 oC. Final purification was carried out by re-crystallization using 1-butanol.
Synthesis of diol vanilin (II)
A 0.4-mol of 1-chloro-6-hexanol and 0.45 mol of sodium carbonate were mixed in 400 ml of DMF. Then, 0.2 mol of the bisphenol N,N’-bis(4-hydroxy-3methoxy)-benzylidene-o-tolidine (I) in 60 mL DMF was added together with the above mixture in the 500 ml reaction flask. The mixture was then stirred and refluxed at 130
o
C for 12 hours. The product was precipitated by pouring the obtained solution into 2 liter cold distilled water. The precipitation was then filtered, washed several times with diethyl ether and dried in the vacuum oven at 90 oC. Final purification was carried out by re-crystallization using the mixture solvent of DMF: 1-butanol (1:1) to give light green crystals.
Preparation of (1.0:1.0 w/w) CdS/diol vanilin composite
A 24-mg of cadmium chloride (CdCl2.2.5H2O)
and 24-mg of diol vanilin were dissolved in 15 ml of ethanol. Solution A was prepared by dissolving 12 mg of sodium hydroxide (NaOH) in 12 mL ethanol.
(b)
(c)
(d)
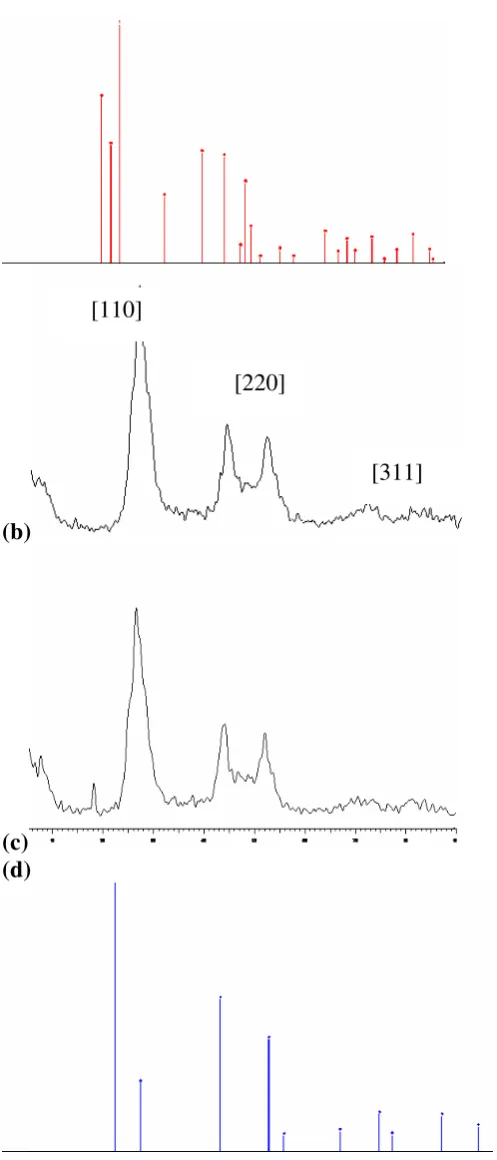
Fig 1. X-ray diffraction pattern of (a) hexagonal CdS
(JCPDS 01-080-0006) (b) as-prepared CdS nanoparticles (c) as-prepared CdS in nanocomposites (1.0:1.0 w/w) (d) cubic CdS (JCPDS 03-065-2887)
[110]
[220]
Fig 2. The EDX pattern of nanocomposite (1.0:1.0 w/w)
[311]
Ten mililiters of solution A was added in the mixture and stirred refluxed at 160 oC in the oil bath for 12 h. A 48 mg of thiourea ((NH2)2CS) in 15 mL of ethanol and
was added drop wise during the reaction. The obtained nanocomposite was collected by centrifugation and washed repeatedly with ethanol before drying in the vacuum oven at 50 oC for 24 hours. The products were then used for characterization work. A series of different mass composition of CdS to diol vanillin, were also prepared and characterized accordingly.
Fig 1 shows the XRD pattern of the as-synthesized CdS nanoparticles and nanocomposites at the mass composition of 1.0:1.0. The pattern obtained for the as-prepared CdS and the nanocomposites correspond to pure cubic CdS when compare with the standard reference (JCPDS 03-065-2887). The three peaks with 2θ values of 26.6, 44.0 and 52.0 for both samples are assignable to the three Miller indices of (111), (220) and (311). The broad peaks in the diffractogram indicate that the dimension of CdS nanoparticles are small.
The product composition was characterized by SEM-EDX analysis. The EDX pattern for CdS powder obtained is shown in Fig 2 suggest the presence of elemental Cd, S, C and O. The atomic ratio of Cd:S is 11.05:10.75 which can be translated into stoichiometric ratio of approximately 1:1. The result obtained agrees with the formulation and formation of CdS. The presence of C and O are attributed to diol-vanilin matrix in this nanocomposite. The sample is observed to have near spherical particles and the overall morphology of the particles is almost homogenous as shown in Fig 3.
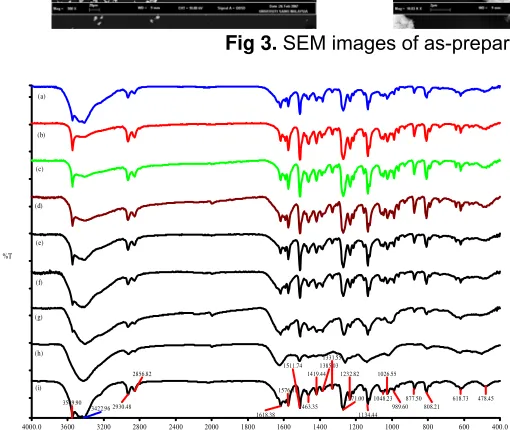
Fig 4 shows the FT-IR spectra of the nanocomposites synthesized with different mass compositions. FT-IR spectrum of pure diol vanilin (Figure 4(i)) shows the absorption band at 1618cm-1,
Fig 3. SEM images of as-prepared nanocomposites (1.0:1.0 w/w)
4000.0 3600 3200 2800 2400 2000 1800 1600 1400 1200 1000 800 600 400.0 cm-1
Fig 4. FT-IR spectra for nanocomposite of (a-h) mass
composition of 0.1:1.0 till 1.0:1.0 w/w (CdS: diol vanilin) and (i) pure diol vanilin
indicating the presence of azomethine, –CH=N- group. The peaks at 1576 and 1511 cm-1 are due to aromatic ring skeletal vibration and the olifinic C=C stretching, respectively.
The methoxy, -OCH3 stretching is positioned at
2857 cm-1. The para disubstituted nature of aromatic rings is evident by the bending mode of aromatic ring hydrogens at 808 cm-1. The peak of 3423 cm-1 and 3550 cm-1 can be assigned to hydroxyl, –OH group and aromatic amine are also found in the spectrum. CdS is Raman active [13] and could not be observed in the FT-IR spectra.
The spectra of nanocomposites at 0.2: 1.0 (w/w) and beyond show a change of peak intensity in the range 3423–3550 cm-1. When 30% of CdS composition is introduced in the samples, the peak intensity at 3550 cm
-1
has developed stronger whereas the peak at 3423 cm-1 becomes weaker. However, when more CdS is added in the samples, the peak intensity at 3423 cm-1 became more apparent compared to the nanocomposites at the mass composition of 0.2: 1.0 till 0.4:1.0. The peak subsequently becomes broader and only one peak is observed at 3428 cm-1 when the nanocomposites at the mass composition of 0.8: 1.0 up to 1.0:1.0 (w/w). The
changes are due to the physical interaction of CdS with the –OH group or the aromatic amines that present in the diol vanilin. Besides that, there is a shift for peak positioned at 1271 cm-1, which is assigned to the –C-O-C- stretching. This peak is shifted from 1271 cm-1 to 1265 cm-1 and consequently to 1260 cm-1 when the mass composition is 0.8:1.0 and 1.0:1.0 respectively. These results are attributed to the interaction of CdS with -OCH3 group in diol vanilin. Otherwise, the rest of
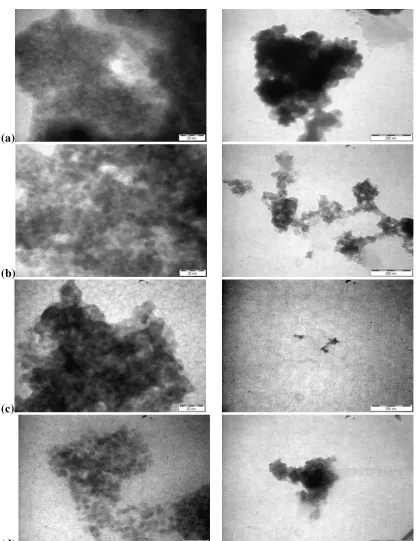
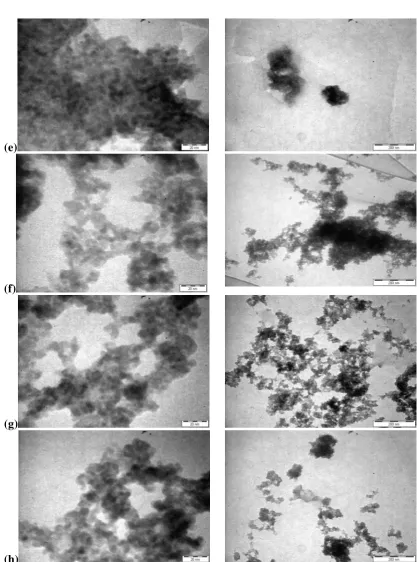
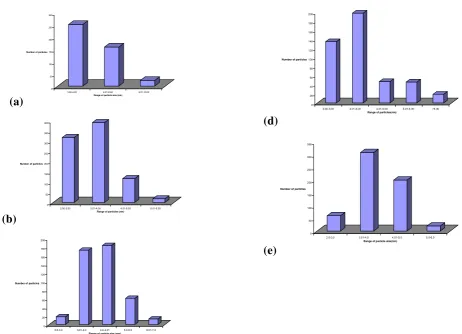
the peaks in the FT-IR spectra remain unchanged. Typical TEM images of the as-prepared nanocomposites at various mass compositions are shown in Fig 5. TEM analyses show that the presence of diol vanilin control the size of the CdS nanoparticles in all the mass composition of the nanocomposites. The TEM micrographs show that the particles are distinguishable and thus, they are not aggregated into a big particle. The average particle size and standard deviation obtained are tabulated in Table 1. The average particle is in consistent size and has irregular rounded shape. The average size of CdS in all the nanocomposites, except for the sample with mass composition of 0.4:1.0, is less than 4.0 nm with the standard deviation of ≤1.0 nm. The average particle size is smaller than that of as-prepared CdS without diol-vanilin where the as-prepared CdS’s average size is 6.3 + 1.1 nm. Figure 6 shows the size distribution of selected mass composition of nanocomposites are in the range of 3.0-4.0 nm which unlike the as-prepared CdS that falls in the broader range of 5.0-7.0 nm.
Table 1. Average particle size and standard deviation
of the prepared nanocomposites at various mass compositions (w/w) of CdS: diol vanillin.
Nanocomposite (w/w) (Average size + SD) nm
(a)
(b)
(c)
(d)
Fig 5. TEM micrographs of the as-prepared nanocomposites (CdS: diol vanilin) w/w at various mass
compositions (a) 0.1:1.0 (b) 0.2:1.0 (c) 0.3:1.0 (d) 0.4:1.0 (e) 0.5 :1.0 (f) 0.6:1.0 (g) 0.8:1.0 (h) 1.0:1.0 (continued to next page).
(e)
(f)
(g)
(h)
Fig 5 (cont.). TEM micrographs of the as-prepared nanocomposites (CdS: diol vanilin) w/w at various mass
compositions (a) 0.1:1.0 (b) 0.2:1.0 (c) 0.3:1.0 (d) 0.4:1.0 (e) 0.5 :1.0 (f) 0.6:1.0 (g) 0.8:1.0 (h) 1.0:1.0
Thermal and optical behaviour
The phase transition temperatures of the nanocomposites are presented in Table 2. The melting (Tm) and isotropization (Ti) points is clearly identifiable
from DSC thermograms. The DSC heating scan of
nanocomposites at various mass compositions show two endothermal peaks: a greater intensity peak is assigned from solid to mesophase transition while the smaller peak is assigned from mesophase transition to isotropic phase respectively.
(a)
Range of particle size (nm)
(b)
2.00-3.00 3.01-4.00 4.01-5.00 5.01-6.00
Range of particles (nm)
(c)
2.0-3.0 3.01-4.0 4.0-4.01 5.0-6.0 6.01-7.0
Range of partcle size (nm)
(d)
2.00-3.00 3.01-4.00 4.01-5.00 5.01-6.00 >6.00
Range of particles(nm)
Number of particles
2.0-3.0 3.01-4.0 4.01-5.0 5.0-6.0 Range of particle size(nm)
Fig 6. Histogram of size distribution of (a) CdS particles and CdS particles in the nanocomposites (CdS: diol vanilin)
at different mass composition (w/w) (b) 0.2:1.0 (c) 0.4:1.0 (d) 0.5:1.0 (e) 1.0:1.0
Table 2. Transition temperatures of CdS: diol vanilin
nanocomposites (at different mass composition. Nanocomposite
Cr, crystal; N, nematic; I, isotropic
Fig 7. DSC thermogram of pure diol vanilin and
selected CdS: diol vanillin nanocomposites (CdS: diol vanilin) (0.1:1.0, 0.6:1.0 and 0.8:1.0).
Fig 7. shows the DSC thermogram of pure diol vanilin and selected CdS:diol vanillin . The melting and isotropication points for pure diol vanilin are at 171.0 oC and 188.7 oC respectively. Generally, the introduction of CdS in diol vanillin decreases both the melting and
(a)
Cooling- 98 oC Cooling- 122 oC
(b)
Heating- 165 oC Cooling- 137 oC
(c)
Heating- 50 oC Isotropic- 220 oC
(d)
Cooling-172 oC Heating- 208 oC
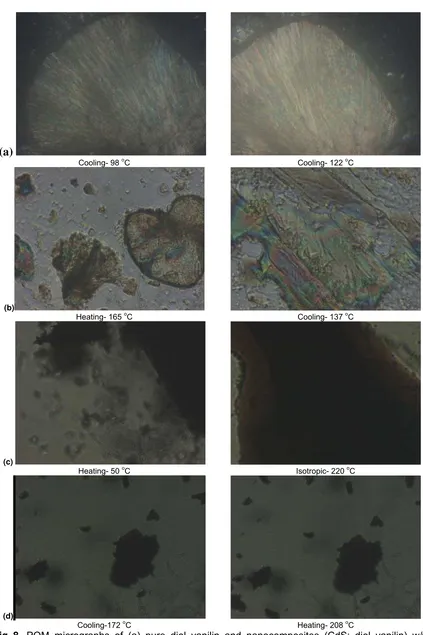
Fig 8. POM micrographs of (a) pure diol vanilin and nanocomposites (CdS: diol vanilin) w/w at
various temperatures (b) 01:1.0 (c) 0.6:1.0 (d) 0.8:1.0
isotropication insignificantly. A reverse trend is observed for 0.4:1.0 and 0.5:1.0 nanocomposites. The liquid crystal property disappears when the CdS: diol-vanillin mass composition is 0.6:1.0 or greater. Only single melting peak is observed in DSC. When the mass composition is 0.8:1.0 and beyond, no melting point is observed. The mesophase is recognized from the coloured fluidity flow with phase between the crossed polarizers in the microscope exhibited by the nanocomposites. The sample showed Schlieren threaded texture which indicates the nematic mesophase. The obtained nanocompsites are enantiotropic and they are reproducible on repeated heating and cooling cycles. The POM observations correspond well with the DSC obtained results. As observed in the POM micrographs (Figure 8), the dark spots indicate the presence of CdS particles in the samples. When the mass composition of CdS is increased in the sample, the dark spots are more obvious in the micrographs. However, when the mass composition of CdS in the nanocomposite is 0.6:1.0 and beyond, the mesophase of liquid crystal disappears.
CONCLUSION
The preparation nanocomposites comprising diol vanilin and cadmium sulfide (CdS) is successfully synthesized. The X-ray diffraction pattern (XRD) confirms that the broad peaks are attributed to the formation of cubic CdS nanoparticles in diol vanilin matrix. Introduction of diol vanilin is observed to have control the particle size of CdS in the nanocomposites. The average particle size in all the prepared nanocomposites at different mass composition except sample at 0.4:1.0 (w/w) is less than 4 nm with the standard deviation ≤1.0 nm. The size distribution for nanocomposites is also narrower compared with that of as-obtained CdS nanoparticles. The analyses from POM and DSC reveal that mass composition from 0.1: 1.0 up to 0.5:1.0 of CdS in the nanocomposites show their enantiotropic nematic phase. Otherwise, when the mass composition of CdS in nanocomposite at 0.6: 1.0 and greater, the liquid crystal property is affected.
ACKNOWLEDGEMENT
This research is supported in part by Malaysia Toray Scientific Foundation (MTSF) Science and Technology Grant 2005 (304/PKimia/650343/T102) and USM short term grant (304/PKimia/638035).
REFFERENCES
1. Liu, S.H., Qian, A.X.F., Yin, J., Ma, X.D., Yuan, J.Y., and Zhu, Z.K., 2003, J. Phys. & Chem. Solids, 64, 544-458.
2. Favero, P.P., Souza-Parise, M.D.,Fernandez, J.L.R., and Miotto, R., 2006, Braz. J. Phys., 36(3B), 1032-1034.
3. Sedaghat, Z., Taghavinia, N.,and Marandi, M., 2006, Nanotechn., 17, 3812-3816.
4. Nosaka, Y., Yamaguchi, K., Kuwabara, A., Miyama, H., Baba, R., and Fujishima, A.J., 1992, Photochem. & Photobiol. A: Chem., 64(3), 375-382.
5. Murakoshi, K., Hosokawa, H., Saitoh, M., Wada, Y., Sakata, T., Mori, H., Satoh, M., and Yanagida, S., 1998, J. Chem. Soc., Faraday Trans., 94(5), 579-586.
6. El-Tantawy, F., Abdel-Kader, K.M., Kaneko, F., and Sung, Y.K., 2004, Eur. Polym. J., 40(2), 415-430. 7. Wang, Y., and Herron, N., 1992, Chem. Phys. Lett.,
200(1-2), 71-75.
8. Antolini, F., Pentimalli, M., Di Luccio, T., Terzi, R., Schioppa, M., Re, M., Mirenghi, L., and Tapfer, L., 2005, Mater. Lett., 59(24-25), 3181-3187.
9. Chang, J.-H., Seo, B.-S., and Hwang, D.-H., 2002, Polymer, 43(10), 2969-2974.
10. Huang, W., and Han, C.D., 2006, Polymer, 47(12), 4400-4410.
11. Khiew, P.S., Huang, N.M., Radiman, S., and Ahmad, M.S., 2004, Mater. Lett., 58(3-4), 516-521. 12. Khiew, P.S., Radiman, S., Huang, N.M., and Soot
M., 2003, J. Cryst. Growth, 254(1-2), 235-243. 13. Nandakumar, P., Vijayan, C., Rajalakshmi, M.,
Arora, A.K., and Murti, Y.V.G.S., 2001, Phys. E: Low-dimensional Syst. & Nanostruct., 11(4), 377-383.