The Development of An Analytical Overlay Design Procedure
Based on The Asphalt Institute’83 Method
Djunaedi Kosasih1
Abstract: Pavement structural evaluation using pavement modulus values resulting from back calculation process on non-destructive deflection data has been adopted to quantify objectively the conditions of existing pavements under various traffic loading and environmental conditions. However, such an advanced technique is not yet followed widely by advances in analytical overlay design procedures. One possible reason is perhaps due to its requirement to perform complex computations. A new module of computer program BackCalc has been developed to do that task based on the allowable maximum deflection criterion specified by the Asphalt Institute’83. The rationale is that adequate overlay thickness will be computed by iteration to result in theoretical maximum deflection that closely matches against the specified allowable maximum deflection. This paper outlines the major components of the program module illustrated by using a practical example. The overlay thickness obtained was found to be comparable with that of the known AASHTO’93 method.
Keywords: analytical overlay design procedure, allowable maximum deflection criterion, back calculation process, pavement modulus
Introduction
Pavement structural evaluation using pavement modulus values resulting from back calculation process on non-destructive Falling Weight Deflec-tometer (FWD) deflection data has been adopted to quantify objectively the conditions of existing pave-ments under various traffic loading and environ-mental conditions. It was confirmed by the previous study that pavement structure behaves differently with different wheel loads [1]. Pavement moduli tend to increase with increasing stress level occurring within the pavement, imposed by heavier wheel loads. The effects of environmental factors, such as pavement temperature and the season, on pavement modulus are also significant [2,3]. If asphalt layer temperature is higher, its modulus will be lower. Also, in the wet season, subgrade modulus will be lower. All these dynamic characteristics of pavement structure materials could be taken into account in the design process of new pavement structures [3,4,5,6].
On the other hand, such an advanced technique is not yet followed widely by advances in analytical overlay design procedures. One possible reason is
1 Civil Engineering Department, Faculty of Civil Engineering and Environment , Bandung Institute of Technology, Indonesia E-mail: [email protected], [email protected]
Note: Discussion is expected before June, 1st 2008, and will be published in the “Civil Engineering Dimension” volume 10, number 2, September 2008.
Received 27 July 2007; revised 25 August 2007; accepted 28 September 2007.
perhaps due to its requirement to perform complex computations, particularly for structural analysis and back calculation process. For these computa-tions, the application of computer software is appa-rently unavoidable [7].
An analytical overlay design method available at present is the AASHTO’93 method that uses pavement moduli of a simple two-layered system structure model [3]. But, the subsequent process in calculating overlay thickness in this method still relies on the empirical structural number theory. For manual process, this analytical-empirical approach is quite sensible. On the other hand AASHTO [3] has introduced the assessment of structural conditions of existing pavements objec-tively by using back calculated pavement moduli. It also demonstrates that analytical approach to designing overlay thickness is effective. The only limitation of the AASHTO’93 method, if any, relates to its lacking procedure for measuring the effec-tiveness of the resulting overlay thickness. This feature should normally be inherently provided in any analytical design method.
Back calculation process is performed internally by program BackCalc. The existing pavement is modeled as a three-layered system structure to realistically represent the asphalt layer, the aggre-gate layer and the subgrade, respectively; and with the overlay, it becomes a four-layered system structure. Irwin [10] stated that goodness-of-fit criteria alone are not adequate. Hence, program BackCalc also introduces modular ratio criteria, by which the back calculated modulus of the asphalt layer will always be higher than that of the aggregate layer, and the modulus of the aggregate layer will be higher than, or the same as, that of the subgrade.
The proposed analytical overlay design procedure is arranged in such a way that structural analysis is performed at the prevailing condition observed during the FWD deflection survey, rather than at the standard temperature. This promising technique leads to an assumption that the overlay modulus may be treated the same as the back calculated asphalt layer modulus.
This paper outlines in detail each major component of the program module illustrated by a practical example using secondary data collected from a primary arterial road in Bandung [11]. Thereafter, the resulting overlay thickness is compared with that obtained from the AASHTO’93 method. In the next two sections, the program module and the proposed analytical overlay design procedure will first be described briefly.
Asphalt Institute’83 Overlay Design Module
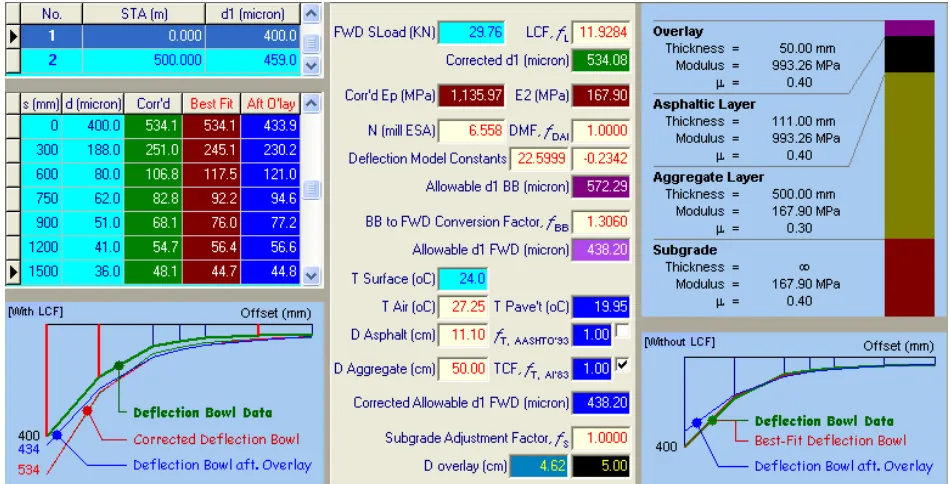
The workspace of the Asphalt Institute’83 overlay design program module is shown in Figure 1. It has four main parts for each FWD deflection data being analyzed, as described briefly hereinafter. The data and design results presented will be explained in detail later.
(a) Part 1 (left hand side – top) presents data table listing all FWD deflection data measured along the road link being evaluated. These FWD deflection data are already recorded in the data-base of program BackCalc.
(b) Part 2 (left hand side – middle) presents sub-data table listing FWD deflection bowl data for the FWD deflection data being pointed in the data table above. It also presents the corrected FWD deflection bowl data to the reference survey load of 41 KN, the best-fit deflection bowl data resulting from back calculation process on the corrected FWD deflection bowl data, and the estimated deflection bowl data after overlay. All four deflection bowl data are visualized in the graph shown underneath the sub-data table. (c) Part 3 (center) is the design panel showing both
the input data and the overlay design results arranged in accordance with the overlay design procedure described in the proposed analytical overlay design procedure.
(d) Part 4 (right hand side) visualizes the three-layered system structure model being analyzed plus the designed overlay thickness, together
with the pavement moduli resulting from back calculation process on the uncorrected FWD deflection data.
The Proposed Analytical Overlay Design Procedure
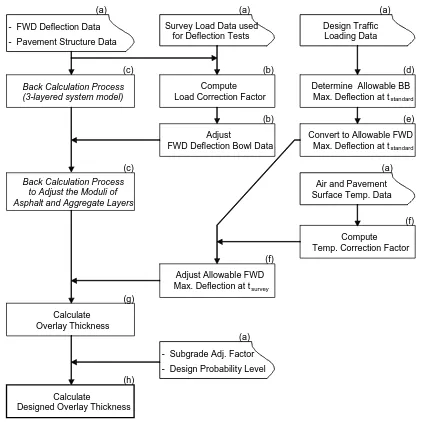
The analytical overlay design procedure proposed in conjunction with the program module presented earlier is shown in Figure 2. This design procedure can basically be grouped into 8 major components, as indicated in the figure.
(a) Input data (FWD deflection data, traffic loading data and design data)
(b) Load correction factor to adjust deflection bowl data to the reference survey load of 41 KN
(c) Back calculation process to be performed before and after applying load correction factor
(d) Deflection model to determine the allowable maximum Benkelman Beam (BB) deflection
(e) Conversion of the allowable maximum BB deflec-tion to the allowable maximum FWD deflecdeflec-tion (f) Temperature correction factor to adjust the
allowable maximum FWD deflection
(g) Overlay thickness calculation to reduce the measured maximum FWD deflection (after applying load correction factor) to the allowable maximum FWD deflection
(h) Designed overlay thickness calculation to take account of seasonal effects and variability in pavement conditions along the road link being evaluated.
The design procedure shows that temperature correction factor is applied only to adjust the allowable maximum FWD deflection at the standard temperature of 20oC to the allowable maximum
FWD deflection at the field survey temperature. This is intended to leave back calculation process be performed directly on the FWD deflection data
(a) (a) (a)
- FWD Deflection Data
- Pavement Structure Data
(c) (b) (d)
(b) (e)
(f)
- Subgrade Adj. Factor
- Design Probability Level Adjust Allowable FWD Max. Deflection at tsurvey
(f)
(a)
(a)
Design Traffic Loading Data
Adjust
FWD Deflection Bowl Data Survey Load Data used
for Deflection Tests
Back Calculation Process (3-layered system model)
Convert to Allowable FWD Max. Deflection at tstandard
Calculate
Designed Overlay Thickness Back Calculation Process
to Adjust the Moduli of Asphalt and Aggregate Layers
Determine Allowable BB Max. Deflection at tstandard
Calculate Overlay Thickness
(g)
(h)
Compute Load Correction Factor
Air and Pavement Surface Temp. Data
Compute Temp. Correction Factor (c)
= without correction for better accuracy. Even, load
correction factor should not be necessarily applied if FWD deflection survey is conducted at the reference survey load of 41 KN.
Furthermore, if this proposed analytical overlay design procedure is later accepted as a standard, the deflection model should be better expressed directly in the allowable maximum FWD deflection. There-fore, conversion from the allowable maximum BB deflection to the allowable maximum FWD deflection can be eliminated.
It should be clear at this point that the proposed analytical overlay design procedure is still dedicated only to analyze FWD deflection data. Yet, Benkel-man Beam apparatus is used more extensively in Indonesia. Therefore, it must be considered to include BB deflection data for future enhancement of the system.
Major Components of The Program Module
Input Data
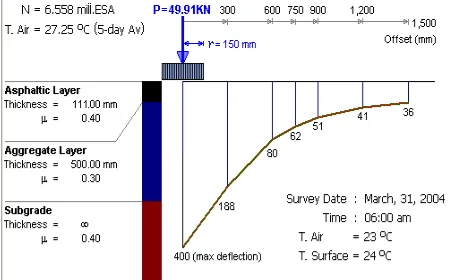
Input data used for an example consisting of FWD deflection data, traffic loading data and design data as presented in Figure 1 are reproduced here diagrammatically in Figure 3. These secondary data were collected from jalan Soekarno-Hatta, Bandung [11]. The survey was conducted four times in one day, average air temperature was calculated and treated as the 5-day average air temperature. Design traffic loading data for 5-year design life was obtained from Puslitbang Prasarana Transportasi [12]. Finally, Poisson ratio of each pavement layer is typical.
Fig. 3. Typical input data for overlay design based on the Asphalt Institute’83 method
Load Conversion Factor
Survey load used for FWD deflection measurement is an impact load, so that it usually varies slightly from the target reference survey load of 41 KN.
Since three FWD deflection readings are normally taken on every measurement point, it is therefore preferable to carry out FWD deflection measurement at survey load of 31, 41 and 51 KN, subsequently. Only the FWD deflection reading at survey load of 41 KN is analyzed further to calculate overlay thickness. The other two FWD deflection readings are used to calculate load correction factor. For small variation in survey load, the effect of survey load on maximum FWD deflection can then be expressed linearly by the following equation.
L
the reference survey load
dmax FWD, P = maximum FWD deflection (micron) at
In the example, the corrected maximum FWD deflection, dmax FWD, 41 = 534.08 micron. From the
previous study, it is known that survey load does not affect only the maximum FWD deflection, but also the FWD deflection bowl as a whole [1]. The equa-tion used is as follows:
In the example, the corrected FWD deflection bowl data is presented in column 3 of the sub-data table in Figure 1 and plotted in the graph therein. This corrected FWD deflection bowl data is then used in the back calculation process.
Back Calculation Process
Table 1. Back calculated pavement moduli without and with load conversion factor
Back Calculated Modulus (MPa), on:
No Pavement Layer FWD deflection bowl data
corrected FWD deflection bowl
data
1 Asphalt Layer 993.26 1,135.97
2 Aggregate Layer 167.90 167.90
3 Subgrade 167.90 167.90
Back calculation process on the corrected FWD deflection bowl data is performed by maintaining the subgrade modulus the same. Only asphalt layer modulus and aggregate layer modulus are changed. These resulting pavement moduli will then be used further to calculate overlay thickness. For checking purposes, the best-fit deflection bowl data is present-ed in column 4 of the sub-data table in Figure 1 and plotted in the graph therein. It can be seen that the best-fit deflection bowl curve matches quite closely against the corrected FWD deflection bowl curve.
Deflection Model
As cited by AASHTO [3], the California method of overlay design suggests that the allowable maxi-mum BB deflection is affected by asphalt layer thickness. Therefore, the Asphalt Institute’83 deflec-tion model may need to be slightly adjusted, as follows:
23422 . 0 20
,
, *22.59990*
max =f N−
d BBall oC DAI (3)
where: dmax BB, all, 20 o C = allowable maximum BB deflection
(mm) at standard temperature of 20oC
N = design traffic loading in Equiva-lent Standard Axles (ESA) fDAI = asphalt layer thickness
adjust-ment factor (default = 1.00)
For Indonesia, fDAI value still needs to be researched.
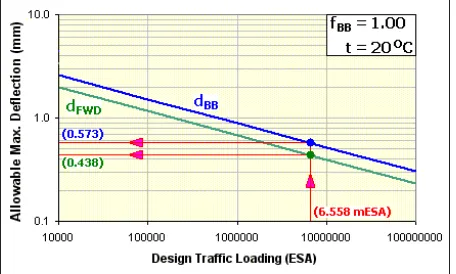
In the example, for N = 6.558 mESA, Eq. (3) gives dmax BB, all, 20 oC = 572.29 (micron). This is illustrated
further graphically in Figure 4.
BB to FWD Conversion Factor
Puslitbang Prasarana Transportasi [12] proposes to use the BB to FWD conversion factor (fBB) of 1.306,
such that:
dBB = 1.306 * dFWD (4)
where:
dBB = maximum BB deflection (mm)
dFWD = maximum FWD deflection (mm)
It must be noted that, for the proposed analytical overlay design procedure, Eq. (4) is applied on the allowable maximum BB deflection, instead of, on the maximum FWD deflection. In the example, Eq. (4) gives dmax FWD, all, 20oC = 438.20 (micron), as
illus-trated in Figure 4. Before being used for calculating overlay thickness, this dmax FWD, all, 20 oC value still
needs to be adjusted to the measured pavement temperature.
Temperature Correction Factor
Pavement temperature practically cannot be mea-sured. Therefore, it must be estimated through the measurement of pavement surface temperature and air temperature. The Asphalt Institute’83 method using the following two equations to determine tem-perature correction factor:
Average pavement temperature
(
s m b)
pavement t t t
t = * + +
3
1 (5)
where:
tpavement = average pavement temperature (oC)
ts = pavement surface temperature (oC) from
survey data
tm = pavement middle temperature (oC)
esti-mated from Figure 5
tb = pavement bottom temperature (oC)
esti-mated from Figure 5
This equation always gives lower in-depth pavement temperature. For tropical climate like in Indonesia, in-depth pavement temperature can be higher than pavement surface temperature in the afternoon [1]. Therefore, until further research becomes available, it is advisable to measure FWD deflection only in the morning. The values of tm and tb are determined
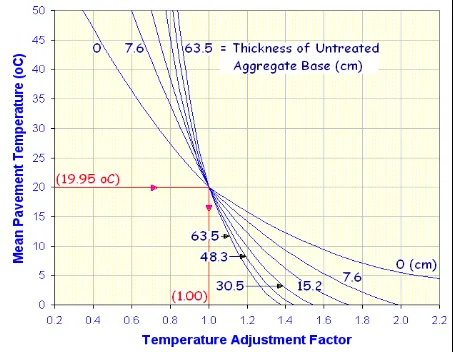
graphically from Figure 5. In the example, Figure 5 gives the tm and tb values of 18.72 (oC) and 17.13 (oC),
respectively. With ts value of 24 (oC), the average
pavement temperature is 19.95 (oC).
Corrected allowable maximum FWD deflection
Using the average pavement temperature calcu-lated earlier, temperature correction factor (ft) is
me-that will be more suitable for conditions in Indo-nesia is still to be investigated. The corrected allowable maximum FWD deflection is then calculated using the following equation:
t C all FWD t
all FWD
f d
d o
survey
20 , , ,
,
max
max = (6)
where:
dmax FWD, all, tsurvey= corrected allowable maximum FWD deflection (mm) at survey temperature
dmax FWD, all, 20 oC = corrected allowable maximum
FWD deflection (mm) at stan-dard temperature of 20oC
ft = temperature correction actor
In the example, for the average pavement tempera-ture of 19.95 (oC), Figure 6 gives temperature
correction factor of 1.00 for both methods.
Fig. 5. In-depth pavement temperature according to the Asphalt Institute’83 method
Fig. 6a.ft value according to Asphalt Institute’83 method
Fig. 6b. ft value according to AASHTO’93
Overlay Thickness Calculation
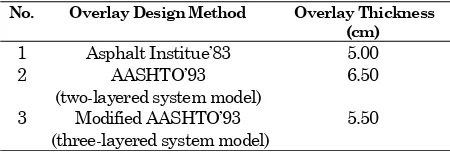
Overlay thickness is calculated using the pavement moduli resulting from back calculation process on the corrected FWD deflection bowl data at the measured pavement temperature. It is assumed here that the overlay modulus is the same as the back calculated asphalt layer modulus. The calcula-tion of overlay thickness is then performed by iteration until the calculated theoretical maximum deflection matches closely against dmax FWD, all, tsurvey value. In the example, the minimum overlay thick-ness required is 4.62 cm, which is rounded up to 5.00 cm. For information, the estimated deflection bowl data after overlay is presented in column 5 of the sub-data table in Figure 1 and plotted in the graph therein. Deflection bowl curve after overlay could be used as a reference for quality control during construction, but the effect of pavement temperature on the deflection bowl curve after overlay must be taken into account very carefully.
Table 2. Overlay thicknesses according to various design methods
No. Overlay Design Method Overlay Thickness (cm)
1 Asphalt Institue’83 5.00
2 AASHTO’93
(two-layered system model)
6.50
3 Modified AASHTO’93 (three-layered system model)
5.50
Designed Overlay Thickness Calculation
As mentioned earlier, the calculated minimum overlay thickness still needs to be adjusted to account for monthly variation, if any, in the subgrade modulus. Then, the designed overlay thickness is determined for each uniform segment within the road link being analyzed by applying probability level as specified in the design standard.
Conclusions and Recommendations
1. The proposed analytical overlay design procedure based on the allowable maximum deflection criterion specified by the Asphalt Institute’83 method is in principle practical. All necessary equations are available as outlined in the paper. Yet, more detailed research particularly on deflection model and temperature correction model may still be necessary.
2. The Asphalt Institute’83 method somewhat justifies the modified AASHTO’93 method of analytical overlay design for the three-layered system structure model. Yet, further verification of this finding on more data coverage is still required
3. It is recommended to investigate further the applicability of the proposed analytical overlay design procedure on BB deflection data.
References
1. Kosasih, D, Modifikasi Metoda AASHTO’93 dalam Disain Tebal Lapisan Tambahan untuk Model Struktur Sistem 3-Lapisan, to be publica-shed, Bandung, 2008.
2. The Asphalt Institute, Research and Development of the Asphalt Institute’s Thickness Design Manual (MS-1), Ninth Edition, RR-82-2, Mary-land, 1983, pp. 15-19.
3. AASHTO, AASHTO Guide for Design of Pave-ment Structures, Washington DC., 1993, pp. II-12 to II-15.
4. The Asphalt Institute, Computer Program DAMA–User’s Manual, CP-1, Maryland, 1983.
5. NAASRA, Pavement Design–A Guide to the Structural Design of Road Pavements, New South Wales, 1987.
6. Powell, W.D., Potter, J.F., Mayhew H.C., and Nunn, M.E., The Structural Design of Bitu-minous Roads, TRRL LR-1132, Department of Transport, Berkshire, 1984.
7. Rada, G.R., Richter, C.A., and Stephanos, P.J., Layer Moduli from Deflection Measurements: Software Selection and Development of SHRP’s Procedure for Flexible Pavements, TRR 1377, Washington DC., 1992.
8. Kosasih, D, Program BackCalc Help, Highway Engineering Laboratory, Department of Civil Engineering, ITB, Bandung, 2006.
9. The Asphalt Institute, Asphalt Overlays for Highway and Street Rehabilitation, MS-17, Maryland, 1983, pp. 38-40, 43-45, 135-138.
10. Irwin, L.H., Report of the Discussion Group on Practical Limitations and What Can Be Done To Overcome Them, TRR 1377, Washington DC., 1992.
11. Sianipar, S, Analisis Modulus Perkerasan Dengan Menggunakan FWD Akibat Pengaruh Temperatur dan Beban (Studi Kasus Jalan Soekarno-Hatta Bandung), MSc. Thesis in Trans-portation, Universitas Tarumanagara, Jakarta, 2004.