Synthesis of Fulvic Acid-Coated Magnetite (Fe
3O
4–FA) and Its Application
for the Reductive Adsorption of [AuCl
4]
–Philip Anggo Krisbiantoro, Sri Juari Santosa
*, and Eko Sri Kunarti
Department of Chemistry, Faculty of Mathematics and Natural Sciences, Universitas Gadjah Mada,Sekip Utara, Yogyakarta 55281, Indonesia
Received May 5, 2017; Accepted July 10, 2017
ABSTRACT
Fulvic acid-coated magnetite (Fe3O4–FA) has been synthesized through coprecipitation method using NH4OH.
Synthesis of Fe3O4-FA was conducted by cheap and environmentally friendly preparation used iron salts and
extracted fulvic acid (FA) from Peat soil of Rawa Pening, Central Java, Indonesia. Characterization using FT–IR indicated that the coating of FA on Fe3O4 occurred through the formation of chemical bond between iron of Fe3O4
and carboxyl group of FA. The XRD measurement indicated that coated Fe3O4successfully dispersed in smaller size
than uncoated Fe3O4, i.e. from 16.67 to 14.84 nm for Fe3O4and Fe3O4–FA, respectively. Synthesized Fe3O4–FA has
pHPZC6.37 and stable at pH > 3.0. The extracted FA has total acidity 866.61 cmol kg–1, –COOH content 229.77 cmol
kg–1and –OH content 636.84 cmol kg–1. Fe
3O4–FA has total acidity 494.86 cmol kg–1, –COOH content 67.80 cmol kg– 1and –OH content 427.06 cmol kg–1. The adsorption rate constant (k) of [AuCl
4]– on Fe3O4–A according to the Ho
kinetic model was 8006.53 g mol–1min–1. The adsorption capacity (q
max) according to Langmuir isotherm model was
1.24 × 10⁻⁴ mol g–1. The presence of reduction towards the adsorbed [AuCl
4]– was shown by the appearance of peaks at 2θ: 37.41; 43.66; 64.25, and 76.67° in the XRD diffractogram.
Keywords:magnetite; fulvic acid; gold; adsorption; reduction
ABSTRAK
Telah dilakukan sintesis magnetit terlapisi asam fulvat (Fe3O4–AF) dengan metode kopresipitasi menggunakan
NH4OH. Sintesis Fe3O4–AF telah dilakukan dengan menggunakan metode yang murah dan ramah lingkungan
menggunakan garam besi dan asam fulvat yang diekstraksi dari tanah gambut Rawa Pening, Jawa Tengah, Indonesia. Pelapisan Fe3O4oleh AF berhasil dilaksanakan berkat adanya ikatan antara besi pada Fe3O4dan gugus
karboksil pada FA sebagaimana ditunjukkan oleh spektra FT–IR. Karakterisasi dengan XRD menunjukkan bahwa Fe3O4 terlapis lebih terdispersi dan memiliki ukuran lebih kecil daripada Fe3O4 tanpa pelapisan, secara berurutan
ukuran Fe3O4 dan Fe3O4–AF adalah 16,67 dan 14,84 nm. Hasil penelitian menunjukkan bahwa Fe3O4–AF memiliki
nilai pHPZC6,37 dan stabil pada pH > 3,0. AF hasil ekstraksi memiliki keasaman total 866,61 cmol kg–1, kandungan
gugus –COOH total 229,77 cmol kg–1 dan kandungan gugus –OH total 636,84 cmol kg–1. Fe
3O4–AF memiliki
keasaman total 494,86 cmol kg–1, kandungan gugus –COOH total 67,80 cmol kg–1dan kandungan gugus –OH total
427,06 cmol kg–1. Konstanta laju reaksi (k) dengan model kinetika Ho adalah 8006,53 g mol–1 menit–1. Kapasitas
adsorpsi (qmax) dengan model isoterm Langmuir adalah 1,24 × 10⁻⁴ mol g–1. Logam Au hasil reduksi ditunjukkan dengan munculnya puncak 2θ: 37,41; 43,66; 64,25 dan 76,67° pada difraktogram XRD.
Kata Kunci:magnetit; asam fulvat; emas; adsorpsi; reduksi
INTRODUCTION
In recent years, large attention has been given to non-cyanide and mercury methods for gold recovery [1-6]. Non health threatening alternative approaches has widely been conducted by scientists [7], yet in comparison with cyanidation [8-11], most of alternative approaches are still uneconomical.
In the past decade, the synthesis of paramagnetic nanoparticles has been intensively developed, not only for scientific interest, but also for many technological
applications [12-13]. Especially in the field of adsorption, the dramatic increase on the use of magnetite as adsorbent for metal cations in waste water was observed [14-15]. However, magnetite is easily aggregated in aqueous solution and oxidized by free atmosphere [16]. Hence, surface modification is importantly needed to enhance the stability of magnetite nanoparticle [17].
stability of nano dispersion of Fe3O4 particles by preventing their aggregation [25-27]. This surface modification of Fe3O4 by FA (Fe3O4–FA) increases adsorption capacity and easily separated from aqueous medium [25-27].
In this study, due to its highest total acidity which is highest than the other fractions of humic substances, FA is chosen to coat Fe3O4 and the formed Fe3O4–FA is then applied to adsorp [AuCl4]– in aqueous solution [28]. Skogerboe and Wilson [28] reported that fulvic acid had reduction potential approximately 0.5 V (vs normal hydrogen electrode), while the reduction potential of [AuCl4]– is 0.1 V. Its means, reduction of [AuCl4]– into Au(0) occur spontaneously. Higher total acidity needed in purpose to increase Fe3O4 stability. Fe3O4–FA synthesized through coprecipitation method and characterized using FT–IR and XRD. Measurement of pHPZC, Fe3O4 stability and total acidity were also investigated.
EXPERIMENTAL SECTION
Materials
Peat soil from Rawa Pening, analytical grade of NaOH, HCl 37%, Ba(OH)2, NH4OH 25%, FeCl3•6H2O, FeSO4•7H2O, Ca(CH3COO)2, NaNO3, HNO3, NaHCO3, [AuCl4]–, standard solution of Fe, were obtained from Merck (Germany) without further purification, distilled water from general laboratory of Chemistry Department (Universitas Gadjah Mada), and N2gas.
Instrumentation
Stirrer and hot plate (Nouva), analytical balance (Mettler Toledo AL204), centrifuge (K PLC series), electric pH-meter (Hanna Instrument 211), oven (Fischer Scientific model 655F), siever 100 and 200 mesh, external magnetic field, shaker. Analytical instrumentals include infra-red spectrometer (Shimadzu FT–IR Prestige 21), atomic spectrometer (Perkin Elmer 3110),
centrifuged at 4500 rpm for 30 min. After filtration, supernatant was added by HCl 6 M dropwise until pH 1 and followed by centrifugation at 4500 rpm for 30 min to precipitate HA. After separated from the precipitation, the supernatant was dried at 60 °C to solidify FA.
Synthesis of Fe3O4–FA
Fe3O4–FA was synthesized with modified method from Ref. [30-31]. Briefly, FeSO4.7H2O (2.78 g) and FeCl3.6H2O (5.41 g) were dissolved in a 100 mL of distilled water. A 10 mL of NH4OH 25% (v/v) and 1.0 g of FA were added into the mixed of Fe2+/Fe3+ solution at 90 °C under stirring, respectively. After aged for 30 min, the mixed solution was filtered and the separated solid was washed by distilled water until neutral pH and then dried at 60 °C to obtain Fe3O4–FA.
Determination of pHPZC. Fe3O4–FA (10 mg) was
added into 10 mL of NaNO3 0.01 M at various pH ranging from 2-12 by the addition of HNO3 0.1 M or NaOH 0.1 M. The mixtures were shaken for 2 h and aged for 2 days. The filtrate was separated from solid by filtering using 0.45 µm paper and then final pH was measured.
Stability test. Fe3O4–FA (10 mg) was added into
10 mL of distilled water at various pH ranging from 2-8 by addition of HCl 0.1 M or NaOH 0.1 M. The filtrate was separated from solid by filtering using 0.45 µm paper and then was analyzed its Fe content with AAS.
Adsorption of [AuCl4]–
The effect of pH.Fe3O4–FA (10 mg) was added into a series of 10 mL of [AuCl4]– solution 60 ppm at varies from 2 to 7. The mixture was shaken for 2 h and then the filtrate was separated by filtering using 0.45 µm paper and followed by analysis for the remaining [AuCl4]–content with AAS.
Sorption kinetics. Fe3O4–FA (10 mg) was added into
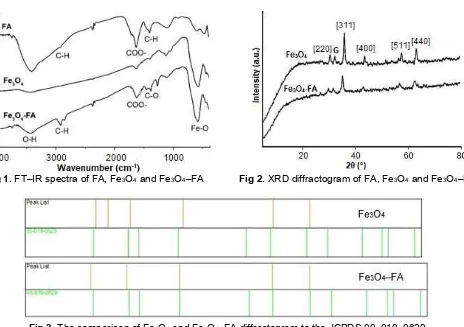
Fig 1.FT–IR spectra of FA, Fe3O4and Fe3O4–FA Fig 2.XRD diffractogram of FA, Fe3O4and Fe3O4–FA
Fig 3.The comparison of Fe3O4and Fe3O4–FA diffractogram to the JCPDS 00–019–0629
Table 1. Size distribution and % crystallinity of Fe3O4 and Fe3O4–FA
Material d311(nm) % crystallinity
Fe3O4 16.67 100
Fe3O4–FA 14.84 62.22
0.45 µm filter paper, the filtrate was analyzed for its [AuCl4]–content by using AAS.
Sorption isotherm. Fe3O4–FA (10 mg) was added into
a series of 10 mL of [AuCl4]– solution at various concentrations ranging from 5 to 250 ppm at optimum pH. The mixture was filtered using 0.45 µm filter paper and the filtrate was analyzed its [AuCl4]– content by using AAS.
RESULT AND DISCUSSION
Characterization of Adsorbent
FT-IR spectroscopy
Spectroscopic analysis showed the success of FA extraction from peat soil and coating onto Fe3O4surface. As shown in Fig. 1, the IR spectra of FA possesses main absorption bands at 3410 cm–1 for O-H stretching, 2931 cm–1for stretching of C–H aliphatic, 1635 cm–1for stretching of C=C aromatic and C=O carboxylic, and
1404 cm–1 for the deformation of C–H aliphatic. This spectra of FA matched well with the obtained spectra of FA extracted form latosol soil by Jayaganesh and Senthurpandian [29]. The IR spectra of Fe3O4–FA displayed the main absorption bands at 1381 cm–1 which was correspond to C=O stretching of Fe3O4–FA, indicating the carboxylate anion in interaction with FeO surface, as the C=O in free carboxylic acid was above 1700 cm–1[25-27,30-31].
X-ray diffraction
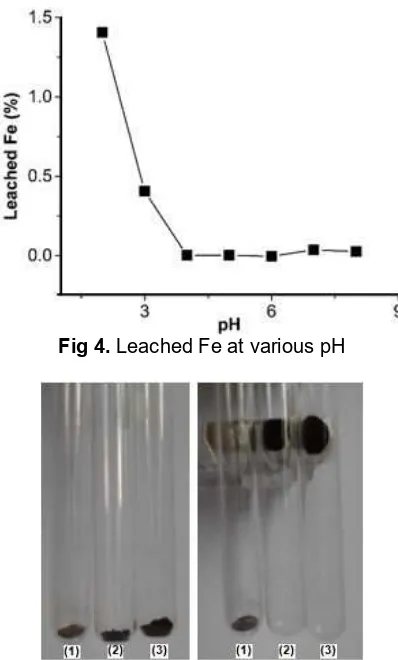
Fig 4.Leached Fe at various pH Fig 5.The pHPZCmeasurement
Fig 6.Qualitative magnetic properties test of fulvic acid (1); Fe3O4(2) and Fe3O4–FA (3)
Table 2.Functional groups of FA and Fe3O4–FA
Functional groups
Stevenson (cmol kg–1)
FA (cmol kg–1)
Fe3O4–FA
(cmol kg–1)
Total acidity 570–890 866.61 494.86
–COOH 150–570 229.77 67.80
–OH 150–400 636.84 427.06
was also measured to compare the bare Fe3O4 and modified Fe3O4. By divided wide fraction of bare Fe3O4 and Fe3O4–FA, % crystallinity also can be determined, which FA decrease the % crystallinity of Fe3O4.
Functional groups of FA and Fe3O4–FA
The determination of total acidity and carboxyl content were carried out using Ba(OH)2 and Ca–acetate method [34]. Table 2 shows that the functional groups of FA agreed well with Stevenson [34] and were decreased after coating the surface of Fe3O4, indicated that some of –COOH and –OH were used for bonding with Fe3O4 surface.
Stability test of Fe3O4–FA
Stability of Fe3O4–FA towards dissolution increased sharply from 2.0 to 4.0. At pH 2.0, Fe3O4leached in the
solution was only 1.40% (2.51 × 10⁻⁵mol g–1) relative toward weight of the adsorbent (Fig. 4). At low pH, Fe2+ leached from adsorbent and form [Fe(H2O)6]2+ in the solution and detected as leached Fe by AAS. Meanwhile, the Fe3O4 that loses Fe2+ form maghemite (γ–Fe2O3) which has less magnetic properties instead of Fe3O4 [35]. The stability of Fe3O4 has high responsibility of the optimum pH of the adsorption process, which there is no possibility of the adsorbent could optimum at very low pH due to adsorbent stability. This concluded that Fe3O4–FA stable at pH > 3.0.
Determination of pHPZCValue of Fe3O4–FA
The pHPZCis a measurement of H+ion movement onto and from the adsorbent surface [36]. The change of medium pH after aging adsorbent for 48 h is shown in Fig. 5. At low pH, H+ ions were moving from the solution onto adsorbent surface during aging and increase the pH of the solution. At high pH, H+ ions were moving from the adsorbent to the solution and decrease the pH of the solution. The meet point of initial and final pH mean that there is no movement of H+ions and the adsorbent is about at neutral condition. The medium pH in which the H+ ions do not move between adsorbent and its medium is called as pHPZC and as shown in Fig. 5, the pHPZCobtained in this study is 6.37. This pHPZC of Fe3O4–FA is smaller than that of bare Fe3O4, i.e. 8.2 as reported by El-Kharrag [14]. It may be caused by the fact that Fe3O4–FA contains carboxyl groups that the bare Fe3O4.
Qualitative Analysis of Magnetic Properties
Fig 7.The effect of pH on adsorption of [AuCl4]–
Fig 8. The effect of contact time on the adsorption of
[AuCl4]–
attracted by magnet. It means that only Fe3O4 and Fe3O4–FA have magnetic property. Attracted Fe3O4–FA into external magnetic field indicated that coating of FA onto Fe3O4 surface was not remove the magnetic properties of Fe3O4.
Sorption Process
Effect of the medium acidity on the adsorption of [AuCl4]–
The effect of the medium acidity on the adsorption of [AuCl4]– on Fe3O4–FA is given in Fig. 7. At very low pH (< 3.0), adsorbent system practically has less stability instead of pH > 3.0. This means, with the decreasing pH from 3.0 to 2.0 lead to less percentage of adsorbed [AuCl4]–. At pH 4.0, fulvic acid protonated (–COOH) and lead to the complete adsorption with the negative species of [AuCl4]– through hydrogen bonding. By increasing pH after 4.0, more functional groups of fulvic acid are deprotonated and more functional groups are negatively charged. This lead to the repulsion of negatively charged FA and [AuCl4]–, causing the percentage of adsorbed [AuCl4]– decreased with the increasing pH.
Adsorption rate
The adsorption profile of [AuCl4]– on Fe3O4–FA as a function of interaction time is given in Fig. 8. The adsorption was initial rapid at first 90 min and then went slower. Based on the assumption that carboxyl group of fulvic acid is the responsible functional group for the binding with [AuCl4]–, the unit of adsorbed [AuCl4]–in Fig. 8 has been converted from its original unit to mole unit based on the content of that carboxyl functional group. Among functional groups of FA, carboxyl plays important role to binding with [AuCl4]– through electrostatic interaction. The determination of carboxyl content in FA
used in this study using Ca–acetate method (Table 2) yielded the value of 6.78 mmol g–1.
The determination of rate constant reveal that the sorption of [AuCl4]– on Fe3O4–FA obeys Ho’s kinetic model as expressed in equation 1 [37].
2 t ads e e
t 1 1
t
q k q q (1)
where qe and qt are the concentration (mol g–1) of adsorbate at equilibrium and t, respectively. kads is the Ho rate constant of adsorption (g mol–1 min–1) and t is interaction time.
Plot of t/qt against t from the data Fig. 8 gave a linier relationship with linearity (R2) as high as 0.9983. Based on the slope of the plot, the obtained kadswas 8 × 10³g mol–1min–1.
Adsorption capacity and energy
The adsorption profile of [AuCl4]–on Fe3O4–FA as a function of concentrations time is given in Fig. 9. The adsorption was rapid at initial concentration from 0 to 60 mg L–1. The adsorption then increased slightly when the applied concentration of [AuCl4]– was between 60 and 250 mg L–1.The plot of Ce/qeagainst Cefitted to the linear form of Langmuir adsorption model as expressed in equation 2 [26].
e
e m m
C 1 1
q q Kq (2)
where qm is the adsorption capacity corresponding to complete monolayer coverage and K is the equilibrium constant (L mol–1). The data fit well to the model with correlation coefficients (R2) 0.9837, and the adsorption capacity of 1.24 × 10⁻⁴mol g–1for [AuCl4]–.
Fig 9. Relationship between adsorbed [AuCl4]– and the remaining concentration of [AuCl4]– in the solution at equilibrium (left), and linear form of Langmuir equation of adsorption of [AuCl4]–on Fe3O4–FA (right)
of [AuCl4]–. There is a possibility that carboxyl group is the responsible functional group for the binding of [AuCl4]–, while the content of –COOH on Fe3O4–FA used in this study was 67.8 cmol kg–1 and equivalent to 6.78 mmol g–1. This means, the adsorption capacity of Fe3O4– FA in adsorbing [AuCl4]– as high as 1.24 × 10⁻⁴mol g–1 will be equivalent to 0.124 mmol g–1.
The value of equilibrium constant (K) can be determined from the intercept of plot Ce/qe against Ce. The calculation showed that the value of K was 6.03 × 10⁴ L mol–1. According to the equation
ads ads
E G RT lnK [38], the adsorption energy obtained is 27.27 kJ mol–1.
Confirmation of the presence of reductive
adsorption
FT–IR spectra confirmed that –COOH group was involved on the adsorption of [AuCl4]–. Before adsorption, Fe3O4–FA shown main absorption bands originated from FA at 1627 cm–1. Absorption band at 1627 cm–1 was characteristic for stretching of aromatic C=C and stretching of C=O in COO–[39].
After the adsorption of [AuCl4]–, the intensity of the band at 1627 cm–1significantly increase, this might due to the formation of C=O of Ar=O as the result of the oxidation of phenolic group used for reducing [AuCl4]–. Moreover, the intensity of the band at 3400 cm–1 was decreased and might due to H atom of phenolic group had been released during the for reduction of [AuCl4]–. The result of FT-IR agreed well with Hamamoto [35] that –OH of phenolic group has ability to reduce gold ion into gold metal as explained in the reaction below [40].
– 0 –4
AuCl 3ArOHAu 3ArO 3H 4Cl
XRD patterns of Fe3O4–FA after adsorption confirm the presence of Au(0) through the appearance of peaks at 2θ: 37.41°; 43.66°; 64.25° and 76.67° that refers to face
Table 3. Medium acidity before and after
adsorption-reduction process
pH
Before After
1.98 2.18
2.51 2.61
3.01 2.98
3.50 3.30
3.94 3.53
4.92 4.21
6.05 4.75
6.56 5.75
7.01 6.15
centered cubic crystal. Based on the reaction (1), can be explained that to reduce 1.0 mole of [AuCl4]–, 3 moles of H+ from phenolic groups are needed. This also means that the reduction of 1.0 mole [AuCl4]– will produce 3 moles of Ar=O and H+. If it is assumed that gold is produced from the adsorbed [AuCl4]– by carboxyl group (0.124 mmol g–1), it was needed 0.369 mmol g–1 (three times of adsorbed [AuCl4]–) of –OH content to reduce the adsorbed [AuCl4]–on Fe3O4–FA.
The released H+ increases the acidity of the medium as the result of reduction process. Table 3 confirm the decreasing pH after reductive adsorption process of [AuCl4]–into Au(0).
CONCLUSION
stability and positively charged. Sorption reached the equilibrium in 5 h and agreed well to Ho’s kinetic model with rate constant (k) 8.0 × 10³ g mol–1 min–1 and followed Langmuir adsorption model with adsorption capacity 1.24 × 10⁻⁴mol g–1.
ACKNOWLEDGEMENT
This study was supported by Bidikmisi Scholarship from Ministry of Education and Culure, Republic of Indonesia for the first author and Penelitian Tim Pascasarjana2017, No. 2542/UN1.P.III/DIT-LIT/LT/2017 date April 19, 2017. This paper was dedicated to the late of Prof. Dr. Narsito of Chemistry Department, Universitas Gadjah Mada, for the supervision that enabling the first author to finish his Bachelor Degree.
REFERENCES
[1] Birloaga, I., De Michelis, I., Ferella, F., Buzatu, M., and Vegliò, F., 2013, Study on the influence of various factors in the hydrometallurgical processing of waste printed circuit boards for copper and gold recovery,Waste Manage., 33 (4), 935–941.
[2] Kotte, P., and Yun, Y.S., 2014, L-cysteine impregnated alginate capsules as a sorbent for gold recovery,Polym. Degrad. Stab., 109, 424–429. [3] Li, H., Wang, X., Cao, L., Zhang, X., and Yang, C.,
2015, Gold-recovery PVDF membrane functionalized with thiosemicarbazide, Chem. Eng. J., 280, 399–408.
[4] Aylmore, M.G., and Muir, D.M., 2001, Thiosulfate leaching of gold: A review,Miner. Eng., 14 (2), 135– 174.
[5] Pangeni, B., Paudyal, H., Abe, M., Inoue, K., Kawakita, H., Ohto, K., Adhikaria, B.B., and Alam, S., 2012, Selective recovery of gold using some cross-linked polysaccharide gels,Green Chem., 14, 1917–1927.
[6] Villalobos, L.F., Yapici, T., and Peinemann, K.V., 2014, Poly-thiosemicarbazide membrane for gold recovery,Sep. Purif. Technol., 136, 94–104.
[7] Syed, S., 2012, Recovery of gold from secondary sources-A review, Hydrometallurgy, 115-116, 30– 51.
[8] Botz, M.M., Mudder, T.I., and Akcil, A., 2005, “Cyanide Treatment: Physical, Chemical and Biological Processes” in Advances in Gold Ore Processing, Adams, M., ed., Elsevier Ltd., Amsterdam, 672–700.
[9] Fricker, A.G., 1993, Recovery of cyanide in the extraction of gold,J. Cleaner Prod., 1 (2), 77–80. [10] Mudder, T.I., and Botz, M.M., 2004, Cyanide and
society: A critical reviews, Eur. J. Miner. Process. Environ. Prot., 4 (1), 62–74.
[11] Yap, C.Y., and Mohamed, N., 2007, An electro-generative process for the recovery of gold from cyanide solutions, Chemosphere, 67 (8), 1502– 1510.
[12] El Ghandoor, H., Zidan, H.M., Khalil, M.M.H., and Ismail, M.I.M., 2012, Synthesis and some physical properties of magnetite (Fe3O4) nanoparticles, Int. J. Electrochem. Sci., 7, 5734–5745.
[13] Sun, J., Zhou, S., Hou, P., Yang, Y., Weng, J., Li, X., and Li, M., 2006, Synthesis and characterization of biocompatible Fe3O4 nanoparticles, J. Biomed. Mater. Res. Part A, 80 (2), 333–341.
[14] El-kharrag, R., Amin, A., and Greish, Y.E., 2011, Low temperature synthesis of monolithic mesoporous magnetite nanoparticles,Ceram. Int., 38 (1), 627–634.
[15] Lim, S.H., Woo, E.J., Lee, H., and Lee, C.H., 2008, Synthesis of magnetite-mesoporous silica composites as adsorbents for desulfurization from natural gas,Appl. Catal., B, 85 (1-2), 71–76. [16] Maity, D., and Agrawal, D.C., 2007, Synthesis of
iron oxide nanoparticles under oxidizing environment and their stabilization in aqueous and non-aqueous media, J. Magn. Magn. Mater., 308 (1), 46–55.
[17] Zhang, L., He, R., and Gu, H.C., 2006, Oleic acid coating on the monodisperse magnetite nanoparticles, Appl. Surf. Sci., 253 (5), 2611– 2617.
[18] Tan, K.H., 1998, Principle of Soil Chemistry, Marcel Dekker, New York.
[19] Buhani, and Suharso, 2006, The influence of pH towards multiple metal ion adsorption of Cu(II), Zn(II), Mn(II), and Fe(II) on humic acid,Indones. J. Chem., 6 (1), 43–46.
[20] Narsito, Santosa, S.J., and Lastuti, S., 2008, Photo-reduction kinetics of MnO2 in aquatic environments containing humic acids, Indones. J. Chem., 8 (1), 37–41.
[21] Nurmasari, R., Santosa, U.T., Umaningrum, D., and Rohman, T., 2010, Immobilization of humic acid on chitosan beads by protected cross-linking method and its application as sorbent for Pb(II), Indones. J. Chem., 10 (1), 88–95.
[22] Santosa, U.T., Mustikasaria, K., Santosa, S.J., and Siswanta, D., 2007, Study of sensitization of fulvic acid on photoreduction of Cr(VI) to Cr(III) by TiO2 photocatalyst,Indones. J. Chem., 7 (1), 25–31. [23] Umaningrum, D., Santosa, U.T., Nurmasari, R.,
the adsorption of humic acid on magnetite,Colloids Surf., A, 230 (1-3), 99–109.
[27] Illés, E., and Tombácz, E., 2006, The effect of humic acid adsorption on pH-dependent surface charging and aggregation of magnetite nanoparticles, J. Colloid Interface Sci., 295 (1), 115–123.
[28] Skogerboe, R.K., and Wilson, S.A., 1981, Reduction of ionic species by fulvic acid, Anal. Chem., 53 (2), 228–232.
[29] Jayaganesh, S., and Senthurpandian, V.K., 2010, Extraction and characterization of humic and fulvic acids from latosols under tea cultivation in South India,Asian J. Earth. Sci., 3 (3), 130–135.
[30] Liu, J.F., Zhao, Z.S., and Hang, G.B., 2008, Coating Fe3O4 magnetic nanoparticles with humic acid for high efficient removal of heavy metals in water, Environ. Sci. Technol., 42 (18), 6949–6954.
[31] Peng, L., Qin, P., Lei, M., Zeng, Q., Song, H., Yang, J., Shao, J., Liao, B., and Gu, J., 2012, Modifying Fe3O4 nanoparticles with humic acid for removal of Rhodamine B in water, J. Hazard. Mater., 209-210, 193–198.
[32] Niu, H., Zhang, D., Zhang, S., Zhang, X., Meng, Z., and Cai, Y., 2011, Humic acid coated Fe3O4
stabilization, vectorization, physic chemical characterizations and biological applications, Chem. Rev., 108 (6), 2064–2110.
[36] Hasnah, S.D., and Ridwan, 2012, Sintesis dan Karakterisasi Nanopartikel Fe3O4 Magnetik untuk Adsorpsi Kromium Heksavalen, JUSAMI, 13 (2), 136–140.
[37] Ho, Y.S., 2006, Review of second-order models for adsorption systems,J. Hazard. Mater., 136 (3), 681–689.
[38] Santosa, S.J., Sudiono, S., and Shiddiq, Z., 2007, Effective humic acid removal using Zn/Al layered double hydroxide anionic clay,J. Ion Exchange, 18 (4), 322–327.
[39] Santosa, S.J., Siswanta, D., Sudiono, S., and Utarianingrum, R., 2008, Chitin-humic acid hybrid as adsorbent for Cr(III) in effluent of tannery wastewater treatment, Appl. Surf. Sci., 254 (23), 7846–7850.
![Fig 7. The effect of pH on adsorption of [AuCl4]–](https://thumb-ap.123doks.com/thumbv2/123dok/3661628.1467621/5.595.342.538.112.274/fig-effect-ph-adsorption-aucl.webp)
![Fig 9. Relationship between adsorbed [AuClequilibrium (left), and linear form of Langmuir equation of adsorption of [AuCl4]– and the remaining concentration of [AuCl4]– in the solution at4]– on Fe3O4–FA (right)](https://thumb-ap.123doks.com/thumbv2/123dok/3661628.1467621/6.595.371.510.348.463/relationship-adsorbed-auclequilibrium-langmuir-adsorption-remaining-concentration-solution.webp)
![SYNTHESIS, CHARACTERIZATION AND ADSORPTION TEST OF POLY-TETRA- p -PROPENYLTETRAHYDROXYCALIX[4]ARENE FOR CADMIUM ION | Kusumaningsih | Indonesian Journal of Chemistry 21408 40494 1 PB](data:image/gif;base64,R0lGODlhAQABAIAAAP///wAAACH5BAEAAAAALAAAAAABAAEAAAICRAEAOw==)