Venue:
Discovery
Kartika Plaza
Hotel
Jl K
ik Pl
Publisher:
LPPM
Universitas Surabaya
G d
P
k
l 4
Jl.
Kartika Plaza
Kuta,
Bali
80361
Phone
+62
361
751
067
Fax. +62
361 754
585
www.discoverykartikaplaza.com
Gedung Perpustakaan lt.
4
Universitas Surabaya
Jalan Raya
Kalirungkut,
Surabaya
‐
Indonesia
60297
www.lppm.ubaya.ac.id
Rector of University of Surabaya: Prof Dr Joniarto Parung
PREFACE
WELCOME NOTE FROM INCITE 2017 ORGANIZING COMMITTEE CHAIRMAN
Rector of University of Surabaya: Prof. Dr. Joniarto Parung,
Dean of Faculty of Engineering, University of Surabaya: Dr. Amelia Santoso,
Honorary Keynote Speakers: Prof. Dr. Suksun Horpibulsuk, Prof. Dr. Nai‐Wei Lo, Prof. Dr. Mats
Rönnelid, and Prof. Dr. Willy Susilo,
Fellow Participants, Distinguished Guests, Ladies and Gentlemen:
First of all, welcome to Bali, Indonesia, and welcome to the first International Conference on Informatics, Technology and Engineering (InCITE) 2017!, gy g g ( )
It is still vivid in my memory, one and a half year ago, when some colleagues and officials of our Faculty of Engineering discussed the possibility of organizing an international event, to substitute national seminars that some of our study programs held annually or bi‐annually. The call for an international event is a necessity given 30 years of Faculty of Engineering’s existence, and the dawn of University of Surabaya’s Silver Anniversary next year. Such a level of maturity prompts us to contribute more to a larger scale. An international event will have greater exposure to international community, and consequently greater impact to us all.
The following process, however, was far from easy. We were inexperienced, but we were faithful to our mission. It took us some time until we were able to formulate the conference theme, found prominent scholars in the selected theme, and negotiated with them. We are very grateful that all four speakers whom we approached are here with us today, to deliver their insights on opportunities and challenges in sustainable technology and innovation. Let’s give our big hands to them!
them!
Sessions beyond those with our invited speakers will deliver four sub‐themes, namely:sustainable design & innovation,sustainable manufacturing & processes,sustainable energy & earth resources, and the role of IT in sustainable enterprise. We are glad to inform you that our conference has attracted 67 papers from the first round of acceptance. After careful selection by a panel that consists of high‐profile international reviewers around the world, we passed 50 papers. We are thankful to our international reviewers who worked very hard providing feedback to the submitted papers. We are indebted to such great service that they have given.
I sincerely hope that the exchange of knowledge throughout this event, be it from within the substance of academic papers or during the conference time, will enhance our professional network and benefit us in the long run. Thank you to all our speakers, reviewers, participants, and most of all
my committee members who have been hand‐in‐hand with me in this long journey! You all have
made our dream come true!
We hope you will have a wonderful conference and memorable stay in Bali thisweek. We are looking forward to seeing you again in the next two years!
The conference organisers would like to thank the following names who will serve as the:
CONFERENCE ORGANIZER
SCIENTIFIC COMMITTEE
Assoc. Prof. Azharul Karim, Ph.D. (Queensland University of Technology, AUSTRALIA) Prof. Dinesh Kant Kumar, Ph.D. (Royal Melbourne Institute of Technology, AUSTRALIA) Prof. Willy Susilo, Ph.D. (University of Wollongong, AUSTRALIA)
Assoc. Prof. Yassierli, Ph.D. (Institut Teknologi Bandung, INDONESIA) Prof. Ali Altway, Ph.D. (Institut Teknologi Sepuluh Nopember, INDONESIA)
Prof. Dr‐Ing. I Made Londen Batan (Institut Teknologi Sepuluh Nopember, INDONESIA)
A P f S ti G Ph D (I tit t T k l i S l h N b INDONESIA)
Assoc. Prof. Setiyo Gunawan, Ph.D. (Institut Teknologi Sepuluh Nopember, INDONESIA) Prof. Renanto Handogo, Ph.D. (Institut Teknologi Sepuluh Nopember, INDONESIA) Prof. Mauridhi Hery Purnomo, Ph.D. (Institut Teknologi Sepuluh Nopember, INDONESIA) Prof. Nur Iriawan, Ph.D. (Institut Teknologi Sepuluh Nopember, INDONESIA)
Prof. I Nyoman Pujawan, Ph.D. (Institut Teknologi Sepuluh Nopember, INDONESIA) Asst. Prof. Budi Hartono, Ph.D. (Universitas Gadjah Mada, INDONESIA)
Asst. Prof. Hanung Adi Nugroho, Ph.D. (Universitas Gadjah Mada, INDONESIA) Asst. Prof. Dr.rer.nat. Lanny Sapei (Universitas Surabaya, INDONESIA)
Asst. Prof. Dr.rer.nat. Lanny Sapei (Universitas Surabaya, INDONESIA) Asst. Prof. Nemuel Daniel Pah, Ph.D. (Universitas Surabaya, INDONESIA) Prof. Joniarto Parung, Ph.D. (Universitas Surabaya, INDONESIA)
Prof. Lieke Riadi, Ph.D. (Universitas Surabaya, INDONESIA) Prof. Katsuhiko Takahashi, Ph.D. (Hiroshima University, JAPAN) Asst. Prof. Dr.Eng. Wahyudiono (Nagoya University, JAPAN)
Prof. Anton Satria Prabuwono, Ph.D. (King Abdulaziz University, KINGDOM OF SAUDI ARABIA) Assoc. Prof. Oki Muraza, Ph.D. (King Fahd University of Petroleum & Minerals, KINGDOM OF SAUDI ARABIA)
Assoc. Prof. Azizi Abdullah, Ph.D. (Universiti Kebangsaan Malaysia, MALAYSIA)
Assoc. Prof. Siti Norul Huda Sheikh Abdullah, Ph.D. (Universiti Kebangsaan Malaysia, MALAYSIA) Assoc. Prof. Md. Jan Nordin, Ph.D. (Universiti Kebangsaan Malaysia, MALAYSIA)
Assoc. Prof. Mohammad Faidzul Nasrudin, Ph.D. (Universiti Kebangsaan Malaysia, MALAYSIA) Assoc. Prof. Rosmadi Fauzi, Ph.D. (University of Malaya, MALAYSIA)
Assoc. Prof. Md. Nasir Sulaiman, Ph.D. (Universiti Putra Malaysia, MALAYSIA)
Prof Ravindra S Goonetilleke Ph D (Hong Kong University of Science & Technology PRC) Prof. Ravindra S. Goonetilleke, Ph.D. (Hong Kong University of Science & Technology, PRC) Assoc. Prof. Tan Kay Chuan, Ph.D. (National University of Singapore, SINGAPORE)
Asst. Prof. Aldy Gunawan, Ph.D. (Singapore Management University, SINGAPORE) Asst. Prof. Hendry Raharjo, Ph.D. (Chalmers University of Technology, SWEDEN)
Assoc. Prof. Waree Kongprawechnon, Ph.D. (Sirindhorn International Institute of Technology, THAILAND)
STEERING COMMITTEE
CONFERENCE ORGANIZER
Chair : Assoc. Prof. Markus Hartono, Ph.D., CHFP
Honorary Members : Prof. Suksun Horpibulsuk, Ph.D.
Prof. Nai‐Wei Lo, Ph.D. Prof. Mats Rönnelid, Ph.D. Prof. Willy Susilo, Ph.D.
Members : Assoc. Prof. Amelia Santoso, Ph.D.
A t P f Dj i Ph D
Asst. Prof. Djuwari, Ph.D. Mr. Agung Prayitno
Assoc. Prof. Emma Savitri, Ph.D. Assoc. Prof. Budi Hartanto, Ph.D. Mr. Sunardi Tjandra
Asst. Prof. Nemuel Daniel Pah, Ph.D. Assoc. Prof. Elieser Tarigan, Ph.D. Assoc. Prof. Jaya Suteja, Ph.D. Assoc. Prof. Jaya Suteja, Ph.D. Asst. Prof. Dr.rer.nat. Lanny Sapei Prof. Joniarto Parung, Ph.D.
Assoc. Prof. Hudiyo Firmanto, Ph.D. Assoc. Prof. Restu Kartiko Widi, Ph.D.
ORGANIZING COMMITTEE
Chair : Assoc. Prof. Eric Wibisono, Ph.D.
Secretary : Assoc. Prof. Rudy Agustriyanto, Ph.D.
Treasurers : Ms. Dhiani Tresna Absari
Ms. Arum Soesanti
Secretariat : Mr. Rahman Dwi Wahyudi
Ms. Yuana Elly Agustin Ms. Akbarningrum Fatmawati Ms. Yenny Sari
vi
Table of Content
Preface ...
i
Conference Organizer ...
ii
Table Of Content ...
iv
A. Sustainable Design Innovation
Loyalty Program for Local Tourism in Kediri Residency
M Meisa, I Hapsari, M A Hadiyat ... A-1
Affecive Design Identification on Development of Batik Convection
Product
H Prastawa, R Purwaningsih ... A-8
Estimating Life Cycle Cost for a Product Family Design: The
Challenges
T J Suteja, A Karim, P K D V Yarlagadda, C Yan ... A-14
Reinterpretation of Pracimayasa interior in Pura Mangkunegaran
Surakarta in Global Era
Sunarmi, Sudardi B, Sukerta P M, Pitana T S ... A-21
An Integrative Fuzzy Kansei Engineering and Kano Model for Logistic
Service
M Hartono, T K Chuan, D N Prayogo, A Santoso ... A-28
The Impact of Expatriates Directors on The Indonesian Company’s
Performance
I M Ronyastra ... A-35
Survival
Analysis for Customer Satisfaction: A Case Study
M A Hadiyat, R D Wahyudi, Y Sari... A-41
Pattern Analysis of Frand Case in Taiwan, China and Indonesia
A H Kusumo, C-F Chi, R S Dewi ... A-47
Outdoor Altitude Stabilization of QuadRotor based on Type-2 Fuzzy
and Fuzzy PID
H Wicaksono, Y G Yusuf, C Kristanto, L Haryanto ... A-54
Investigating The Role of Fuzzy as Confirmatory Tool for Service
Quality Assesment (Case study: Comparison of Fuzzy Servqual and
Servqual in Hotel Service Evaluation)
vii
B. Sustainable Manufacturing Processes
Closed Loop Simulation of Decentralized Control using RGA for
Uncertain Binary Distillation Column
R Agustriyanto, J Zhang ... B-1
An Efficiency Improvement in Warehouse Operation using Simulation
Analysis
N Samattapapong ... B-7
A Simulation Method for Productivity Improvement Case study: Car
Anti-Vibration Part Manufacturing Process
N Samattapapong ... B-13
A Service Queue Improvement by using Simulation Technique: Case
Study in Suranaree University of Technology Hospital
N Samattapapong ... B-20
Modeling of The Minimum Variable Blank Holder Force Based on
Forming Limit Diagram (FLD) in Deep Drawing Process
S Candra, I M L Batan, W Berata, A S Pramono ... B-26
Single-Tier City Logistics Model for Single Product
N I Saragih, S N Bahagia, Suprayogi, I Syabri ... B-32
Inventory Model Optimization for Supplier-Manufacturer-Retailer
System with Rework and Waste Disposal
A R Dwicahyani, E Kholisoh, W A Jauhari, C N Rosyidi, P W Laksono ... B-39
A Periodic Review Integrated Inventory Model with Controllable
Setup Cost, Imperfect Items, and Inspection Errors under Service
Level Constraint
R S Saga, W A Jauhari, P W Laksono ... B-46
A Joint Economic Lot-Sizing Problem with Fuzzy Demand, Defective
Items and Environmental Impacts
W A Jauhari, P W Laksono ... B-53
Development of Coordination System Model on Single-Supplier
Multi-Buyer for Multi-Item Supply Chain with Probabilistic Demand
G Olivia, A Santoso, D N Prayogo ... B-60
Using Genetic Algorithm to Determine The Optimal Order Quantities
for Multi-Item Multi-Period under Warehouse Capacity Constraints in
Kitchenware Manufacturing
viii
Evaluation and Improvement The Performance of The Production
Floor to Increasing Production Result with Simulation Approach (Case
Study PT.B)
R Fitriana, P Moengin, F N Ontario ... B-74
Transition Guidance from ISO 9001:2008 to ISO 9001:2015 for an
Organization to Upgrade Its Quality Management System to Become
more Resilient and Sustainable
Y Sari, E Wibisono, R D Wahyudi, Y Lio ... B-81
Improving Delivery Routes Using Combined Heuristic and
Optimization in a Consumer Goods Distribution Company
E Wibisono, A Santoso, M A Sunaryo ... B-88
The Effect of Different Concentrations of Tween-20 Combined with
Rice Husk Silica on the Stability of o/w Emulsion: A Kinetic Study
L Sapei, I G Y H Sandy, I M K D Saputra, M Ray ... B-96C. Sustainable Energy & Earth Resources
Effects of Glass Scraps Powder and Glass Fibre on Mechanical
Properties of Polyester Composites
K Sonsakul, W Boongsood ... C-1
Phenol Hydroxylation on Al-Fe modified-Bentonite: Effect of Fe
Loading, Temperature and Reaction Time
R K Widi, A Budhyantoro, A Christianto ... C-8
Equilibrium Study for Ternary Mixtures of Biodiesel
S Doungsri, T Sookkumnerd, A Wongkoblap and A Nuchitprasittichai ... C-15
Galena and Association Mineral at Cidolog Area, Cidolog Distric,
Sukabumi Regenct, West Java Province, Indonesia
H S Purwanto, Suharsono ... C-22
Identification, Measurement, and Assessment of Water Cycle of
Unhusked Rice Agricultural Phases, case study at Tangerang paddy
field, Indonesia
N Hartono, Laurence, H Putra J ... C-30
Performance test of a grid-tied PV system to power a split air
conditioner system in Surabaya
E Tarigan ... C-36
Recycled asphalt pavement–fly ash geopolymer as a sustainable
stabilized pavement material
*)S Hopibulsuk, M Hoy, P Witchayaphong, R Rachan, A Arulrajah ... C-42
ix
Controlled-Release Fertilizer Based on Cellulose Encapsulation
Savitri E, and AdiartoT ... C-53
Bioethanol Production from Whey Yogurt by Kluyveromyces lactis
YE Agustin, A Fatmawati, R Amalia ... C-60Hydrolysis of alkaline pretreated banana peel
A Fatmawati, K Y Gunawan and F A Hadiwijaya... C-64
D. The Role of IT in Sustainable Enterprise
Food and Feeding Time Remainder System to Support the Fulfilment
of Nutritional Standards for Infants
N Sevani, C M Budijanto ... D-1
Computer vision system for egg volume prediction using
backpropagation neural network
J Siswantoro, M Y Hilman and M Widiasri ... D-7
MobKas, Decision Tools for Purchasing Used Vehicle
S Limanto and Andre ... D-13
Enhancing government employees performance and behaviour using
e-Kinerja
D Prasetyoand R Bisma ... D-19
Development of Ubaya Tracer Study Website
D T Absari, S Limanto, A Cynthia ... D-27
Online Orchid Sales for Dimas Orchid, Trawas, Mojokerto
Njoto Benarkah, Adrian Djitro, Yoan Nursari Simanjuntak, and Oeke Yunita ... D-33
A Multi-hop Relay Path Selection Algorithm Considering Path
Channel Quality and Coordinating with Bandwidth Allocation
Yuan-Cheng Lai, Riyanto Jayadi, and Jing-Neng Lai ... D-39
Leaf App: Leaf Recognition with Deep Convolutional Neural Networks
Tri Luhur Indayanti Sugata, Chuan-Kai Yang ... D-46The Development of 3D Virtual Museum to Raise Indonesian Young
People’s Awareness of Endangered Animals in Indonesia
Bali 24‐25 August 2017 A‐41
Survival analysis for customer satisfaction: a case study
M A Hadiyat, R D Wahyudi and Y Sari
Industrial Engineering, University of Surabaya
E-mail: [email protected]
Abstract. Mostly, customer satisfaction survey conducted periodically to track the
dynamically of it. One of the goals of this survey is to evaluate the service design by recognizing the trend of satisfaction score. Many researchers recommend inre-designing the service when the satisfaction scores were being decreased, so that the service life cycle could be predicted qualitatively. However, these scores usually set in likert scale and have quantitative properties, then should be analysed in quantitative model as well so that the predicted service life cycle would be done by applying the survival analysis. This paper will discuss a starting point for customer satisfaction survival analysis with a case study in
healthcare service.
Keywords: satisfaction scores; survival analysis; satisfaction life cycle; service re-design
predicting
1. Introduction
Many researchers proposed to conduct the customer satisfaction survey periodically to capture the behavior of this dynamic satisfaction scores [1]. The questionnaire for this survey consists of items interested by customers that influencing their satisfaction level. Qualitatively, some researchers decide to re-design the service when there are some indications that the scores being decreased [2]. It means that there are some limitations in predicting when the re-design process should be conducted. One needs to expert judge the re-design time base on past experiences.
However, quantitative approach in designing questionnaire for measuring customer satisfaction should be considered. Items in questionnaire for this survey usually scaled in likert items, so that the scores have some quantitative property [3]. Once the survey was conducted and satisfaction score was calculated, the quantitative analysis could be done and gives stronger interpretation in predicting the service life cycle.
Bali 24‐25 August 2017 A‐42 The survival analysis helps the management to predict the time where new service design should be deployed, by constructing the probability that the scores less than certain levels of satisfaction. Started by control charting the satisfaction scores over time and capture its dynamic, then continued by fit the best probability distribution and followed by calculating the probability of satisfaction survival. Smaller survival probability of certain level of satisfaction represents the need of service re-design.
2. Literature review
2.1. Parasuraman’s Satisfaction scores
Parasuraman[6] mention that satisfaction of customer is the gaps measurement between expected and perceived service received by customers, defined as customer gaps. Moreover, another gaps also measured for mining the causes of customer gaps, and all those integrated gaps are summarized as the well-known method called SERVQUAL, stand for service quality.
Figure 1. SERVQUAL gaps (taken from [6])
Common questionnaire for measuring these customer gaps consist of at least 20 likert scale questions. All items are generated based on 5 dimensions i.e. tangibles, empathy, reliability, responsiveness, and assurance. Overall satisfaction score of a customer is calculated as the average of each item scores. Scores from all customers that measured over time form a dataset to be modeled with survival analysis. In this paper, all satisfaction scores converted to positive value, low positive mean unsatisfied while high one means satisfied.
2.2. Survival analysis
Similar to the calculation of product reliability, the survival analysis in this paper is based on [7] applied to satisfaction dataset. Steps in survival analysis for product reliability follows points below:
a. Measure the reliability data t(age of component, or satisfaction scores),
b. Fit the dataset with some probability density function (PDF)f(t), this function could be a product of two or more probability distribution regard to its dynamically behavior.
c. Use the fitted PDF to calculate the reliability of component or satisfaction. Fitted probability distribution could be calculated by using simulated Bayesian approach due to its multimodality.
Reliability function , (1)
Where
Bali 24‐25 August 2017 A‐43 The PDF used in this paper refer to common survival analysis, for example, like weibull, exponential, gamma, and similar distribution covered in normal family distribution, multiplied by similar distribution as well so that f(t) could be interpreted.
3. Research framework and methodology
This paper is part of preliminary research in modeling customer satisfaction data and predicting the service life cycle. The main framework includes the integration of two probability distribution fitted by Bayesian approach. Satisfaction PDF called f(x), and how long customers have been using service denoted by s(t).
Modelling service life cycle
How satisfy the customer on the service
(By SERVQUAL)
How long customer has been using the service
Satisfaction PDF f(x) Time PDF s(t)
PDF of satisfaction relibility as Product of f(t) and s(t)
(using Bayesian approach)
Predicting service life cycle
Time for service re-design Satisfaction control chart, capturing the
behaviour
Figure 2.research framework
Product PDF as multiplication of f(x) and s(t) done by simulating those prior distribution so that the posterior PDF obtained. Mathematically, the posterior PDF (product PDF) for modeling satisfaction reliability survival function written as follows:
Bali 24‐25 August 2017 A‐44
4. Result and discussion
Case study in this paper was taken from [8], there are 155 data recorded from survey conducted for evaluating a hospital patients perception about its services. The dataset consists of two variables, patient satisfaction scores (on scale of 1-7) and how long they have been treated and staying in hospital (in days). First, the behavior of those two variables captured by using multivariate control chart, as in [9] and refers to [10].
Figure 3.Multivariate control chart. (a) Before omitting unusual observations, and
(b) After removing unusual observations
Two points are out of control; indicate that at certain time some special cases should be investigated. If there are some causes then the two points should be removed from analysis. Therefore, PDF fitting process for those two variables could be held.
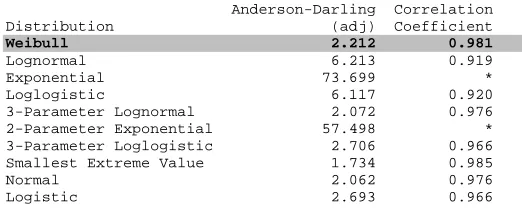
Based on parametric survival analysis using MINITAB software, fitting process for f(x) and s(t) has done. PDF f(x) was well fitted by weibull distribution, and s(t) was assumed to follow exponential distribution.
Figure 4. Minitab output; probability distribution fitting for satisfaction data
The multiplication process in (2) could not be solved analytically, so that Bayesian Markov Chain Monte Carlo [10] simulation was used to fit the PDF L(xt) as the Bayesian posterior distribution. Bayesian structure for likelihood function f(t), prior distribution s(t)and posterior L(xt) defined as:
Bali 24‐25 August 2017 A‐45 The Markov Chain Monte Carlo simulation was conducted by using WINBUGS (Bayesian Using Gibss Sampler) software [11].
Figure 5.WINBUGS Markov Chain Monte Carlo Result for posterior PDF
Figure 5 shows that the estimated α was 0.803, using similar way the estimation of other parameters has obtained. Next, this value would be used to predict the probability of satisfaction survival. Table 1 represents the trends of survival probability.
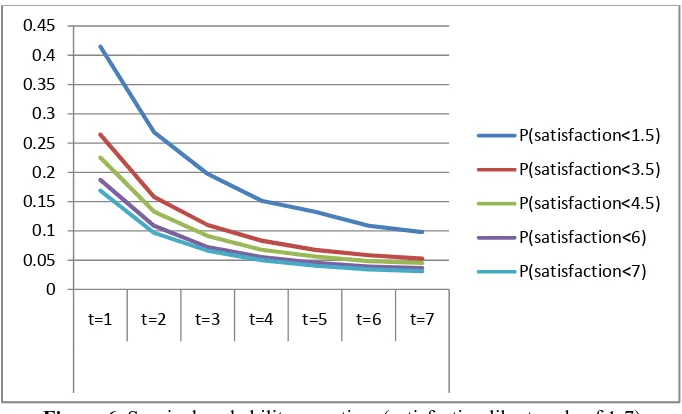
Figure 6. Survival probability over time (satisfaction likert scale of 1-7)
The survival probability decreased over time; moreover the probability at same time t for high satisfaction level gives higher probability than lower ones. Figure 6 gives interpretation that at until t=7, the satisfaction of customer becomes higher. At first day in hospital, patient feels uncomforted because of inadaptable conditions, but after few days the patient perceived more satisfy and got more complete service.
5. Concluding remarks
This is an initial research for mathematically modeling customer satisfaction due to service quality of a nonmanufacturing company or public service. The level of satisfaction was being dynamic and interested to study. Development of this research leads to the innovation of robust service design.
Acknowledgement
This paper is part of research funded by Directorate General Higher Education, Ministry of Research, Technology and Higher Education of the Republic of Indonesia, year 2017.
References
[1] Hill N Roche G Allen R 2007 Customer Satisfaction: The Customer Experience through the Customer's Eyes (London - Cogent Publishing)
[2] Lovelock Patterson and Wirtz 2015 Services Marketing (Melbourne – Pearson Australia)
0 0.05 0.1 0.15 0.2 0.25 0.3 0.35 0.4 0.45
t=1 t=2 t=3 t=4 t=5 t=6 t=7
P(satisfaction<1.5)
P(satisfaction<1.5)
P(satisfaction<3.5)
P(satisfaction<4.5)
P(satisfaction<6)
Bali 24‐25 August 2017 A‐46 [3] Audrezet A Olsen S O Tudoran A A 2016 The GRID scale: a new tool for measuring service
mixed satisfaction Journal of Services Marketing30 issue 1 29
[4] Chen Y Zhang H and Zhu P 2009 Study of Customer Lifetime Value Model Based on Survival-AnalysisProceeding of World Congress on Computer Science and Information Engineering
[5] Lu J 2003 Modeling Customer Lifetime Value Using Survival Analysis - An Application in the Telecommunications IndustrySAS User Group International Proceedings(Washington) [6] Parasuraman A Zeithaml V A Berry L L 1988 SERVQUAL: a multi-item scale for measuring
consumer perceptions of the service quality Journal of Retailing64 1 12-40.
[7] Ebeling C 2010An Introduction to Reliability and Maintainability Engineering (Waveland) [8] Trusko B Pexton C Harrington J Gupta P K 2007 Improving Healthcare Quality and Cost with
Six Sigma (FT Press)
[9] Khorsidi H A Nikfalazar S Gunawan I 2016 Statistical process control applications on service quality using SERVQUAL and QFD with a case study in trains service The TQM Journal 28 2 195
[10] Montgomery D C 2013 Introduction to Statistical Quality Control (Wiley)
![Figure 1. SERVQUAL gaps (taken from [6])](https://thumb-ap.123doks.com/thumbv2/123dok/3636815.1462675/10.612.180.448.277.458/figure-servqual-gaps-taken.webp)