www.getview.org
(AERY)P S)(OMB)NG, YU(AZR) , M.Y., YA(AYA , S.(., MY)A YUZR)NA , Z.A. and A)NUL AZN)ZA , A.Z.
1, 2, 3
Faculty of Manufacturing Engineering Universiti Teknikal Malaysia Melaka Hang Tuah Jaya, 76100 Durian Tunggal, MALAYSIA
1
2
3
4, 5
Department of Mechanical Engineering Politeknik Merlimau Melaka
Jalan Jasin, 77300 Merlimau, Melaka, MALAYSIA
4
5
1.0 INTRODUCTION
The customer satisfaction, according to Rahman , p. , constitutes a cardinal indicator for assessing the success of an enterprise. (owever, as like (art , p. said that "the changes in companies’ customer satisfaction scores don’t happen overnight; they have to work their way through complex value chains that ultimately affect quarterly profits and stock prices". )n this context, Zingheim and Schuster , p. asserted about the successful of financial performance and business growth due to the listening customer input in decision processes in which they are formulated to encourage the innovation and creativity directed to the development of new or enhanced products and services see i.e. Venkataraman & Ramanujam, ; Erdil et al., ; Verhees & Meulenberg, ; Pérez & Canino, , etc . Previously, through the case of Swedish customer satisfaction barometer on whether the companies' condition is healthy and having prospect for the future or not, Fornell , p. argued that it can be indicated from how the company can satisfy their customer. )n this sense, with a case study carried out in the supermarket context in Brazilian related to Norwegian Customer Satisfaction Barometer, Slongo and Vieura , p. empirically proved that satisfaction plays an important role in determining affective commitment and has a positive influence on corporate image. Specifically, Gerson in this sense had clearly state about the fulfilment of customer s need that depends on the existence and performance of the product/ services in which Söderlund and Vilgon
This study is to find out what the result of qualitative and quantitative approaches related to customer satisfaction if its measurement is carried out by integrating the measurement of customer satisfaction refers to the importance-performance (IPA) concept and Kano model into SERVQUAL attributes format. By considering the attributes aspects of SERVQUAL related to criteria of quality service with a case in education institution, the survey using questionnaires developed on the importance-satisfaction analysis (IPA) of 5 point of Likert scale were then performed in order to investigate the current of satisfaction condition. While the Kano criteria associated to the dichotomous statements contain of functional and dysfunctional of quality attributes level were then used to quantify the qualitative response. In this study, the domain of functional and dysfunctional of Kano is discussed and reviewed, including how their correlation against IPA and vice versa. By integrating of both approaches, the correlation between both will represent each of their characteristics as to be compared to each other, in which the result can be justified as the priorities of customer satisfaction. In addition, the consistencies of response data based on the approaches related to the criteria of KANO diagram against the functional and dysfunctional element can be defined in order to characterize the background and types of survey questionnaires
Keywords: Kano Model, SERVQUAL, Dysfunctional and Functional criteria, Importance and
Performance
REVISITED THE IMPORTANCE AND PERFORMANCE
ANALYSIS (IPA) AND KANO MODEL FOR
CUSTOMER SATISFACTION MEASUREMENT
, p. on this issue has identified several significant associations between variables in the customer satisfaction - repurchase intentions - purchase behaviour - customer profitability chain.
Considering on this, to understand customer satisfaction the companies therefore need to understand the customer s need and the expectation. First, according to Tse and Wilton , companies need to consider the customer response related to the mismatches disconfirmation perceived between prior expectations and actual performance of a product. Thus, the perceived performance is compared with the expectations as a level of customer feelings Kotler, . Second, the companies should sensitive also to an emotional challenge of the experience towards the consumption of a product / service Wilkie, , in which the purchase evaluation is required against the customer's expectations and dissatisfaction of the selected alternatives, especially if the expectations results outcome were not met Engel et al., . On this, for an instance, Collier , p. discussed about the combination of customer satisfaction and price related to the process in creating and delivering the value to customers in the marketplace. This perspective interprets today's competitive market as an opportunity with crucial effort in creating a loyal customer by capturing and retaining them. On how to achieve customer satisfaction, the company should be going through the justification on whether a product is good quality or not. (ere, related to the aim of satisfying customer, Chen and Lee added about how the company must to correctly attribute the factors of quality identified so that the correct decision can be made. This is due to the customer requirements are much more technically complex than in consumer market Kultanan et al., , p. .
Related to this issue, McQuitty et al., , p. put the assumption that a customer will learn from experience where the decreasing levels of expectations disconfirmation against goods and services will affect customer satisfaction. Previously, Matzler and (interbuber , p. discussed about the using of satisfaction ratings as the performance indicator of products and services delivered, beside the indicator of the company s future. (owever, Zemla , p. realized that since many approaches to measurement of product quality especially in service sector in which they have been or might be successfully implemented are still in scientific debate on superiority of one method over another, then such methods usually not treated as complementary rather as alternative tools. On this, previous studies carried out had proposed several approaches in order to measure the customer satisfaction. i.e. )PA to improve order-winner criteria and win order Lee et al., , )PA with strength and weakness Zemla, , )PA with Kano Model and Dematel Yu et al., , MUSA method Grigoroudis & Spyridaki, , structuring the customer requirement model with Quality Function Deployment Kultanan et al., ; Matzler & (interhuber, ; Lai et al., , the weighted average score model toward Kano model Bhattacharyya & Rahman, ; Lin & Niu, , customer satisfaction through creating loyal customers Rahman, , the influences the components of products and services Sauerwin et al., ; Sauerwein, , the importance of quality attributes using categories of Kano model Yang, , potential benefit acquired with quality elements classified into categories of Kano models (su et al., , interactivity-satisfaction relationship Zhao & Dholakia, , integrated approach of Kano model and ANOVA technique Lai & Wu, , SERVPEX Robledo, , integrative configuration of customer value by -angle view Khlaifa, , to convert of attractive quality attribute to must-be quality attribute and one-dimensional quality attribute Lee et al., , integration of FMEA and Kano model Shahin, , integrating the Kano model, A(P, and planning matrix Bayraktağlu & Özgen, , the multistage method for weighting customer satisfaction Crostack et al., , Brady and Cronin s model toward Kano Model (ögstrom et al., , better-worse diagram of Kano model Witell & Löfgren, , the dynamic of service attributes of attractive quality in Kano model Witell & Fundin, , integration of Kano model and exit-voice theory Lee et al., , life cycle design Ernzer & Kopp, , etc . They, however, do not directly discuss about the aspects of performance-importance to the priorities of improvement from the attributes positioning based on current level performance related against the differences of Kano quality elements were resulted. Grigoroudis et al., , p. stated that a number of measurable parameters is directly linked to several aspects of company s products/services or else that were remain an abstract and intangible notion. They also asserted that a common problem faced while analyzing data from customer satisfaction surveys are about the comparison of stated and derived importance for a set of satisfaction dimension Grigoroudis et al., , p. . )n this sense, Mikulić previously stated that they could potentially to mislead the implication of customer satisfaction. Especially, toward the analysis of importance and performance that were assumed as the technique of symmetric and linear relationships between attribute level performance and OSC asymmetric impact on overall customer satisfaction . Specifically about )PA, Abalo et al., , pp. - even commented with criticism against the scholars whose unconsciously had adopted )PA procedure in their studies e.g. standardized coefficients by multivariate regression, linear regression coefficient, cojoint analysis, partial correlation or logistic regression but they missed out of the inherently of Martilla and James procedure Martilla & James, .Through their proposal relating to an alternative of )PA which combines the quadrant and diagonal-based schemes, they agreed with the notion of "direct measures capture the importance of attribute better than indirect measures."
dissatisfaction, where Kano model pointed out the phenomenon of product/service attributes as an asymmetric and nonlinear impact on OCS. (ence, due to the attributes of importance-performance assumed are as the technique of symmetric and linear relationships between attribute level performance, then the assumptions of the Kano model to the certain product/service attributes quality elements , therefore, need a further identification of the Kano quality elements in which improvement priorities can be determined by analyzing the current level of performance Tontini & Silveira, , p. .
2.0 LITERATURE REVIEW
2.1 Customer Satisfaction
According to Schnaars , the purpose of a business is, basically, to create profit by satisfying the customers. Through the creation of customer satisfaction, will enable the company to generate some benefits to them, including the relationship between the company and its customers as a good foundation for the creation of loyalty and repeat purchase of customers. Based on this sense, the analysis of the difference between expectations and performance/ results related to the customer satisfaction depend on their perceptions and expectations. Specifically, in service business whereby most of scholars discussed about the service perceptions and expectations based on the case given. i.e. bank Alhemoud, ; Naeem & Saif ; Guo et al., ; Jabnoun & Al-Tamimi, , financial & loan funding Gottschalk, , hospital Brennan, ; Williams et al., ; Peltola et al., ; Padma et al., , public service Rodríguez et al., , security firm Xu & Goedegebuure, , airlines Gustafsson et al., ; Frost & Kumar, , education Joseph et al., ; García-Aracil, , etc.
)n brief, they proposed a positive linear relationship between service quality and customer satisfaction to profitability. (owever, they are not clearly in differentiating the service quality constructed and distinguishing between functional service quality FSQ , which is means doing things nicely and technical service quality TSQ is doing things right Kumar et al., , pp. - . Reflecting on this, First, (su and Cai , p. therefore asserted that when customer satisfaction is modelled as a function of disconfirmation arising from discrepancies between prior expectations and actual performance, then the expectations as a critical antecedent of satisfaction becomes a determinant of attitude. This means that customer satisfaction is relating to a highly personal assessment and greatly affected by customer expectations. Grönroos , p. previously emphasized that how good the quality of the product was perceived by customers, it should be, therefore, accordingly based on the measurement toward what the approaches of attitude determinant of customer satisfaction. Especially, related to the service perceptions and expectations value.
Second, (anan and Karp explained the satisfaction related on the customer s experience of both contacts with the organization and personal outcomes. (ere, Kotler , p. said that customers feeling of pleasure or disappointment is resulted from comparing a product s perceived performance or outcome in relation to their expectations. Padilla et al., stated that the customer may be satisfied with a product or service, an experience, a purchase decision, a salesperson, store, service provider, or an attribute in which the high of quality customer relationships are therefore important.
Third, the reality of the market competition through service quality required to improve customer satisfaction. (ere, many service industries should pay greater attention to customer service quality and customer satisfaction in order to increase the company s competitiveness. Beside, the deregulation of the total perception related to the quality of a service as the outcome technical quality , rather than simply addressing service quality from a functional perspective Grönroos, , p. ; Kumar et al., , p. ; Kang & James, , p. .
All of aforementioned above are important for company to get more profitability and achieve the profit target margin. Therefore, customer relationship development and management systems need to be focused heavily by companies Verhoef et al., , while the development of effective customer relationships need to be recognized as an essential component of marketing strategies in service industries Lymperopoulos et al., , p. . (ossain and Leo , p. said that this is due to quality of services are globally remained as a critical point for businesses strategy to a comparative advantage in the marketplace, where service quality as becoming a primary competitive weapon Stafford,
, p. .
2.2 Importance-Performance Analysis Vs. Kano
services of poor performance or overperforms. For this purpose, the interpretation is presented graphically on a grid divided into four quadrants, which according to the average importance and satisfaction performance . Four quadrants and the implications of the )PA are shown in Table and Figure . The four quadrants are identified are Concentrate Here, Keep the Good Work, Low Priority and Possible Overkill.
Figure1: )mportance-Performance Analysis Grid
Function of )PA technique is to identify strengths and weaknesses as an approaches related to customer satisfaction based on what customer preferences in making a choice. Since the measurements of the )mportance – Performance Analysis )PA and the SERVQUAL model are quite similar, by comparing between two criteria of them is used to determine the criterion relative to importance of attributes. These criteria reflects consumers evaluation of the offering in terms of those attributes, while the SERVQUAL technique identifies the customer satisfaction of service attributes by comparing of two criteria that are customer s expectation and customer s perception in the five dimensions. On this, Parasuraman et al
, p. defined the attributes dimensions of service quality SERVQUAL as the method used to measure the quality of service as follows:
i Reliability: ability to perform the promised service, dependably and accurately. ii Responsiveness: willingness to help customers and provide prompt service.
iii Assurance: knowledge and courtesy of employees as well as their ability to inspire trust and confidence.
iv Empathy: caring, individualized attention the firm provides its customers.
v Tangibles: appearance of physical facilities, equipment, personnel, and communication materials.
Table 1: )mportance – Performance Quadrant
Quadrant I
Concentrate Here
Attributes are perceived to be very important to respondents, but performance levels are fairly low. This suggests that improvement efforts should be concentrated here.
Quadrant II
Keep up the good work
Attributes are perceived to be very important to respondents, and at the same time, the organization seems to have high levels of performance in these activities. The message here is to keep up the good work.
Quadrant III
Lower priority
Attributes here are rated as having low importance and low performance. Although performance levels may be low in this cell, managers should not be overly concerned, since the attributes in this cell are not perceived to be very important. Limited resources should be expended on this low priority cell.
Quadrant IV
Possible over kill
This cell contains attributes of low importance, but where performance is relatively high. Respondents are satisfied with the performance of the organization, but managers should consider present efforts on the attributes of this cell as being superfluous/ unnecessary.
While, Kano method is used to categorize the attributes of products and services based on how well the product / service is able to satisfy customer needs Table based on as following:
i Must Be or Basic needs.
)t s taken for granted when this element is sufficient and will not result in more satisfaction, but insufficiency of this element results in non-satisfaction. Fulfilling the must-be requirements will only lead to a state of not dissatisfied . The customer regards the must-be requirements as prerequisites and therefore does not explicitly demand them. Must-be requirements are in any case a decisive competitive factor, and if they are not fulfilled, customers will be very dissatisfied ii One-dimensional or performance needs
)f this element is sufficient, customers feel satisfactory. )nsufficiency of this element results in non-satisfaction. With regard to these requirements, customer satisfaction is proportional to the level of
fulfilment – the higher the level of fulfilment, the higher the customer s satisfaction and vice versa. One dimensional requirements are usually explicitly demanded by the customer
iii Attractive or excitement needs
Attractive requirements are neither explicitly expressed nor expected by the customer. (owever, when this element is sufficient, customers feel satisfactory, but still acceptable if it is not sufficient. Fulfilling these requirements leads to more satisfaction. Even if they are not met, customers do not feet dissatisfied.
iv )ndifferent
This element will not result in satisfaction or not, whether it is sufficient or no. Customers do not care whether they are fulfilled or not.
v Reverse
Non-satisfaction comes when it is insufficient and on the contrary satisfaction comes when it is sufficient. Category reverse requirement, not only is this product feature not wanted by the customer but he/she even expects the reverse.
Table 2: Kano Diagram
Customer Requirement DISFUNCTIONAL
Like Must-Be Neutral Live-With Dislike
FUNCTIONAL
Like Q A A A O
Must-Be R I I I M
Neutral R I I I M
Live With R I I I M
Dislike R R R R Q
Note: A=Attractive; O =One Dimensional; M=Must Be; I = )ndifferent; R = Reverse; Q=Questionable
3.0 METHODOLOGY
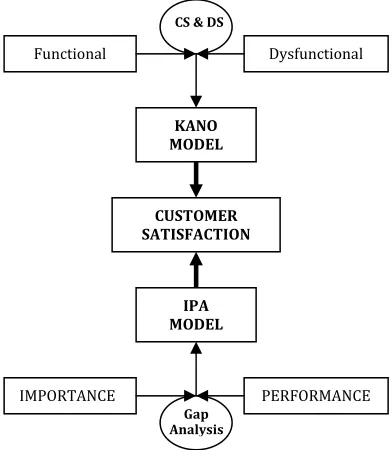
)n order to understand and determine the customer needs and their impact on customer satisfaction, this study categorize the different of customer requirements based on SERVQUAL criteria through the importance-performance attributes of service given. Meanwhile, on how well they are able to achieve customer satisfaction, the analysis is carried out through service quality provided for the customers related to Kano model and quality attribute criteria towards customer satisfaction see Figure .
Figure 2: Customer Satisfaction
The survey was carried out through two types of questionnaire developed and used for analyzing the customer satisfaction. First, Kano criteria that contains of two set of questionnaires designed with methods of dichotomous statements functional and dysfunctional . The application of Kano model is to analyze customer needs that are categorized in the different customer requirements CRs based on the quality features with five qualitative-attributes scale see table . The questions generated are related to the customer needs, requirements CRs , satisfaction, and performance of customer perceptions as a customer satisfaction
CS & DS
Gap Analysis
PERFORMANCE )MPORTANCE
CUSTOMER SATISFACTION
KANO MODEL
Dysfunctional Functional
form. The details of quality features in Kano model for evaluation are Attractive A , One-Dimensional O , Must-Be M , )ndifferent ) , Questionable Q , and Reverse R see . .
Second, Likert form of the questionnaires with the value of quantitative scale ranged from to that represent as 'very dissatisfaction' till 'very satisfaction'. The statistical method is applied to analyze the general information and responses from the questionnaires method. Meanwhile, to know the different between service given by the provider as the experience of customer toward performance of provider related to service provided, the gap analysis is used to find how the importance of service given related to customer expectation. This is involved a comparison of expectations with performance Parasuraman et al., , p. . )n addition, on how satisfy the customer based on Kano model is also known by calculating the values of customer satisfaction
CS and customer dissatisfaction DS . Therefore,
i The correlation of Kano criteria results related to customer satisfaction toward the importance and performance of service delivered to customer, will depict as follows:
a (ow satisfy the customer towards the company performance of their service given.
b What the priorities are required by the provider related to the importance of customer s view in order to improve the service delivered.
ii The characteristics of service delivered to customer based on functional and dysfunctional criteria towards importance and performance of service delivered, will depicts as follows:
a What are the elements of functional that customer s view as the importance of service delivered to them.
b What are the elements of dysfunctional that customer s view as do not the importance to them, and how the performance of service delivered to them.
3.1 Case: Education
Anderson on the issue related to service in education institution stated about many reasons and consideration should be put as the pillar of the service quality function in a university. Comparing to the academic units, on the administrative units where the administrative departments of the university, such as the registration office, financial office or library, are more likely to be a replication of the bureaucratic units of governmental or public institutions Abouchedid & Nasser, , pp. - , by providing the high quality service to students will contributes to the positive assessment of the university. This is, especially, due to they are the first exposure of the student to the university whenever the admission and registrar s services in which the bureaucracies and inefficient infrastructure to baskets the registration remains a traditional and manual process Spencer, .This study is carried out towards students of one of College Community in Melaka with the questions as bellow:
i Reliability
a Admission procedures are easy and quick.[Q ]
b Teaching and learning process is run properly and smoothly. [Q ] c Executed with proper timetable / discipline. [Q ]
d Teaching-learning process easy to understand and be understood.[Q ] e Conformity with the cost of education facilities.[Q ]
ii Responsiveness
a The ability of teachers are professional and on target.[Q ]
b Officer / employee giving clear information, easy to understand.[Q ] c Clear and precise explanations, if there are questions from students.[Q ] d Employee attitude to awakening your confident.[Q ]
iii Assurance
a Knowledge and teaching skills in teaching.[Q ]
b Skills of teachers and other employees in the work. [Q ] c Service is polite and friendly. [Q ]
d Security & trust services to service. [Q ] e Employees are well dressed and attractive.[Q ] f Security at the time of the learning process.[Q ] g Parking space and secure.[Q ]
iv Empathy
a Service to all students, regardless of social status, and others.[Q ]
b Built up good communication between you and the faculty, staff, and employees.[Q ] c Being able to give a good impression and depth.[Q ]
v Tangibles
a Tables and chairs in good condition and neat.[Q ] b Extensive laboratory and complete.[Q ]
c Completeness and readiness tool in teaching and learning.[Q ] d Cleanliness, neatness, and comfort of the classroom.[Q ] e There are clean toilets.[Q ]
4.0 DATA AND RESULTS
4.1 Traditional Approaches
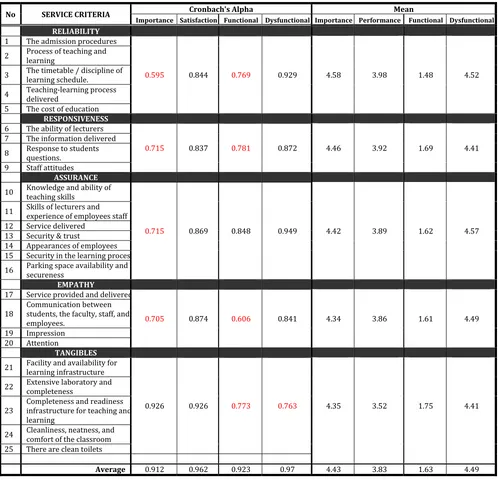
Table shows that all the questionnaires criteria related to performance refer to SERVQUAL criteria were unidimensionality to customer satisfaction. This is shown by value of Cronbach alpha, in which all of them are higher than . or > . . While, on the importance attributes are only on Tangibles. This is also existed on the Functional elements, which are only on Assurance attributes and Dysfunctional elements, except on Tangible criteria. Based on the mean values,
i All of the )mportance criteria are having the score more than . The customer expectation through what the importance of the criteria refers to SERVQUAL element is between satisfy and very satisfy. The average of the )mportance value is . , while the maximum and the minimum value is . and . respectively process of teaching & learning and parking space availability & secureness . The highest and the lowest )mportance criteria value of SERVQUAL is .
Reliability and . Empathy respectively.
ii All the Performance criteria values are more than . The average of the Performance value is . , while the maximum and the minimum is . and . respectively. teaching-learning process delivered and parking space availability and secureness . This is means that the customer view s regarding elements stated in questionnaire as the performance is between neutral and very satisfy. The highest and lowest Performance criteria value of SERVQUAL is . Reliability and
. Tangibles respectively.
iii All the Functional values of Kano criteria are more than . This is means that the Functional element stated in questionnaire is between like it and must-be . The average of the Functional value is . , while the maximum and the minimum is . and . respectively. teaching-learning process delivered and parking space availability and secureness . The highest and lowest satisfaction of Functional criteria based on SERVQUAL l is . Tangibles and . Reliability respectively.
iv All the Dysfunctional values of Kano criteria are more than . This is means that the Dysfunctional element stated in questionnaire is between like-it and dislike . The average of the Functional value is . , while the maximum and the minimum is . and . respectively. security & trust and impression of staff admin . Based on the highest and lowest of Dysfunctional values related to satisfaction criteria refers to SERVQUAL is . Assurances and .
Responsiveness respectively.
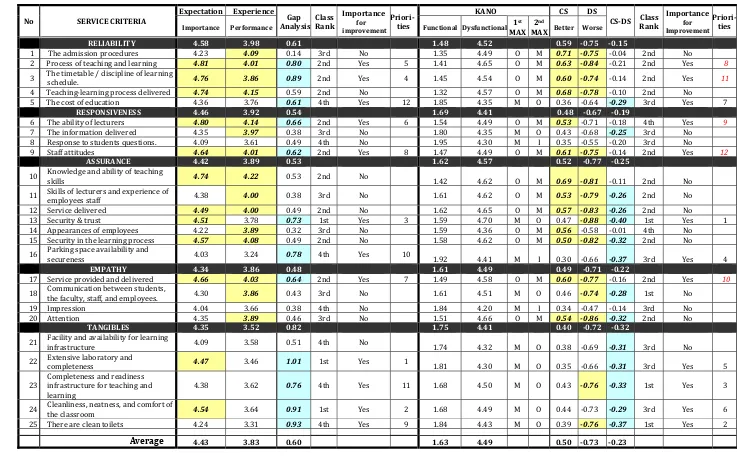
Furthermore, the priorities for the improvement can be applied using the simple model of mathematical logic as follows:
{Priorities} = {Gap Analysis} {Class of Ranking}
Where,
• Gap Analysis = means value of importance – means value of performance.
• Class Ranking = the highest means value of importance – the lowest means value of performance. • The importance of improvement > means of the gap analysis average value.
Table showed that the priorities based on importance and performance analysis of service in the customers views are affected to items of service criteria related to SERVQUAL. The highest priorities are element no. Extensive laboratory and completeness as no. . Based on SERVQUAL criteria, the priorities given should be on Tangibles since they are having more the elements for improvement required. )n this criteria, is also existed the element no. cleanliness, neatness, and comfort of the classroom as no. .
{Priorities} = { CS-DS Class of Ranking }
Where,
• CS = A+O / A+O+M+) • DS = - M+O / A+O+M+)
• Class Ranking = the lowest means value of CS – the highest means value of DS. • The importance of improvement > means of the CS-DS average value.
)n Table also show that the priorities based on customer satisfaction and dissatisfaction CS & DS analysis of service in the customers view are influenced by items of service criteria related to SERVQUAL. While no. till , we do not consider for the improvement priorities since they are having CS-DS values less than the CS-DS average.
The highest priorities are the element no. Security & trust as no. . Based on SERVQUAL criteria, the priorities should be given on Tangibles, since they are having more the element for improvement required in which also in this criteria existed the element no. there are clean toilets no. and no. completeness and readiness infrastructure for teaching and learning as no .
4.2 Re-calculated Approaches
Due to the criteria of )PA refers to SERVQUAL is the developed through the pair questionnaires and the result found on the different focused is in which the importance is focused on Reliability and Empathy, while performance on Reliability and Tangibles, in order to find out the customer satisfaction related to )PA, therefore, should be based on the )PA correlation Table . Bellows, the theorems constructed to Kano matrix Table as following:
Table 3: Kano Matrix
i / j 1 2 3 4 5
1 Q A A A O
2 R ) ) ) M
3 R ) ) ) M
4 R ) ) ) M
5 R R R R Q
KX ⇔ [KFi KDFj]
Where,
Fi={i ⎸i ∈ P, i≤ }; DFj={j ⎸j ∈ P, j≤ } ; X={A,M,O,),Q,R}
o Theorem “Attractive”: Attractive [A] ⇔ Fi={i ⎸i ∈ P, i = } DFj={j ⎸j ∈ P, < j< } o Theorem “Must-Be”: Must-Be [M] ⇔ Fi={i ⎸i ∈ P, < i< } DFj={j ⎸j ∈ P, j= } o Theorem “One Dimensional”: One Dimensional [O] ⇔ Fi={i ⎸i ∈ P, i= } DFj={j ⎸j ∈ P, j= } o Theorem “Indifferent”: )ndifferent [I] ⇔ Fi={i ⎸i ∈ P, < i< }↔ DFj={j ⎸j ∈ P, < i< } o Theorem “Questionable”: Questionable [Q] ⇔ Fi={i ⎸i ∈ P, i= }; DFj={j ⎸j ∈ P, j= } Fi={i ⎸i ∈ P, i= }; DFj={j ⎸j ∈ P, j= } o Theorem “Reverse”: Reverse [R] ⇔ Fi={i ⎸i ∈ P, i> }↔ DFj={j ⎸j ∈ P, j= } Fi={i ⎸i ∈ P, i= } ↔ DFj={j ⎸j ∈ P, j< }
Since KX ⇔ [KFi KDFj] , therefore if {K K } = , where the opponent is {K K } =
Then, KF = ∼ KF, ; KF = KDF
So, {KDF ∈ K} ⇔ {KF ∈ K}
The importancexvs. The experiencex= ∅
The importancex vs. The experiencey = ⊜
Where,
With the assumption where,
•)mportance of Reliability vs. Performance Reliability
ρ X,Y = ∀KEReliability ∀KUA Reliability ≠ {X x= KEReliability ; Y y= KUAReliability } { . } { . } = .
•)mportance of Tangible vs. Experience Tangible
ρ X,Y = ∀KETangible ∀KUATangible ≠ {X x= KETangible ; Y y= KUATangible } { . } { . } = .
(owever, based on correlation shown in Table , it is found that both of those two criteria are . This is means that there are no correlation strong correlation existed between )mportance and Performance attributes between of Reliability and Tangibles. While, towards Responsiveness, Assurance, and Empathy as follows:
•)mportance of Responsiveness vs. Performance Responsiveness
ρ X,Y = ∀KEResponsiveness ∀KUAResponsiveness = ∅ {X x= KEResponsiveness ; Y y= KUAResponsiveness } { . } { . } ={ . }
•)mportance of Assurance vs. Performance Assurance
ρ X,Y = ∀KEAssurance ∀KUAAssurance = ∅ {X x= KEAssurance ; Y y= KUAAssurance } { . } { . } = { . }
•)mportance of Empathy vs. Performance Empathy
ρ X,Y = ∀KEEmpathy ∀KUAEmpathy = ∅ {X x= KEEmpathy ; Y y= KUAEmpathy } { . } { . } = { . }
Table show that both of these of two criteria are not . This is mean that the correlation existed strong correlation between )mportance and Performance attributes among Responsiveness, Assurance, and Empathy . While against the )mportance vs. the Performance ⊜ as following:
•)mportance of Reliability vs. Performance Tangible
∀KEReliability ∀KUATangible = ∅ { . } { . } = .
•)mportance of Assurance vs. Performance Assurance
∀KEAssurance ∀KUAAssurance = ∅ { . } { . } = .
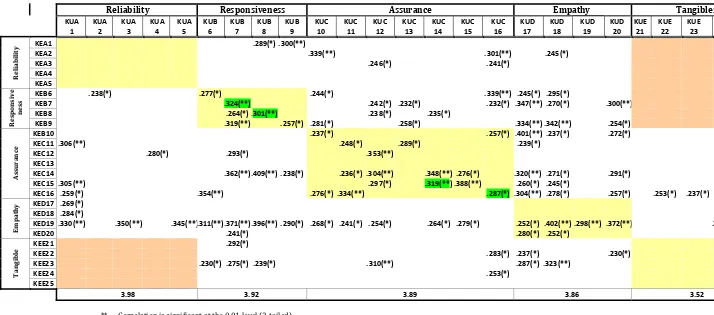
Due to the criteria of Kano refers to SERVQUAL is the developed through the pair questionnaires based on dichotomous statement Functional and Dysfunctional , to find out the customer satisfaction, therefore, should be based on the Kano correlation Table a& b . (ere, the formula as follows:
{KFunctional} {KDysfunctional} = FKano
⇒ {KFunctional KDysfunctional} ⎽ FKano =
⇒ KFunctional FKano = ⎽ {KDysfunctional FKano }
⇒ ⎽ {KFunctional FKano} = KDysfunctional FKano
Table a shows that almost of Kano criteria are correlated to Dysfunctional characteristic. This is means that Kano results as justification on how customer satisfy towards the service given of this survey is mostly influenced by Dysfunctional element rather than Functional element. see the yellow, red, and blue colour marking in Table a, b and .
for Reliability , and question no toward Kano- , no. towards Kano- and Kano- for Tangibles . )n Table shows that as follows:
i The correlation between )mportance towards Performance and the correlation between Functional and Dysfunctional towards Kano can lead the bias misleading for the priorities of improvement required and even to ignore it s, if they are mixed together no. , , , .
ii (owever, if they are justified based on correlation between Functional and Dysfunctional towards Kano and null/no correlation between )mportance and Performance , the bias or misleading condition will occur if the value of gap analysis and CS-DS is less than the total average or average of particular SERVQUAL related. see Table , that is . < . or . and . >
-. or - -. .
iii The correlation between Functional and Dysfunctional towards Kano in which by the condition that CS-DS value is less than the total average or average of particular SERVQUAL related no. , will results with correct data for the priorities of improvement required. (owever, this condition should be also by condition if the value of gap analysis is more than average total average or average of particular SERVQUAL related.
Table 8: The Priorities for )mprovement
SERVQUAL No DESCRIPTION KANO
Importance for Improvement Based on Kano
Importance for Improvement
Based on IPA
RELIABILITY Teaching-learning process delivered O NO NO
The cost of education M Yes / no. Yes / no.
RESPONSIVENESS The information delivered M NO NO
Response to students questions. M NO NO
ASSURANCE
Security & trust M Yes/ no. Yes/ no.
Security in the learning process O NO NO
Parking space availability and secureness M Yes/ no. Yes/ no.
TANGIBLE Extensive laboratory and completeness
M Yes/ no. Yes/no.
There are clean toilets M/M Yes/no. ; Yes no. Yes/no. ; Yes/ no.
5.0 CONCLUSION
The priorities of service delivered as what were expected by student are related the cost of education, security and trust, an extensive laboratory facilities and completeness, and the cleaness of toilet. Although they are only as must-be requirement, they will lead to the dissatisfaction if they are, however, not fulfilled. Therefore, the university has to provide such basic requirement of student expectation and requirements.
Based on the approach of data analysis formulation that are commonly used by many scholars, the priorities for improvement that only depend on Kano results will tend to lead the misleading interpretation of what is actually required and expected by customer. This is also occurred towards the approach of )mportance and Performance analysis, since they are only based on the value of gap analysis. Therefore, by combining the approaches of Kano model and )PA into the formulation of the correlation results, the priorities of customer satisfaction based on what are expected and required by customer can be justified clearly and correctly. On this, we can find that no. related to security & trust is the most important one, based on quadrants of )PA and Kano methods. This is as supported through the correlation comparison between Functional vs. Kano and Dysfunction vs. Kano. We, therefore, propose the formulation of data analysis by mixed of Kano and )PA as what are reviewed by the case of student satisfaction above.
ACKNOWLEDGMENTS
The authors would like to thank CR)M-UTeM. This project is supported by CR)M through PJP/ /FKP D
REFERENCES
[ ] Abalo, J., Varela, J. and Manzano, V. : )mportance Values for )mportance – Performance Analysis: A Formula for Spreading Out Values Derived from Preference Rankings. Journal of Business Research, Vol. , pp. - .
[ ] Abouchedid, K. and Nasser R. : Assuring Quality Service in (igher Education: Registration and Advising Attitudes in a Private University in Lebanon. Quality Assurance in Education, Vol. No. , pp.
-.
[ ] Alhemoud, A.M. : Banking in Kuwait: A Customer Satisfaction Case Study. Competitiveness Review: an International Business Journal, Vol. , No. , pp. – .
[ ] Anderson, R.E. : Consumer Dissatisfaction: The effect of Disconfirmed Expectancy on Perceived Product Performance, Journal of Marketing Research, Vol. , pp. - .
[ ] Au, E.Y.L., Li, W.Y. and Goonetilleke, R.S. : The Challenges of Applying Kano s Method to Footwear Design. Conference of Biomedical Engineering, BME , - September , (ongkong, pp. - . [ ] Bahia, K. and Nantel, J. : A Reliable and Valid Measurement Scale for perceived Scale for the
Perceived Service Quality of Banks. International Journal of Bank Marketing, Vol. No. , pp. - .
[ ] Bayrakaroğlu, G. and Özgen, O. : )ntegrating the Kano Model, A(P and Planning Matrix: QFD Application in Library Services. Library Management, Vol. No. / , pp. - .
[ ] Beck, R.E., Siegel,S.M. and Beares, P. : Consumer Lending, th ed., Washington DC:American Bankers Association.
[ ] Berger, C., Blauth, R., Boger, D., Bolster, C., Burchill, G., DuMouchel, W., Pouliot, F., Richter, R., Rubinoff, A., Shen, D., Timko, M. and Walden, D. : Kano s Methods for Understanding Customer-Defined Quality. The Center for Quality Management Journal, Vol. No. , pp. - .
[ ]Bhattacharya, S.K. and Rahman, Z. : Capturing the Customer s Voice, the Centerpiece of Strategy Making: A Case Study in Banking. European Business Review, Vol. No. , pp. - .
[ ]Boyd, W.L., Leonard, M. and White, C. : Customer Preferences for Financial Services: An Analysis. International Journal of Bank Marketing, Vol. No. , pp. - .
[ ]Brennan, P.F. : Patient Satisfaction and Normative Decision Theory. Journal of the American Medical Informatics Association, Vol. No. , pp. - .
[ ]Chen, J.K. and Lee, Y.C. : To Categorize the Quality Attribute – A New Method. Proceedings of Business and )nformation, Volume , )SSN - , . )nternational Conference on Business and )nformation, July - , , Tokyo, Japan.
[ ]Collier, D.A. : Modelling the Relationships between Process Quality Errors and Overall Service Process Performance. International Journal of Service Industry Management, Vol. No. , pp. - .
[ ]Crostack, (.A., Kern, C. and Refflinghaus, R. : The Suitability of Kano s Method for the Requirements of the Cutlery )ndustry: results of A Case Study Associated with An Approach to widen Kano s Theory. International Journal of Quality and Service Sciences, Vol. No. , pp. - .
[ ]Engel, J.F., Blackwell, R.D. and Miniard, P.W. : Consumer Behavior. Dryden Press, (insdale.
[ ]Erdil, S., Erdil ,O. and Keskin, (. : The Relationships between Market Orientation, Firm )nnovativeness and )nnovation Performance. Journal of Global Business and Technology, Vol No. , pp. - . [ ]Ernzer, M. and Kopp, K. : Application on Kano Method to Life Cycle Design. Proceedings of
EcoDesign2003: rd )nternational Symposium on Environmentally Conscious Design and )nverse Manufacturing, Tokyo, Japan, December - , .
[ ]Fornell, C. : A National Customer Satisfaction Barometer: The Swedish Experience. The Journal of Marketing, Vol. No. , pp. - .
[ ]Frost, F.A. and Kumar, M. : Service Quality between )nternal Customers and )nternal Suppliers in An )nternational Airline. International Journal of Quality & Reliability Management, Vol. No. , pp. - . [ ]García-Aracil, A. : European Graduates Level of Satisfaction with (igher Education. High Education,
Vol. , pp. – .
[ ]Gerson, T. : Deployment of Customer Needs in the QFD using a Modified of Kano Model. Journal of Academy of Business and Economics, Vol No. , pp. - .
[ ]Gottschalk, P. : Stages of Financial Crime by Business Organizations. Journal of Financial Crime, Vol. No. , pp. - .
[ ]Grönroos, C. : Marketing Services: The Case of a Missing Product. Journal of Business & Industries Marketing, Vol. No. / , pp.
-[ ]Grigoroudis, E., Politis, Y., Spyridaki, O. and Siskos, Y. : Modelling )mportance Preferences in Customer Satisfaction Surveys. 56th Meeting of the European Working Group, Multiple Criteria Decision
Aiding, Coimbra, October - , .
[ ]Grigoroudis, E. and Spyridaki, O. : Derived and Stated )mportance Customer Satisfaction Surveys. Operational Research, Vol. No. , pp. - .
[ ]Gustafsson, A., Ekdahl, F. and Edvardsson, B. : Customer Focused Service Development in Practice: A Case Study at Scandinavian Airlines System SAS . International Journal of Service Industry Management, Vol. No. , , pp. - .
[ ](allowell, R. : The relationships of customer satisfaction, customer loyalty, and profitability: an empirical study. International Journal of Service Industry Management, Vol. No. , pp. - .
[ ](anan, M. and Karp, P. : Customer Satisfaction: How to Maximize, Measure, and Market Your Company’s Ultimate Product. American Management Association, New York , X)).
[ ](art, C.W. : Beating the Market with Customer Satisfaction. Harvard Business Review, March , pp. -
[ ](ossain, M. and Leo, S. : Customer Perception on Service Quality in Retail Banking in Middle East: The Case of Qatar. International Journal of Islamic and Middle Eastern Finance and Management, Vol. No. , pp. - .
[ ](ögstrom, C., Rosner, M. and Gustafsson, A. : (ow to Create Attractive and Unique Customer Experiences: An Application of Kano s Theory of Attractive Quality to Recreational Tourism. Marketing Intelligence & Planning, Vol. No. , pp. - .
[ ](su, Y.L., Bing, P.C. and (su, C.C. : Capturing Passengers Voices: The Application of Kano s Model in the Airline )ndustry. Proceedingof International Conference on Logistic, Shipping and Port Management, pp.
- . March – , , Taoyuan.
[ ](u, (.Y., Lee, Y.C. and Yen, T.M. : Amend )mportance-Performance Analysis Method with Kano s Model and DEMATEL. Journal of Applied Sciences, Vol. No. , pp. - .
[ ]Jabnoun, N. and Al-Tamimi A.(. : Measuring Perceived Service Quality at UAE Commercial Banks. International Journal of Quality and Reliability Management, Vol. no. . pp.
-[ ]Joseph, M., Yakhou, M. and Stone, G. An Educational )nstitution s Quest for Service Quality: Customers Perspective. Quality Assurance in Education, Vol. No. , pp. - .
[ ]Kang, G.D. and James, J. : Service Quality Dimensions: An Examination of Grönroos s Service Quality Model. Managing Service Quality, Vol. No. , pp. – .
[ ]Khalifa, A.S. : Customer Value: A Review of Recent Literature and )ntegrative Configuration. Management Decision, Vol. No. , pp. - .
[ ]Kotler, P. : Marketing Management. th eds., Prentice (all, Upper Saddle River, NJ.
[ ]Kultanan, C., Crostack, (.A. and Refflinghaus, R. : )mplementation of Kano Methodology through Various Stakeholder Requirements. Proceedings of the 7th Asia Pacific Industrial Engineering and
Management System Conference 2006, - December , Bangkok, Thailand, pp. - .
[ ]Kumar, V., Smart, P.A., Maddern, (. and Maull R.S., : Alternative Perspectives on Service Quality and Customer Satisfaction: The Role of BPM. International Journal of Service Industry Management, Vol. , No.
, pp. –
[ ]Lai, M., Xie, M. and Tan K.C. : Optimizing Product Design Using the Kano Model and QFD. Proceeding IEEE International Engineering Management Conference, October. , Vol. No. – , pp. – . [ ]Lai, (.J. and Wu, (.(. : A Case Study of Applying Kano s Model and Anova Technique in Evaluating
Service Quality. Information Technology Journal, Vol. No. , pp. - .
[ ]Lee, Y.C, Cheng, C.C. and Yean T.M. )ntegrate Kano s Model and )PA to )mprove Order-Winner Criteria: A Study of Computer Study. Journal of Applied Sciences, Vol. No. , pp. - .
[ ]Lee, Y.C., (u, (.Y., Yen, T.M. and T, C.(. : An )ntegration of Kano s Model and Exit-Voice Theory: A Case Study. The Asian Journal on Quality, Vo. No. , pp. - .
[ ]Lymperopoulos, C., Chaniotakis, ).E. and Soureli, M. : The )mportance of Service Quality in Bank Selection for Mortgage Loans. Managing Service Quality , Vol. No. , pp.
-[ ]Matzler, K. and (interhuber, (.(. : (ow to Make Product Development Projects More Successful by )ntegrating Kano s Model of Customer Satisfaction into Quality Function deployment. Technovation, Vol. No. , pp. - .
[ ]McQuitty, S., Finn, A. and Wiley, J.B : Systematically Varying Consumer Satisfaction and its )mplications for Product Choice. Academy of Marketing Science Review, Vol. No. , pp. - .
[ ]Mikulić, J. : The Kano Model – A Review of its Application in Marketing Research from - . Proceedings of the 1st International Conference Marketing Theory Challenges in Transitional Societies, University of Maribor, pp. - .
[ ]Möller, M., Vukovic, S. and Landgrebe, J. : )dentifying Customer Requirements for Location-Based Services. 8th International Workshop on Mobile Multimedia Communications MoMuC .
[ ]Padma, P., Rajendran, C. and Sai, L. P. : A Conceptual Framework of Service Quality in (ealthcare Perspectives of )ndian Patients and Their Attendants. Benchmarking: An International Journal, Vol. No. , pp. - .
[ ]Parasuraman, A., Zeithaml, V.A. and Berry, L.L : A Conceptual Model of Service Quality and )ts )mplications for Future Research. Journal of Marketing, Vol. , pp. - .
[ ]Parasuraman, A., Zeithaml, V. and Berry, L.L. : SERVQUAL: Multiple-)tem Scale for Measuring Customer Perception of Service Quality. Journal of Retailing, Vol. No. , pp. - .
[ ]Pérez, E.(. and Canino, R.M.B. : The )mportance of the Entrepreneur s Perception of Success . Review of International Comparative Management, Vol. No. , pp. - .
[ ]Peltola, E.W., Kivimäki, M., Elovainio, M. and Virtanen, M. : Organizational Justice and Employee Perceptions on (ospital Management. Journal of Health Organization and Management, Vol. No. , pp. - .
[ ]Rahman, Z. : Developing Customer Oriented Service: A Case Study. Managing Service Quality, Vol. No. , pp. - .
[ ]Robledo, M.A. : Measuring and Managing Service Quality: )ntegrating Customer Experience. Managing Service Quality, Vol. No. , pp. - .
[ ]Rodríguez, P.G., Burguete, J.L.V. , Vaughan, R. and Edwards, J. : Quality Dimensions in the Public
Sector: Municipal Services and Citizen’s Perception, Int Rev Public Nonprofit Mark, Vol. , pp. – .
[ ]Sauerwin, E., Bailom, F., Matzler, K. and (interhuber, (.(. : The Kano Model: (ow to Delight Your Customers. International Working Seminar on Production Economics, )nnsbruck/)gls/Austria, February
-, pp.
-[ ]Sauerwein, E. : Experiences with the Reliability and Validity of the Kano-Model: Comparison to Alternate Forms of Classification of Product Development. Transactions of the 11th Symposium on QFD, QFD )nstitute, Novi, M), - June.
[ ]Shahin, A. : )ntegration of FMEA and the Kano Model: An Exploratory Examination. International Journal of Quality & Reliability Management, Vol. No. , pp. - .
[ ]Shong, L.P.W. and Chung, M.A.K. : The )nternal Performance Measures of Bank Lending: A Value-Added Approach. Benchmarking: An International Journal, Vol. No. , pp. – .
[ ]Slongo, L.A. and Vieira, V.A. : An Analysis of the New Norwegian Customer Satisfaction Barometer New NCSB in a Brazilian Supermarket Context. RAM – Revista de Administração Mackenzie, Vol. No. , pp.
- .
[ ]Söderlund, M. and Vilgon. M. : Customer Satisfaction and Links to Customer Profitability: An Empirical Examination of the Association Between Attitudes and Behavior. SSE/EFI Working Paper Series in Business Administration No. : January .
[ ]Spencer, R. : After the Registration Revolution. College and University, Vol. No. , pp. - . [ ] Tontini, G. and Silveira, A. : )dentification of Satisfaction Attributes using Competitive Analysis of the
)mprovement Gap. International Journal of Operations & Production Management, Vol. No. , pp. - . [ ]Tse, D.K. and Wilton, P.C. : Models of Consumer Satisfaction Formation: An Extension. Journal of
Marketing Research, Vol. No. , pp. - .
[ ]Tzeng, G.(. and Chang, (.F. : Applying )mportance-Performance Analysis as a Service Quality Measure in Food Service )ndustry. Journal of Technology Management & Innovation, Vol. No. , pp. - . [ ]Venkataraman, N. and Ramanujam, V. : On Measurement of Business Performance in Strategy
Research: A Comparison of Approaches. Working Paper WP # - , M)T - Alfred P. Sloan School of Management.
[ ]Verhees, F. J.(.M. and Meulenberg, M.T.G. : Market Orientation, )nnovativeness, Product )nnovation, and Performance in Small Firms. Journal of Small Business Management, Vol. No. , pp. - .
[ ]Verhoef, P.C. : The Joint Effect of Relationship Perceptions, Loyalty Program and Direct Mailings on Customer Share Development. ERIM Working Paper, ERS- -MKT, Erasmus Universiteit, Rotterdam. [ ]Walden, D. . Kano s Methods for Understanding Customer-Defined Quality. Center for Quality of
Management Journal, Vol. No. , pp. - .
[ ]Williams, B., Coyle, J. and (ealy, D. : The Meaning of Patient Satisfaction: An Explanation of (igh Reported Levels. Soc Sci Med. , Vol. No. ,pp. – .
[ ]Wilkie, W.L. : Consumer Behavior, nd ed. New York: Wiley.
[ ]Witell, L.N. and Fundin, A. : Dynamics of Service Attributes: a Test of Kano s Theory of Attractive Quality. International Journal of Service Industry Management, Vol. No. , pp. - .
[ ]Witell, L. and Löfgren, M. : Classification of Quality Attributes. Managing Service Quality, Vol. No. , pp. - .
[ ]Xu, Y. and Goedegebuure, R. : Employee Satisfaction and Customer Satisfaction: Testing the Service-Profit Chain in a Chinese Securities Firm. Innovative Marketing, Vol. , No. , pp. - .
[ ]Yang, C.C. : The Refined Kano s Method and its Application. Total Quality Management, Vol. No. ,
[ ]Zelma, M. : The Product Quality of Polish Ski-Resorts: A Case Study of Silesian Skiers Requirements. Satisfaction, and Complaint. Tourism, Vol. No. , pp. - .
[ ]Zhao, M. and Dholakia, R.R. : A Multi-Attribute Model of Web Site )nteractivity and Customer Satisfaction. Managing Service Quality, Vol. No. , pp. - .
[ ]Zingheim, P.K. and Schuster, J. R. : Measuring and Rewarding Customer Satisfaction, )nnovation, and Work Engagement. WorldatWork Journal, Vol. No. , pp. - .
Table 4: The Validity of )mportance and Satisfaction of Service Provided vs. Kano Criteria of Customer Satisfaction
No SERVICE CRITERIA Cronbach's Alpha Mean
Importance Satisfaction Functional Dysfunctional Importance Performance Functional Dysfunctional
RELIABILITY
The admission procedures
. . . . . .
Process of teaching and learning
The timetable / discipline of learning schedule.
Teaching-learning process delivered
The cost of education
RESPONSIVENESS
The ability of lecturers
. . . . . .
The information delivered Response to students questions.
Staff attitudes
ASSURANCE
Knowledge and ability of teaching skills
. . . . . .
Skills of lecturers and experience of employees staff Service delivered
Security & trust
Appearances of employees Security in the learning proces Parking space availability and secureness
EMPATHY
Service provided and delivered
. . . . . .
Communication between students, the faculty, staff, and employees.
)mpression Attention
TANGIBLES
Facility and availability for learning infrastructure
. . . . . .
Extensive laboratory and completeness
Completeness and readiness infrastructure for teaching and learning
Cleanliness, neatness, and comfort of the classroom There are clean toilets
Table 5: )mportance and Satisfaction of Service Provided vs. Kano Criteria of Customer Satisfaction
No SERVICE CRITERIA
Expectation Experience Gap Analysis
Class Rank
Importance for improvement
ties
KANO CS DS
CS-DS Class Rank
Importance for Improvement
Priori-ties Importance Performance Functional Dysfunctional 1
st
MAX 2nd
MAX Better Worse
RELIABILITY 4.58 3.98 0.61 1.48 4.52 0.59 -0.75 -0.15
The admission procedures . 4.09 . rd No . . O M 0.71 -0.75 - . nd No
Process of teaching and learning 4.81 4.01 0.80 nd Yes . . O M 0.63 -0.84 - . nd Yes 8
The timetable / discipline of learning schedule. 4.76 3.86 0.89 nd Yes . . O M 0.60 -0.74 - . nd Yes 11
Teaching-learning process delivered 4.74 4.15 . nd No . . O M 0.68 -0.78 - . nd No
The cost of education . . 0.61 th Yes . . M O . - . -0.29 rd Yes
RESPONSIVENESS 4.46 3.92 0.54 1.69 4.41 0.48 -0.67 -0.19
The ability of lecturers 4.80 4.14 0.66 nd Yes . . O M 0.53 - . - . th Yes 9
The information delivered . 3.97 . rd No . . M O . - . -0.25 rd No
Response to students questions. . . . th No . . M ) . - . - . rd No
Staff attitudes 4.64 4.01 0.62 nd Yes . . O M 0.61 -0.75 - . nd Yes 12
ASSURANCE 4.42 3.89 0.53 1.62 4.57 0.52 -0.77 -0.25
Knowledge and ability of teaching skills 4.74 4.22 . nd No
. . O M 0.69 -0.81 - . nd No
Skills of lecturers and experience of employees staff . 4.00 . rd No . . O M 0.53 -0.79 -0.26 nd No
Service delivered 4.49 4.00 . nd No . . O M 0.57 -0.83 -0.26 nd No
Security & trust 4.51 . 0.73 st Yes . . M O . -0.88 -0.40 st Yes
Appearances of employees . 3.89 . rd No . . O M 0.56 - . - . th No
Security in the learning process 4.57 4.08 . nd No . . O M 0.50 -0.82 -0.32 nd No
Parking space availability and secureness . . 0.78 th Yes
. . M ) . - . -0.37 rd Yes
EMPATHY 4.34 3.86 0.48 1.61 4.49 0.49 -0.71 -0.22
Service provided and delivered 4.66 4.03 0.64 nd Yes . . O M 0.60 -0.77 - . nd Yes 10
Communication between students, the faculty, staff, and employees. . 3.86 . rd No . . M O . -0.74 -0.28 st No
)mpression . . . th No . . M ) . - . - . rd No
Attention . 3.89 . rd No . . O M 0.54 -0.86 -0.32 nd No
TANGIBLES 4.35 3.52 0.82 1.75 4.41 0.40 -0.72 -0.32
Facility and availability for learning infrastructure . . . th No . . M O . - . -0.31 rd No
Extensive laboratory and completeness 4.47 . 1.01 st Yes
. . M O . - . -0.31 rd Yes
Completeness and readiness infrastructure for teaching and
learning . .
0.76 th Yes . . M O . -0.76 -0.33 st Yes
Cleanliness, neatness, and comfort of the classroom 4.54 . 0.91 st Yes . . M O . - . -0.29 rd Yes
There are clean toilets . . 0.93 th Yes . . M O . -0.76 -0.37 st Yes
Table 6: Correlation between )mportance vs. Satisfaction
Reliability Responsiveness Assurance Empathy Tangibles
KUA
KED19 .330(**) .350(**) .345(**).311(**).371(**).396(**) .290(*) .268(*) .241(*) .254(*) .264(*) .279(*) .252(*) .402(**) .298(**) .372(**) .231(*) .303(**)
KED20 .241(*) .280(*) .252(*)
Table 7b: Correlations between Dysfunctional Questions vs. KANO Diagram
Reliability Responsive Assurance Empathy Tangibles