SEMANTIC WEB MINING ON TOPIC MAP USING GALOIS LATTICE
Gunawan *, Lukman Zaman PCSW †, Tri Kurniawan Wijaya ††, Novieana Dewi Sugianto ††† * Electrical Engineering Department, Faculty of Industrial Technology, Institut Teknologi Sepuluh Nopember
Kampus ITS Keputih, Sukolilo, Surabaya 60111, Indonesia † Computer Science Department, Sekolah Tinggi Teknik Surabaya
Ngagel Jaya Tengah 73-77, Surabaya 60284, Indonesia
email: [email protected]*, [email protected] †, [email protected] ††, [email protected] †††
ABSTRACT
The most challenging problem of internet technologies for future decade is how to save and arrange information in the web. Semantic web which was thought by Tim Berners-Lee provides framework to fulfill this requirement. Semantic web idea itself is to make the web more effective, so that the information can be accessed by machines, not only humans.
This research will discuss web mining on one of the semantic structures, XML Topic Map. The methods which will be used to mine XML Topic Map are conceptual classification, characterization, and clustering. Classification based on Formal Concept Analysis (FCA) and Galois connection. Galois lattice will group information as objects and make the connection between that information more semantic. Characterization consists of statistic calculation of every object. It is used to define the object profiles. The object profiles will be used as a model for topic map filtering. The clustering process is based on Galois lattice concept and will be used to generate cluster tree.
Keywords: Semantic Web, Formal Concept Analysis, Galois Lattice, Conceptual Classification, Clustering, Characterization.
1
INTRODUCTION
Recently, there are many websites and web-based applications. Web has a lot of information, unfortunately they are unstructured. Therefore, it is difficult to collect and understand the information within. Recent methods in web engineering are now developing a web application that is "separated" from conceptual model. This idea makes integration of different web applications more difficult.
It is important to build the technical framework in which applications and data functions can be represented between the different web applications. Semantic web provides the appropriate framework to meet this purpose. Semantic web is a “vision” to define the data on the web and connects the data each other with a way that can be used by an engine in different applications. In other
words, semantic web allows more cooperation between computer and user.
An example of the semantic web is XML topic map. A topic map illustrates the structure of knowledge and connecting it with the source of information. In addition, the topic map can be developed to help users find relevant information. Topic map is designed to handle organization and navigation issue of large information.
One of the mining process on the topic map is done by classification, characterization, cleaning up the data (through a definition of a profile), and clustering. Classification is based on Formal Concept Analysis (FCA) and Galois lattice algorithm. Characterization will conclude a profile and evaluate the relevant information. Clustering will improve the web navigation through related topics and then displayed in topics level based on the user requirements.
2
THEORY, ANALYSIS, DESIGN, AND
IMPLEMENTATION
2.1
Semantic Web
Semantic web is a collection of information that is connected to each other in a way that easily processed by machines. Semantic Web will become an efficient way in representing data on the World Wide Web, or act as a database that is connected with the links globally.
In general, the data/information that is stored on the web in the HTML file, is useful for a context, but can not be used for another context. The problem is that the data now would be difficult to use in large numbers, as there is no global system to determine how to publish the data so that it can be processed easily by everyone, for example: information about local sporting events, weather information, statistics League Baseball, and television. This information is displayed in many sites, but all of them in the form of HTML. The problem faced is that in some circumstances, it is difficult to use the data in a way that is desired by someone.
2.2
Topic Map
Topic map is a new ISO standard to describe the structure of knowledge and connecting it with the source of information. In other words topic map is a technique that allows for knowledge management.
The basic concept of a topic map is: topic, association, and occurrence.
Topic is the concept and the most fundamental part in a topic map. Topic has three kinds of characteristics, including names, occurrences, and roles in associations. A topic can be categorized based on its type.
An association is a relationship between two or more topic. Association between the topics can also be grouped according to type. Types of association are important part because they are a source of determining whether it was connected to the source of the information or not.
Occurrence is one or more sources of relevant information and connected with a topic in several ways. Occurrence in general is extern to the topic map document itself. An occurrence can be a monograph, which is provided for a specific topic, or an article on the topic in an encyclopedia. Occurrence may also be a picture or video that describes the topic, a comment about the topic, some form or another source where the information will be relevant to the subject in question.
The principle of the formation of a topic map applications in an distributed information system is to organize knowledge, information and data from one or more sources, and do so in a way that meets the user requirements. Some applications that can be applied using a topic map are: 1) information systems and business process information flows, 2) knowledge management systems, 3) intranets, 4) extranets, 5) portals and content of the source, 6) commercial information services, 7) document management systems, and 8) system documentation.
2.3
Galois Lattice and Mining Topic Map
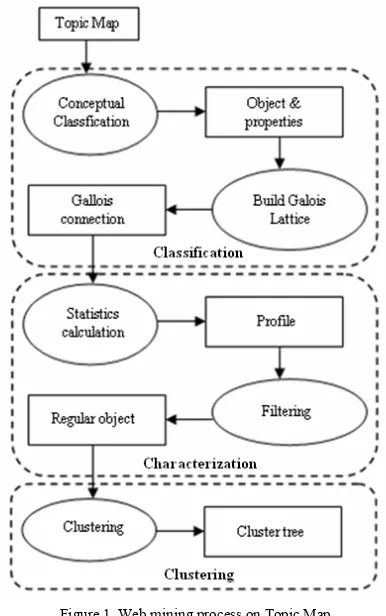
Topic map as one of the structure of semantic web will make the mining process more efficient. The process is shown in figure 1. The goal of the mining process on the topic map is to assist users in finding relevant information which can be made in three ways as follow:1. Evaluating the web site relevant to the user requirements based on semantic criteria.
2. Filter the topic map to find the main subject and to discard the less relevant topic.
3. Increasing the web navigation through the topic-related concept and then do some visualization through different level of detail.
2.3.1
Classification
The first step of the process is a conceptual classification algorithm based on Formal Concept Analysis (FCA) and the Galois Connection. FCA is a mathematical approach to the analysis of the data structure
that provides information. FCA will be used for the conceptual clustering. There are two terms that need to be notice: an object is a topic from the topic or association map and properties is the characteristics of the object.
Figure 1. Web mining process on Topic Map
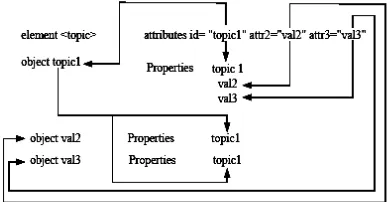
The first stage of the classification is form a new object and property. If there is an element that has an identifier, the new object is created. Meanwhile, the object properties associated with the object attribute value. Properties will be given a weight based on the level of the significance. The formation of objects and properties in the first stage is shown in figure 2.
Figure 2. Formation of the object and property of first step
The second phase is to add non-intrinsic properties by crossing the data. For an object O with a set of property P, each property P will be an object together with O as the property. Object’s properties are intrinsic properties. All the properties which are added from recursive process are also intrinsic properties. The establishment of the basic object and property in the second stage is shown in figure 3.
Figure 3. Formation of the object and property of second step
In the third stage, objects are grouped based on the existing Galois connection. Given two sets E and E’ (E contains a collection of objects and E’ is the set of object properties) and a binary relation R⊆ExE’ between these two sets. P(E) is the powerset of E and P(E’) is the powerset of E’. Individual elements in lattice are a partner, also called the concept and symbolized with (X, X’). A concept formed from two set X ∈ P(E) and X’ ∈ P(E’) such as:
X’=f(X)
where f(X)={x’∈E’| ∀x∈X,xRx’} X=f’(X’)
where f’(X’)={x∈E|∀x’∈X’,xRx’} Partial order in concept defined as follows: If C1=(X1,X’1) and C2=(X2,X’2), C1<C2 ⇔ X’1⊆X’2 ⇔ X2⊆X1
Partial order is used to describe the relationship between objects in the form of a graph called Hasse diagram. Hasse diagram is formed from the binary relationship between the object and property.
The example binary relation is shown in figure 4, where there is a unique relationship between Galois lattice with a binary relation. Each element in a lattice is symbolized with the pair (X, X’) obtained from the collection of X (E P(E)) and a set X’ (E P(E‘)).
Figure 4. Binary Relation R Matrix
In Galois lattice only pairs which are maximally widened is maintained in a hierarchy. Maximum expansion set idea established by the idea of a mathematical equation (closure) in the ordered set. Equation on the ordered set (E, =) on its applications h:EÆE has the following requirements:
1. ∀x ∀y, x=y ⇒ h(x)=h(y) 2. ∀x, h(x)=x
3. ∀x, h(h(x))=h(x)
Figure 5. Hasse diagram
Galois connection can be represented with a graph called the Hasse diagram. Example of the Hasse diagram is shown in figure 5. Hasse diagram represent generalization/specialization relations between the concepts.
There are many algorithms for drawing lattice and Hasse diagram, but the algorithm that will be discussed is based on Chein algorithms [5]. This algorithm is more bottom-up which was formed from bottom level to upper level. Algorithm starts with level 1 (L1), which contains a collection of pairs ({x}, f ({x})) for all x in E. Chein algorithm which is used to form lattice is shown in Algorithm 1.
Algorithm 1. Build Galois Lattice (Bulid G) [Initialization]
1 L1:={({x},f({x}))}for all x in E 2 k := 1
[form G pair]
3 WHILE ||Lk|| > 1 DO 4 Lk+1 := ∅
5 FOR ALL combination of pairs (X ,X’) and (Y, Y’) in Lk DO
6 Z’ := X’ ∩ Y’ 7 IF Z’≠∅ THEN
10 ELSE
Hasse diagram algorithm is proposed by Alaoui [1] who improved the Chein algorithm by adding a link between the pair using structures of the level. Algorithm which is formed Hasse diagram is shown in algorithm 2.
Algorithm 2. Build Hasse Diagram
[Algorithm to build the Hasse Diagram from the lattice pair. Building Hasse diagram also considered whether one is the part of another pair]
1 FOR each level from 1 to last level DO
In algorithm 2, Hasse diagram is formed through iterations by considering the pair G level 1 until the last level. G pair which is used to form the Hasse diagram is the pair which is not marked.
2.3.2
Characterization
Characterization of the topic map uses statistical calculations of each object. It is aimed to conclude a profile for the object. Statistical calculations based on the weight of each object in the topic map.
An object O is characterized by the vector with 6 components (A1…A6). The six components are defined as follows:
• A1: percentage concept of sub-lattice where objects appear in the list of extensions.
• A1: the maximum number of objects where O is grouped divided by the total of all objects.
• A3: the average number of objects where O is grouped divided by the total of all objects.
• A4: the maximum number of O’s properties that are used together with the object that is contained in S (the collection of objects that are grouped with an O
in one or more of the concept lattice), divided by the total of all objects.
• A5: the average number of O’s properties that are used together with other objects, divided by the total of all properties.
• A6: the number of occurrence of the object in the topic map divided by the number of occurrence of the object with the same type (topic or association). After the statistics are calculated for each topic and association, the object profile can be concluded. For N object, O1, O2, … ON, each component Ai for profile
vector P is calculated as in the equation:
∑
(where Oj.Ai is the component Ai on object j.)
Objects that are most relevant (regular object), which has many properties of many other objects will be maintained. Regular Objects are more important by the means of semantic compared with another objects.
The object which is regular is proved using the following conditions:
O.A1 ≥ Profile.A1 O.A2 ≥ Profile.A2
Condition is improved by adding a standard deviation. Calculation of standard deviation is:
N
Regular conditions can be changed using a coefficient C. Relation of the objects with regular coefficients C and the standard deviation is defined as follows:
O.A1 + C x std.dev.A1 ≥ P.A1 O.A2 + C x std.dev.A2 ≥ P.A2
Characterization phase will produce a list of regular items that are stable, where the topic map has been filtered to eliminate non-regular objects (objects that are less semantic). After this stage, there will be a new list of objects that are used as an input to Galois classification algorithm. Lattice then formed and the new statistics are calculated on the new object to create the new profile, and so forth until all items become regular.
2.3.3
Clustering
The next step after characterization is clustering. Clustering is based on the concept of Galois conceptual classification, which was developed using cluster tree.
Elections of the father of a concept based on the following hierarchy criteria:
amount of edge between the father and the lower bound of the lattice.
2. If the distance of a father of a node with the lower bound of the lattice is smaller than the other nodes, then the node is selected. The closer the distance from the lower bound of the lattice, the more semantic the concept is.
3. If there are multiple nodes on the minimum distance from the lower bound of the lattice, the amount of its properties’ weight which is contained in their intention are then compared. Node with the highest weight is selected.
4. If several fathers meet criteria-3, then choose ones that minimize the total number of branches in the tree.
5. If the criteria-4 has not been fulfilled, then several trees were built based on several possible fathers.
Some other criteria that are required can be counted from a cluster tree, such as lattice initial concept that is not selected for clustering process. In addition, level of the navigation, the distance between objects, and the similarity between objects can be analyzed. Depth of the tree shows the number of tree-level navigation is provided for the user. Cluster distribution at each level of separation can also provide important information for the user. If a cluster does not have a father, it means that it can not be generalized. In addition, the cluster that does not have any children means that its level is the most specific level.
The distance between two clusters is average or maximum or minimum distance between two objects (one object in each cluster). O1 and O2 given as two objects, P1 is a collection of properties owned by O1, whereas P2 is a collection of properties owned by O2. INTER also given as slices of P1 and P2, and the UNION as a combination of P1 and P2. The similarity of object O1 and O2 can be calculated as in the equation:
∑
whereas the distance O1 and O2 is defined as follow:
)
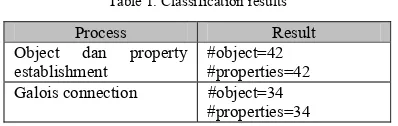
Testing is done on an XML topic map. Table 1 shows the results of the classification.
Table 1. Classification results
Process Result Object dan property
establishment
#object=42 #properties=42 Galois connection #object=34
#properties=34
In characterization phase we used two different values of coefficients to filter the same topic map. Sample results of the characterization are shown in table 2.
Table 2. Characterization results
Section A #regular object = 10
#iter=5 %object left=58 #regular object =27
Table 2 shows that in general, the statistics on the value of section A is larger when compared with the value of statistics on the section B. Section A and The number of objects left in section B is more than the number of objects left in section A, shows that the filtering level is different. Greater value of the coefficient gives larger restrictions for the regular object, consequently the less the number of objects that eliminated.
The results of clustering process can be seen in table 3. We also used two different coefficient values.
Table 3. Clustering results
Section A
between Obj1 & Obj2
similarity: 0.28571 distance: 96.5 …
between Obj1 & Obj2
similarity: 0.5 distance: 98.0
4
CONCLUSION AND FUTURE WORK
In this research we implement a semantic web mining on the topic map and then test it to an XML topic map. XML topic map as one of the structure of semantic web data is able to show the data of the web more structured than before. Therefore using the XML topic map, mining on the web will become easier. Conceptual classification stage evaluate topic map and display it in the form of objects and properties. In addition, establishment of the object and properties must be object oriented. The Galois connection indicates the generalization/specialization relations of the topic map objects. The object which has many properties is more specific than other object which has a few properties. Characterization topic map filter the data in topic map. Filtering is used to eliminate the data that is not relevant enough. The number of data eliminated depends on the value of coefficient (C), the greater the value of the coefficient, then the less the number of the data that are eliminated. Clustering topic map shows the topic map data in the different levels, indicating the generalization/specialization data cluster.
Based on our testing results, we recommended the following for further development: 1) Use several XML topic map to ensure the results of our mining process 2) Form more detail cluster representations, show that some cluster are more relevant than others, and display more detailed information of the cluster 3) develop semantic web mining using another semantic structure, such as XML and RDF.
REFERENCE
[1] Alaoui, H., Algorithmes de Manipulation du Treillis de Galois d'une Relation Binaire et Applications.Masters Thesis, Université du Québec à Montréal, 1992.
[2] Berners-Lee,Tim, Hendler, James, dan Lassila,Ora, The Semantic Web, Scientific American Inc, 2001. [3] Bharat, K. dan Broder, A., A technique for
measuring the relative size and overlap of public Web search engine. In 7th Int. WWW Conf
[4] Carpineto, C., Romano, G., Galois: An order-theoretic approach to conceptual clustering, Proc. Of the 10th Conference on Machine Learning, Amherst, MA, Kaufmann, 1993.
[5] Chein, M., Algorithme de Recherche des Sous-Matrices Premières d'une Matrice. Bull, Math. Soc. Sci.Math. R.S. Roumanie, 1969.
[6] Davey, B. A. dan Priestley, H. A,. Introduction to Lattices and Order, Cambridge: Cambridge University Press, 1992.
[7] Grand, Benedicte Le, Michel Soto, XML Topic Map and Semantic Web Mining, Laboratoire d'Informatique de Paris 6, 2002.
[8] Godin, R, Chau, T.-T., Incremental concept formation algorithms based on Galois Lattices,Computational intelligence, 1998.
[9] Harmelen, F. dan Fensel, D., Practical Knowledge Representation for the Web, IJCAI, 1999.
[10] International Organization for Standardization, ISO/IEC 13250, Information Technology-SGML Applications-Topic Maps, Geneva: ISO, 1998 [11] Malgrange, Y. ,Proceedings of the Deuxième
Congrès de l'AFCALTI,Gauthier-Villars, 1992. [12] Perkowitz, M. dan O. Etzioni,O., Adaptive Web
sites: an AI challenge, In IJCAI,1997
[13] Thuraisingham,Bhavani, Web Data Mining and Applications in Business Intelligence and Counter-Terrorism, 2003
[14] TopicMaps.Org XTM Authoring Group, XTM: XML Topic Maps (XTM) 1.0: TopicMaps.Org Specification, 3 March 2001.
[15] Wille, R., Restructuring Lattice Theory: an Approach Based on Hierarchies of Concepts, In I. Rival(Eds.), 1982.
[16] Wolf, Karl Erich, A First Course in Formal Concept Analysis, 1994.