This paper has been presented at Sriwijaya University Learning and Education-International Conference 2014. Faculty of Teacher Training and Education, Sriwijaya University, Palembang, May 16—18, 2014.
C1-501
THE DIFFERENCE OF LEARNING RESULTS BETWEEN
STUDENTS TAUGHT WITH EXPERIMENT AND
DEMONSTRATION BASED PROBLEM SOLVING METHODS IN
CLASS VII SMPN 5 CITY OF BENGKULU
Dedy Hamdani, Prisma Gita Azwar and Eko Swistoro
Physics Eduation Study Program, Departement of Mathematics and Sciences Education
Faculty of Teacher Training and Educations, Bengkulu University
Jalan Raya Kandang Limun Bengkulu
E-mail: dedyham @yahoo.com
Abstract
This research is aimed to: 1) determine the increase and the difference of learning results between students taught with experiment- and demonstration-based problem solving method 2) to determine students' responses to the learning method of problem solving. This research is a quasy research experiment. The research was conducted in three meetings with the population of class VII SMPN5 City of Bengkulu. The concept used is the concept of heat. By using simple random sampling technique, it was obtained that class of VII.C with 25 students as the experiment class and class of VII.G with 25 students as the control class. The research instruments used are learning result test and questionnaire of student’s responses. Based on the results of two independent samples t-test, it waas obtained that 1) the average N-gain value of the experiment classes is differ significantly from the average value of N-N-gain of the control classes, where tcal = 3.18 > t tab = 2.01 at significant level of 95 %, and 2) the average post-test value of
the experiment classes is differ significantly from the average post-test value of the control class where tcal = 2.06 > ttab = 2.01 at significant level of95%. It can be concluded that the increase and the difference
of learning results of the experiment class is higher than the control class. The response of students to the learning method of problem solving is very good, where the average percentage of student responses were 83.17% and 80.89% for the experimental class and the control class, respectively.
Key words: learning results, problem solving methods, experiment methods, demonstration methods, response of students
INTRODUCTION
In the learning of physics, students are trained and prepared to have the ability to think in solving problems. Learning method of problem-solving becomes very important, because students can understand if they are given the opportunity to solve the problems (Warimun, 2010; 7). The learning of physics at school is identic with the elusive material so the students are difficult to solve the problems given by the teacher. In order to for an application of the theory taught can be more understood by the students, the teacher should demonstrate the behavior of the process and the procedure of an object with respect to the subject matter of physics.
This paper has been presented at Sriwijaya University Learning and Education-International Conference 2014. Faculty of Teacher Training and Education, Sriwijaya University, Palembang, May 16—18, 2014.
C1-502
Solving problems is an individual or group effort to find answers based on the understanding that has been previously owned in order to meet the demands of the situation are not familiar. (Krulik & Rudnick, 1996; Carson, 2007) in Warimun (2010: 7). In the experiment-based problem solving methods, the teachers act as mentors and observe to the process of the student in solving the problems, so that the teachers know the students' difficulties in solving problems, whether in the stage of understanding the problem, planning problems, or look at the results obtained from the lab. Therefore, the teachers not only observe the end result, but the teachers also observe and appreciate other stages acquired by the students.
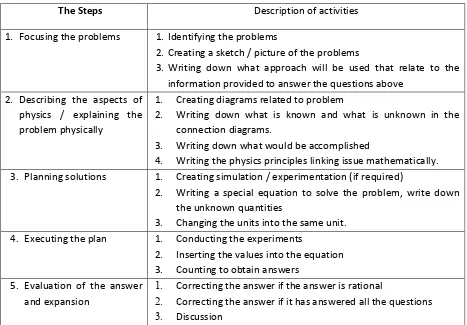
The steps of problem solving method at the University of Minnesota consists of five steps. The steps shown in Table 1 (Kyurshunov, 2005; Yousuf & Chaveznava, 2006) in Warimun (2010).
Tabel 1. The steps of problem solving method
The Steps Description of activities
1. Focusing the problems 1.Identifying the problems
2.Creating a sketch / picture of the problems
3.Writing down what approach will be used that relate to the information provided to answer the questions above
2. Describing the aspects of physics / explaining the problem physically
1. Creating diagrams related to problem
2. Writing down what is known and what is unknown in the connection diagrams.
3. Writing down what would be accomplished
4. Writing the physics principles linking issue mathematically. 3. Planning solutions 1. Creating simulation / experimentation (if required)
2. Writing a special equation to solve the problem, write down the unknown quantities
3. Changing the units into the same unit. 4. Executing the plan 1. Conducting the experiments
2. Inserting the values into the equation 3. Counting to obtain answers
5. Evaluation of the answer and expansion
1. Correcting the answer if the answer is rational
2. Correcting the answer if it has answered all the questions 3. Discussion
According to Djamarah (1995) in Putra (2013: 132) the experiment method is a way of presenting the lesson when the students conduct the experiments by experiancing and proving what he learn about by hiself. To do the experiments, the students need experimental device in the form of equipment and materials as well as the manual practice experiments. Experiment method is used when all the students are expected to prove or obtain information and data to solve the problems (Supriyati and Anitah, 2007: 9:43).
This paper has been presented at Sriwijaya University Learning and Education-International Conference 2014. Faculty of Teacher Training and Education, Sriwijaya University, Palembang, May 16—18, 2014.
C1-503
another study sources (an expert in the topic to be demonstrated). Demonstration method is a teaching method of the teachers, strangers or human resources or student who intentionally asked to show the original object, mock (vice the original object) or a process. In this demonstration method, students' attention can be foucese and the students participate actively if the demonstrations continued with experiments (Supriyati and Anitah, 2007: 4:19).
This research is aim to look at the differences of learning results between students taught with experiment- and demonstration-based problem solving methods on the concept of heat in class VII SMPN 5 city of Bengkulu.
RESEARCH METHODS
This research is a quasi-experiment study. A quasi-experiment research is a type of research that has the control group but can not fully function to control external variables that affect the execution of the experiment (Sugiyono: 2009). In this research, the experiment class is the class that follows the experiment-based problem solving methods while the control class is the class that follows the demonsration-based problem solving method.
This research was conducted in class VII SMPN 5 city of Bengkulu. The research was conducted in the second semester of academic year 2013/2014. The study population was all students of class VII SMPN 5 city of Bengkulu which consisted of 275 students in 11 classes. Samples were randomly selected to represent the entire population to be treated as the experiment class and the control class, so it was obtained that class VII.C as the experiment class and class VII.G as the control class.
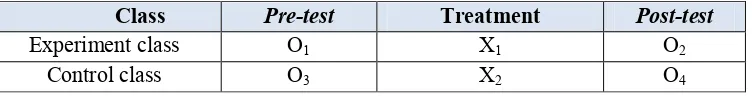
This research was conducted using the nonequivalent control group design (see table 1), where, X1 is experiment-based problem solving method, X2 is a demonstration-based problem solving method, O1 is the pre-test vale for the experiment class, O2 is the post-test value for the experiment class, O3 is the pre-test value for the control clasa and O4 is the post-test value for the control class.
Table 2. Design of research
Class Pre-test Treatment Post-test
Experiment class O1 X1 O2
Control class O3 X2 O4
There are two instruments used in this research. The first instrument is the learning results test and a second one is the questionnaire test to measure student’s responses to the learning method of problem solving. Learning results test instrument consists of pre-test and post-test. There are four learning results data obtained from this, there are the pre-test value for the experiment class (O1), the post-test value for the experiment class after following the learning method of problem solving (O2), the pre-test value for the control class (O3), and the post-test value for the control class (O4) after following the learning method of problem solving. This data can then be tested for normality to see if the data obtained is normally distributed or not. If the data are normally distributed than the t-test can be used, but if the data are not normally distributed the non-parametric test will be used.
T-test of two independent samples was calculated by the formula:
This paper has been presented at Sriwijaya University Learning and Education-International Conference 2014. Faculty of Teacher Training and Education, Sriwijaya University, Palembang, May 16—18, 2014.
C1-504
where X1 is the average score of group 1, X2is the average score of group 2, n1 and n2 are the
number of students for group 1 and group 2, respectively,
s
12ands
22are the variance for group 1 and group 2, respectively (Sudijono 2010 ). If the value of tcal > ttab at significance level of α = 0.05 and degrees of freedom (df) = n1 + n2 - 2, then Hi is accepted while Ho is rejected. While if the value of tcal > ttab then Hi is rejected and Ho accepted.The questionnaire is a data collection technique done by giving a set of questions or a written statement of the respondent to be answered (Sugiyono, 2012:142). The questionnaire was administered to determine student's responses to the three indicators, namely 1) show the seriousness and implementation steps in the learning method of problem solving, 2) show the interest in laboratory experiments using the tool in the learning method of problem solving, and 3) show a sense of excitement to the learning method of problem solving. The questionnaire given to the students after participating in learning.
RESULTS AND DISCUSSIONS
Results
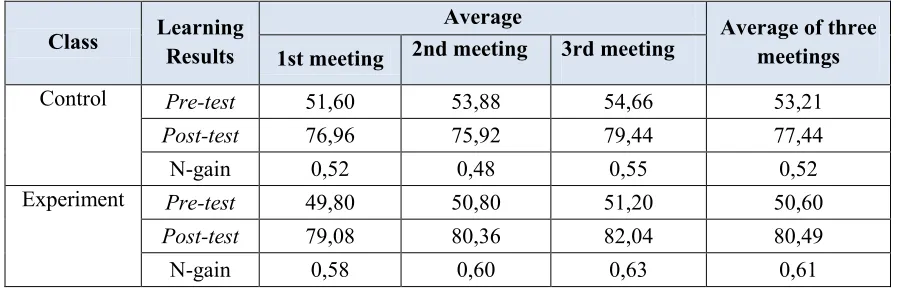
Learning results of both the experiment class and the control class can be seen in table 3. The average pre-test value of the control class at the first meeting, second and third are 51.60; 53.88 and 54.66, respectively, with an average of three meetings is 53.21. The average post-test value of the control class at the first meeting, second and third are 76.96; 75.92 and 79.44, respectively, with an average of three meetings is 77.44. The average N-gain value of the control class at the first meeting, second and third are 0.52; 0.48 and 0.55, respectively, with an average of three meetings is 0.52.
The average pre-test value of the experiment class at the first meeting, second and third are 49.80; 50.80 and 51.20, respectively, with an average of three meetings is 50.60 The average post-test value of the experiment class at the first meeting, second and third are 79.08; 80.36 and 82.04, respectively, with an average of three meetings is 80.49. The average N-gain value of the experiment class at the first meeting, second and third are 0.58; 0.60 and 0.63, respectively, with an average of three meetings is 0.61.
Table 3. The average pre-test, post-test and N-gain data for both the experiment and the control classes
Class Learning Results
Average Average of three
meetings 1st meeting 2nd meeting 3rd meeting
Control Pre-test 51,60 53,88 54,66 53,21
Post-test 76,96 75,92 79,44 77,44
N-gain 0,52 0,48 0,55 0,52
Experiment Pre-test 49,80 50,80 51,20 50,60
Post-test 79,08 80,36 82,04 80,49
This paper has been presented at Sriwijaya University Learning and Education-International Conference 2014. Faculty of Teacher Training and Education, Sriwijaya University, Palembang, May 16—18, 2014.
C1-505
From table 3, it can be seen that the average pre-test value of the experiment class is smaller than the control class. The average post-test value of the experiment class is larger than the control class. So that the average N-gain value of the experiment class is greater the control class.
Normality test is performed using chi square test (X2). Criteria for a normal distribution of data is if X2cal < X2tab means that the data are normally distributed. Conversely, if X2cal < X2tab means that the data are not normally distributed. The calculation result of normality test of pre-test, post-test and N-gain for both classes can be seen in table 4. Based on the data analysis, it was obtained that X2cal for each data are smaller than X2tab at 95% of significance level, which means that the data is normally distributed.
Table 4. Normality test for both the experiment and the control classes
Class Data χ2cal χ
2
tab Status
KONTROL
Pre-test 5,71 7,815 Normal
Post-test 4,28 7,815 Normal
Gain 7,20 7,815 Normal
EXPERIMENT
Pre-test 6,94 7,815 Normal
Post-test 5,88 7,815 Normal
Gain 6,28 7,815 Normal
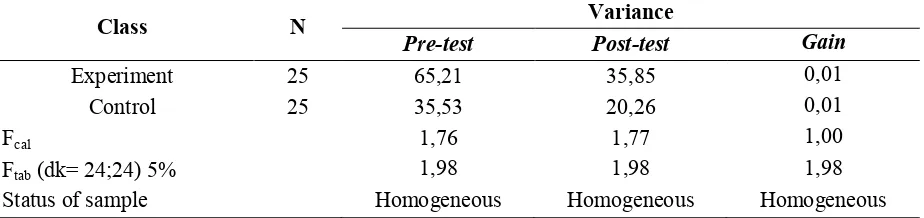
Homogeneity test was performed to determine whether the sample came from a homogeneous variance. The sampel said to be homogeneous if the Fcal < Ftab but if Fcal > Ftab then the sample is said not homogeneous. The calculation results of the variance of both classes can be seen in table 5. Based on table 5, it can be concluded that the variance of two classes is homogeneous. Since normality and homogeneity test on both classes showed that the data are normally distributed and homogeneous, then the statistics used are parametric statistics using t-test of two independent samples.
Table 5. Homogeneity test for both the experiment and the control classes
Class N Variance
Pre-test Post-test Gain
Experiment 25 65,21 35,85 0,01
Control 25 35,53 20,26 0,01
Fcal 1,76 1,77 1,00
Ftab (dk= 24;24) 5% 1,98 1,98 1,98
Status of sample Homogeneous Homogeneous Homogeneous
Hypothesis test is done to see the difference in student’s learning results between the control and experiment classes. The data to be hypothesis tested is the average post-test value of both the control and experiment classes. The average post-test hypothesis test is performed using t-test of two independent samples, where if tcal > ttab then H0 is rejected and H1 is accepted and vice versa where if tcal < ttab then H0 is accepted and H1 is rejected. The analysis results of t-test of two independent samples can be seen in table 6.
This paper has been presented at Sriwijaya University Learning and Education-International Conference 2014. Faculty of Teacher Training and Education, Sriwijaya University, Palembang, May 16—18, 2014.
C1-506
Based on tTable 6, it could be seen that for the pre-test results, tcal is smaller than ttab. It indicates that the pre-test learning results did not differ significantly. Homogeneity test results also reinforce that both classes are homogeneous class. So, it can be concluded that both classes have the same ability before treatment given. The learning result of the experiment class is higher than the control class. Improved learning results can be seen from the N-gain values obtained from each class, where the observation of learning results of the experiment class is higher than the control class. Based on the comparing the increase in learning results between the N-gain of two classes, it is concluded that the N-gain value of the experiment class is better than the control class. Thus, it can be concluded that the difference in the N-gain value of two clasees is significantly different.
Discussion
Based on data on the initial conditions, both samples have a homogeneous data. The average pre-test value of the experiment class was 50.60 while the average value of the pre-test control class is 53.21. By homogeneity test, it is found that of Fcal < Ftab, which means that both classes have the same data variance and the same initial state as well.
After learning with experiment-based problem solving conducted to the experimental class, the post-test results average obtained was 80.49. In the control class taught demonstration-based problem solving, the average post-test results obtained was 77.44. Based on t-test of the independent samples showed that tcal > ttab with degrees of freedom (df) is 48 in the 5% error level. This means that there are significant differences between the experiment class and the control class. The test results also confirmed this difference by the average N-gain value of both classes, which indicates that the increase of leraning results of the experiment class is better than the control class.
This paper has been presented at Sriwijaya University Learning and Education-International Conference 2014. Faculty of Teacher Training and Education, Sriwijaya University, Palembang, May 16—18, 2014.
C1-507
learned. In the experiment class, the students themselves are actively conducting the experiments. The student’s activitity in conducting experiments to solve the problem gives a better effect on learning results. This is because the student do experience and prove the results of experiments by themselves. In addition to data of the learning results of the two classes, the data is also taken in the form of questionnaire responses of students towards learning with problem solving methods. Analysis of the questionnaire responses of students seen for three indicators namely 1) show the seriousness and implementation steps in the learning method of problem solving, 2) show the interest in laboratory experiments using the tool in learning method of problem solving, and 3) show a sense of excitement to the learning method of problem solving.
At an indicator that shows the seriousness and implementation steps in the learning method of problem solving, the experiment class received as much as 88.00% of contributions while the contribution of the control class is 87.17%. Further indicators that show interest in laboratory experiments using the tool in learning problem solving contributed 75% in the experiment class and 82% in the control class. Finally, indicators that show a sense of excitement to the learning problem solving method contributed 86.5% for the experiment class to 73.5% for the control class. Overall, the average percentage of the three indicators of the student questionnaire responses was 83.17% for the experimental class and 80.89% for the control class.
Overall, students of both classes respond very well to learning of problem solving method, and students also showed a sense of excitement towards learning physics through problem solving method, and show interest in laboratory experiments using the tool, and students demonstrate the seriousness and implementation steps in the learning methods of problem solving.
CONCLUSION AND RECOMMENDATIONS
Based on the data analysis of the research and discussion, the conclusions of this research are: 1) There is the increasing in student’s learning results of both the experiment and the control classes. It can be seen from the N-gain value obtained by two classes. The increasing in student’s learning result of the experiment class is higher than the control class. 2) There are significant differences between learning results of student’s of the experiment class with the control class. It can be seen from the difference in learning results between the experiment class and the control class, where learning results of students of the experiment class is higher than the control class. 3) The response of students towards learning methods of problem solving in SMPN 5 city of Bengkulu City is very good. Students of both of the experiment class and the control class show good feelings toward physics learning through problem solving method, students show interest in laboratory experiments using the tool, and students demonstrate the seriousness and implementation steps in the learning method of problem solving.
This paper has been presented at Sriwijaya University Learning and Education-International Conference 2014. Faculty of Teacher Training and Education, Sriwijaya University, Palembang, May 16—18, 2014.
C1-508 REFFERENCES
Warimun, E.S. (2010). Pengembangan Kemampuan Problem Solving Melalui Pembelajaran Topik
Optika Bagi Mahasiswa Calon Guru Fisika. Disertasi tidak diterbitkan. Bandung: SPS
UPI.
Supriyati,Y & Anitah, S.W. (2007). Strategi Pembelajaran Fisika. Jakarta: Universitas Terbuka. Sudjiono, Anas. (2010). Pengantar Statistik Pendidikan. Jakarta: Rajawali Pers
Sugiyono. (2009). Statistika untuk Penelitian. Bandung : Alfabeta.