VOLUME 9 | Proc1 | 2014 | S409 8th INSHS International Christmas Sport Scientific Conference, 5-7 December 2013. International Network of Sport and Health
Science. Szombathely, Hungary
Hassan, A. (2014). Team Handball World Cup Championship 2013 - Analysis Study. J. Hum. Sport Exerc, 9(Proc1), pp.S409-S416. The world cup of men’s handball team championships was analysed using data from all matches in order to determine tactical differences at the elite level. The first aim of this study was to conduct a technical analysis of current handball and to determine factors related to success in this sport discipline. The second aim was to compare the data of first eight teams with other next teams. An analysis of the performance of the participating teams’ video tapes and CD’s, in the collection of matches, was completed on all the teams taking part in the World Cup Handball Championship 2013. This technical analysis also used cumulative statistics from the International Handball Federation. There were 24 teams in this competition, these were classified participating 2013 into three groups according to the final classification of the winning teams. Variables were identified relating to results of matches (win or lose), and data collection of games was completed by selecting certain codes for each variable of the study variables. The variables included:- Total shots, Total successful shots, Breakthroughs, Breakthroughs successful, Fast break successful, Fast breaks, Red C, Yellow C, 2Min, Steal, Blocked, Assist, Tech. Faults, 6M shots, 6M successful shots, Wing shots, Wing successful shots, 9M shots, 9M successful shots, 7M shots, 7M successful shots. The technical variables used to compare the teams included: the average number of shots, the efficiency of shots, the efficiency of breakthroughs, fast break goals per team, the efficiency of fast breaks, the average number of 7M shots, the efficiency of 7M shots, the average number of 6M shots, the efficiency of 6M shots, the average number of 9M shots, the efficiency of 9M shots, the average number of wing shots, the efficiency of wing shots, offence (The average number of tech faults, the efficiency of tech faults, the average number of assist, the efficiency of assist), defense ( The average number of blocked, the efficiency of the average number of steals, the efficiency of steals), and penalties (2M, yellow card, red card). This technical analysis used cumulative statistics from the International Handball Federation. ANOVA revealed significant differences between the first eight teams in the World cup championships 2013 and their counterparts in the other two groups (group two, teams from 9-16 and group three, teams from 17-24) in terms of several technical variables. The results showed that the above various affected the ranking in favor of the world cup teams in significant international teams. Key words: MEN, HANDBALL, ANALYSIS.
1Corresponding author. Department of Sports Training, Mansoura University, Egypt
E-mail: [email protected].
8th INSHS International Christmas Sport Scientific Conference, 5-7 December 2013. International Network of Sport and Health Science. Szombathely, Hungary.
JOURNAL OF HUMAN SPORT & EXERCISE ISSN 1988-5202 © Faculty of Education. University of Alicante
S410 | 2014 | Proc1 | VOLUME 9 © 2014 University of Alicante
INTRODUCTION
The new methods of training are an educational process that aims at developing the player’s potentialities to reach the highest levels of performance through integrity and enhancement.
The higher the level of performance is the more the need for modern training is required. The plan for championship are based on the precise planning that aims at developing the performance of the players and the teams, which in turn helps achieve the objective behind participating in international championships and score high.
Careful planning for championship necessitates the study and the analysis of the level of the players, teams and levels in order to choose players with certain qualifications that enable them to participate to the results, test figures and level studies (Abbas, 2005).
Team Handball as one of the most popular sports games belongs to a set of very complex activities of sport dominated by cyclic and acyclic structures of the movement. It takes place in the intermittent stress mode. During training and competitions, basic motor skills are focused on. Contemporary approach to the basic characteristics of handball players and the specific requirements and characteristics of handball game require science- based analysis and insights that can be reached only on the basis of scientific research projects (Bjelica, 2007).
Handball is characterized by continues monitoring and focusing in addition to the readiness to respond in all situations. This requires individual and team abilities to cope with the different situation in the match. These situations are distinguished by the rapid change in play tactics to enhance the motor skills of players to win (Morsi, 1984).
The basic element to win is the right use for basic motor skills, and individual capabilities that include bodily, physical skill, tactics and psychological aspects of the players. The untrained player cannot control neither the ball nor his movements (Aloulily, 1985; Hassan, 1994).
Handball depends on varied and changing game situations as performance conditions are not stable due to its connection with the opponent's performance and changing court situations. These situations oblige players to use complex motor patterns with the ball that include performing consecutive complex motor skills so, it is important for training to be very similar to game situations. The player should acquire various forms of performance to choose the best form according to actual game situations. This increases the player's ability to feint and maneuver without being surprised by situations that he\she was not trained on. There are clear differences among the international teams in the quality and quantity of performance skills which provide them with abilities to achieve high levels in world championship.
VOLUME 9 | Proc1 | 2014 | S411 Match analysis is one of the measurement as it allows the levels to be measured quantitatively according to a specific standard, this gives a chance for collecting data about the number of players and their levels which help in establishing a comparison between the individual and himself or the individual and his mate which means evaluating the differences between different teams (group differences) it’s worthy to note that match analysis is an educational method for monitoring teams and showing ways of developing them in a scientific way. This helps achieve success and reach the aims of the teams (Hassanein & Abdel-Moneim, 1986).
Monitoring and observation are of extreme importance. They take the shape of video films and match analysis which are based on the methods of analysis, the aim of analysis, case study, number of observed items, data size and type, tools and equipment, number of analyzed individuals and proficiency of analysis conductors (Kemal-Darwesh et al., 2002).
This goes with the new trends of handball training in the 21st century that includes player’s individual performance study in all positions, team performance analysis and those of video films in learning and monitoring handball motor skills.
Through analyzing many local and international champions, the researcher noticed that some teams enjoyed high levels while others did not. Also the researcher found that there was a clear difference in the repetition of the skills and in the place of their usage in the play court which is closely related to a positive or negative score for these teams
MATERIAL AND METHODS
The world cup of men’s handball team championships 2013 was analyzed using data from all matches in order to determine tactical and technical differences at the elite level. The first aim of this study was to conduct a technical analysis of current handball and to determine factors related to success in this sport discipline. The second aim was to compare the data of first eight teams with other next teams.
An analysis of the performance of the participating teams’ video tapes and CD’s in the collection of matches, was completed on all the teams taking part in the World Cup Handball Championship 2013. This technical analysis also used accumulative statistics from the International Handball Federation. There were 24 teams in this competition; they were classified into three groups according to the final classification of the winning teams. Variables were identified relating to results of matches (win or lose), and data collection of games were completed by selecting certain codes for each variable of the study variables.
RESULTS AND DISCUSSION
The variables included: Total shots, Total successful shots, Breakthroughs, Breakthroughs successful, Fast break successful, Fast breaks, Red C, Yellow C, 2Min, Steal, Blocked, Assist, Tech. Faults, 6M shots, 6M successful shots, Wing shots, Wing successful shots, 9M shots, 9M successful shots, 7M shots, 7M successful shots.
S412 | 2014 | Proc1 | VOLUME 9 © 2014 University of Alicante
efficiency of wing shots, offence (The average number of tech faults, the efficiency of tech faults, the average number of assist, the efficiency of assist), defense ( The average number of blocked, the efficiency of the average number of steals, the efficiency of steals), and penalties (2M, yellow card, red card).
Table 1. Values of variables analysis and groups P values also shown
Variables F P
*. The mean difference is significant at the 0.05 level.
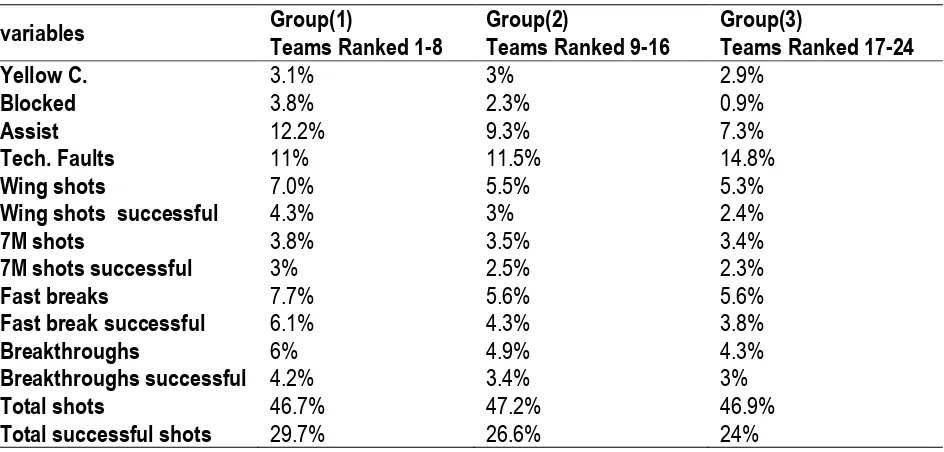
Table 2. Percentage values for variables between groups per match.
VOLUME 9 | Proc1 | 2014 | S413 This technical analysis used cumulative statistics from the International Handball Federation. ANOVA revealed significant differences between the first eight teams in the World cup championships 2013 and their counterparts in the other two groups (group two, teams from 9-16 and group three, teams from 17-24) in terms of several technical variables. The results showed that the above variables affected the ranking in favor of the world cup teams in international teams.
This significance lies in 14 types of variables. In 7 type’s variables there was no positive significant differences, the 14 variables with statistical significant difference are as follows:
1- Blocked: this is skilled performance in which the defender tries to obstruct the ball aimed at the goal. Group (1) achieved 3, 8% for every match, on the other side the rate decreased to .094 %. 2- Assist: this is the defender offer, to his team mates while attacking the player handling the ball.
Group (1) achieved 12.2% and this decreased gradually till it reached 7.3 % in group (3). It’s known that when this spill is high the team’s results become high too.
3- Tech Faults: teams with no good preparation commit this mistake which results in that the attackers lose the ball. Group (3) rate was 14.8% per match in comparison with highly trained teams in group (1) with the rate of 11%.
4- Wing shots: it’s rate increased in the highly classified teams per match. Wing shots successful achieved less in the percentage of wing shots number in general and wing shots successful in particular. The decreased rate reached 5.3% with success rate 2.4%.
This explain the reason that less classified teams lost their matches due to lack of wing shots and the unsuccessful wing shots which indicates the poor training level and need for more skill development.
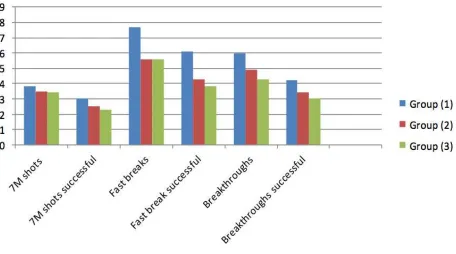
5- 7M shots: it’s a vital factor in scoring goals. The team getting 7M shots and scouring will achieve high results. In comparing the three groups we find that group (1) achieved the highest rate of 7M shots 3.8 % per match and 7M shots successful rate was 3%. The rate decreased generally till it reached 3.4% in group (3) and 7M shots successful rate was 2.4%. This indicates a defect in players’ preparation for shots and necessity to be trained on.
6- Fast break: most studies point out its effectiveness in match results. It’s one of the best attacking tactics offered by coaches most of the time. The previous table shows the highly classified group (1) repeated the tactics of fast break with the rate 7.7% per match and fast break successful rate was 61% per match. Group (2) and (3) are equal in implementing fast breaks with the rate of 5.6% but group (2) achieved high rate of fast breaks successful which is 4.3% in comparison with group (3) rate which is 3.8%. These explain the low world classification of group (3) teams which couldn’t win almost all of their matches.
7- Breakthroughs: this is the third way in scoring goals. It’s the stage before goal shots. The team succeeding in applying breakthroughs will have ability chance for scoring goals and wining. The previous table indicates that group (1) achieved the higher percentage of breakthroughs with the rate of 6% and success rate 4.2%. The rate decreased till it reached with group (3) breakthroughs 4.3 % and breakthroughs successful 3%.
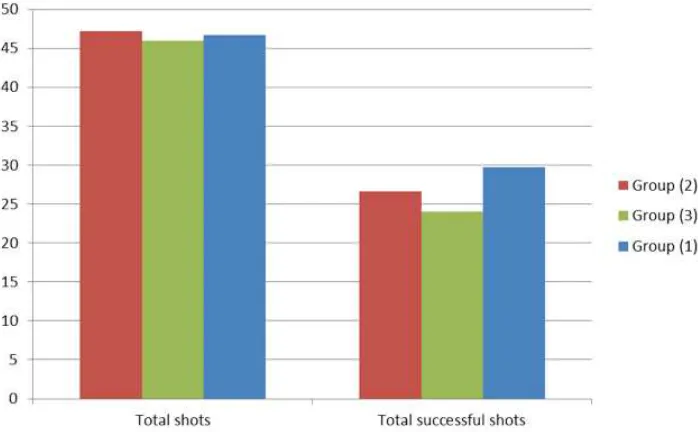
8- Total shots: although the three groups were almost similar in total shots with the rate between 46.7% and 47.2% but its effectiveness differed and the successful rate of group (1) was 29.7%. Group (2) 26.6% and group (3) 24%.
S414 | 2014 | Proc1 | VOLUME 9 © 2014 University of Alicante
Figure 1. Percentage values for variables between groups per match
VOLUME 9 | Proc1 | 2014 | S415 Figure 3. Percentage values for total shots and successful total shots between groups per match
CONCLUSIONS
Teams are classified according to win\lose criterion during championships. Through the analysis of handball world cup 2013. It was clear that variables affected the ability of the teams to score goals and to win matches. The fastest statistical data with direct significance are: Blocked - Assist – Tech. faults – wing shots – 7m shots – Fast breaks –Breakthroughs – Total shots.
The rate of implementing them affects the results, so the young and novice players must be well prepared and international teams should focus on developing these variables to ensure best results and better performance.
REFERENCES
1. Abbas, I. (2007). Planning and scientific foundations for the construction and preparation of the team in the group games, facility knowledge, Alexandria, pp.44.
2. Aloulily, M. (1995). Handball Training, Education. Technique, Cairo. pp.210.
3. Bjelica, D. (2007). Teorijske osnove tjelesnog i zdravstvenog obrazovanja. Podgorica: Crnogorska sportska akademija.
4. Darwesh, K., Abbas, I. & Morsi, K. (2002). Measurement and Evaluation and analysis of the game in handball “theories, applications". The center of the book for publication, Edition 1, Cairo. pp.273. 5. Hassan, A. (2009). Analytical Study for offensive and defensive construction tactical and its relation
with results of handball world Cup. PhD Theses, Faculty of Physical Education, Mansoura University, Egypt.
6. Hassan, A. (2005). Analytical study for offensive complex motor performances and its relation with results of world cup handball matches. Master Theses, Faculty of Physical Education, Mansoura University, Egypt, pp.146.
S416 | 2014 | Proc1 | VOLUME 9 © 2014 University of Alicante
8. Hassan, A. & Hossen, A. (2013). Improving the Performance of Complex Motor Skills in Egyptian Children Team Handball by Using Hypermedia. (5th International Conference on Education and New Learning Technologies, July 1st-3rd, Barcelona, Spain.
9. Hassan, Y. (1994). An analytical study of the Tactical Offensive Formations, which ends a Wings and Backs Central Handball. Journal of Studies and Research, University of Alexandria, pp.64. 10.Hassanein, M. & Abdel-Moneim, H. (1986). Methods of Analyzing the Match in Volleyball. First
Edition, Dar Arab thought, Egypt. pp.46.
11.Men's Handball World Championship Spain. (2013, February). http://www.ihf.info/IHFCompetitions/WorldChampionships/MensWorldChampionships/MensHandba llWorldChampionshipSpain2013/tabid/6073/Default.aspx
12.Morsi, K. (1984). Some of the offensive variables and their impact on the results of matches, scientific production. Faculty of Physical Education for Boys, Helwan University.