Impact of an Intensive Lifestyle
Intervention on Use and Cost
of Medical Services Among
Overweight and Obese Adults
With Type 2 Diabetes: The Action
for Health in Diabetes
Diabetes Care 2014;37:2548–2556|DOI: 10.2337/dc14-0093
OBJECTIVE
To assess the relative impact of an intensive lifestyle intervention (ILI) on use and costs of health care within the Look AHEAD trial.
RESEARCH DESIGN AND METHODS
A total of 5,121 overweight or obese adults with type 2 diabetes were randomly assigned to an ILI that promoted weight loss or to a comparison condition of diabetes support and education (DSE). Use and costs of health-care services were recorded across an average of 10 years.
1Department of Biostatistical Sciences, Wake
Forest School of Medicine, Winston-Salem, NC
2
Weight and Eating Disorder Program, Univer-sity of Pennsylvania, Philadelphia, PA
3Department of Epidemiology and Prevention,
Wake Forest School of Medicine, Winston-Salem, NC
4
Johns Hopkins School of Medicine, Baltimore, MD
5Pennington Biomedical Research Center, Baton
Rouge, LA
6
Southwest American Indian Center, National Institute of Diabetes and Digestive and Kidney Diseases, Phoenix, AZ
7Southwest American Indian Center, National
Institute of Diabetes and Digestive and Kidney Diseases, Shiprock, NM
8
Weight Control and Diabetes Research Center, Brown Medical School/The Miriam Hospital, Providence, RI
9National Institute of Diabetes and Digestive and
Kidney Diseases, National Institutes of Health, Bethesda, MD
10Department of Medicine, Baylor College of
Medicine, Houston, TX
11
Roybal Comprehensive Health Center, Los Angeles, CA
12Centers for Disease Control and Prevention,
Atlanta, GA
13University of Texas Health Science Center at
San Antonio, San Antonio, TX
14
Anschutz Health and Wellness Center, University of Colorado Health Sciences Center, Aurora, CO
15Department of Clinical Epidemiology, Joslin
Diabetes Center, Boston, MA
16
Diabetes Unit, Department of Health and Physi-cal Activity, University of Pittsburgh, Pittsburgh, PA
17Division of Epidemiology and Community
Health, University of Minnesota, Minneapolis, MN
18
Department of Preventive Medicine, University of Tennessee Health Sciences Center, Memphis, TN
19Department of Medicine, University of
Wash-ington, Seattle, WA
20Preventive Medicine, University of Alabama at
Birmingham, Birmingham, AL
21Massachusetts General Hospital, Boston,
MA
22
Division of and Department of Medicine, St. Luke’s-Roosevelt Hospital, New York, NY
23Division of Internal Medicine, University
of Colorado Health Sciences Center, Aurora, CO
Corresponding author: Mark A. Espeland, [email protected].
Received 12 January 2014 and accepted 6 March 2014.
Clinical trial reg. no. NCT00017953, clinicaltrials.gov.
This article contains Supplementary Data online at http://care.diabetesjournals.org/lookup/ suppl/doi:10.2337/dc14-0093/-/DC1.
†Deceased.
© 2014 by the American Diabetes Association. Readers may use this article as long as the work is properly cited, the use is educational and not for profit, and the work is not altered. See accompanying articles, pp. 2424,
2442, and 2557.
Mark A. Espeland,1Henry A. Glick,2 Alain Bertoni,3Frederick L. Brancati,4,† George A. Bray,5Jeanne M. Clark,4 Jeffrey M. Curtis,6,7Caitlin Egan,8 Mary Evans,9John P. Foreyt,10 Siran Ghazarian,11Edward W. Gregg,12 Helen P. Hazuda,13James O. Hill,14 Don Hire,1Edward S. Horton,15 Van S. Hubbard,9John M. Jakicic,16 Robert W. Jeffery,17Karen C. Johnson,18 Steven E. Kahn,19Tina Killean,6,7 Abbas E. Kitabchi,18William C. Knowler,6,7 Andrea Kriska,16Cora E. Lewis,20
Marsha Miller,14Maria G. Montez,13 Anne Murillo,19David M. Nathan,21 Ebenezer Nyenwe,18Jennifer Patricio,22 Anne L. Peters,11Xavier Pi-Sunyer,22 Henry Pownall,10J. Bruce Redmon,17 Julia Rushing,1Donna H. Ryan,5 Monika Safford,20Adam G. Tsai,23 Thomas A. Wadden,2Rena R. Wing,8 Susan Z. Yanovski,9and Ping Zhang,12for the Look AHEAD Research Group
EPID
EMIOL
OGY/
HEAL
TH
SERV
ICES
RESE
RESULTS
ILI led to reductions in annual hospital-izations (11%,P= 0.004), hospital days
(15%,P= 0.01), and number of
medica-tions (6%,P<0.001), resulting in cost savings for hospitalization (10%, P=
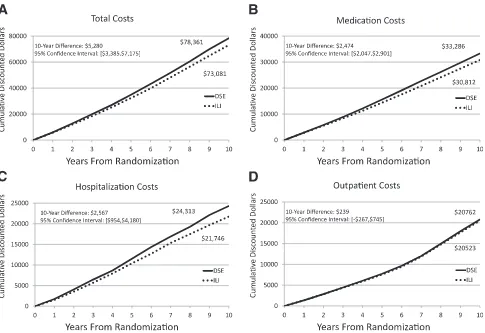
0.04) and medication (7%,P< 0.001). ILI produced a mean relative per-person 10-year cost savings of $5,280 (95% CI 3,385–7,175); however, these were not evident among individuals with a his-tory of cardiovascular disease.
CONCLUSIONS
Compared with DSE over 10 years, ILI participants had fewer hospitaliza-tions, fewer medicahospitaliza-tions, and lower health-care costs.
The number of adults who both are overweight or obese and have type 2 diabetes is increasing rapidly (1). In the U.S.,.35% of adults are obese (2), and the projected number of diabetes cases exceeds 30 million (3). Separately, obe-sity and diabetes markedly increase health-care costs (4–6), and their coexis-tence further increases costs (7). Strate-gies to reduce the economic impact of these trends are needed.
Lifestyle interventions aimed at pro-moting long-term weight loss and increased physical activity are recom-mended for overweight and obese indi-viduals with type 2 diabetes. Although reduced health-care costs have been suggested to accompany these inter-ventions (8–14), no studies have pro-spectively recorded their long-term effects on health-care costs among these individuals. The Action for Health in Diabetes (Look AHEAD) study is the
first randomized clinical trial with suffi -cient size and duration to test whether behavioral intervention targeting weight loss and increased physical activ-ity influences long-term health-care ser-vice use and costs.
RESEARCH DESIGN AND METHODS The design and methods of the Look AHEAD trial have been published previ-ously (15), as have its CONSORT (Consol-idated Standards of Reporting Trials) diagram and the results for its primary outcome (16). Look AHEAD was a single-blinded randomized controlled trial that recruited 5,145 individuals (from 2001 to 2004) who were overweight or obese
and had type 2 diabetes. To be eligible, they had to meet the following criteria: 45–76 years of age, BMI .25 kg/m2 (.27 kg/m2if treated with insulin), gly-cated hemoglobin (HbA1c) ,11% (97
mmol/mol), blood pressure ,160/
,100 mmHg, triglyceride level ,600 mg/dL, and successful completion of a maximum graded exercise test. Partici-pants at the trial’s 16 sites were ran-domly assigned with equal probability to an intensive lifestyle intervention (ILI) or diabetes support and education (DSE) comparator. All participants pro-vided informed consent. Local institu-tional review boards approved the protocols.
On 14 September 2012, the study was directed by its sponsor (National Insti-tute of Diabetes and Digestive and Kidney Diseases) to terminate interven-tions based on recommendainterven-tions from the trial’s data and safety monitoring board. This recommendation was based on an evaluation of statistical futility for the trial’s primary end point, a compos-ite of death from cardiovascular dis-ease, nonfatal myocardial infarction, nonfatal stroke, and hospitalization for angina (16).
Interventions
ILI participants were assigned calorie, di-etary fat, and physical activity goals (17). Trained interventionists provided in-struction and encouragement in face-to-face group and individual meetings weekly for 6 months and three times per month for the next 6 months. There-after, ILI participants were offered an individual and group meeting each month and periodic refresher group meetings. DSE participants were invited to three group sessions on general edu-cation about diabetes self-care per year during thefirst 4 years and one per year thereafter (18). Look AHEAD investiga-tors did not manage any medical care or medical service use (e.g., admit partici-pants to the hospital, change dosages of or stop prescription medications, or pre-scribe rehabilitation). This management remained in the hands of the partici-pants’ health-care providers. The only exceptions were for temporary changes in glucose medications made by study staff to reduce the risk of hypoglycemia and the prescription of orlistat to 684 (27%) ILI participants, which was largely discontinued in 2008. The median
duration of orlistat use among these 684 participants was 0.98 (interquartile range 0.43–1.66) years.
Assessments and Outcomes
At baseline, demographic data, medical history, and sources of medical care were collected by self-report. Weight and height were measured in duplicate using a digital scale and stadiometer. Hypertension was determined based on the use of antihypertensive medica-tions or measured blood pressure. His-tory of cardiovascular disease was defined by self-report of prior myocardial infarction, stroke, coronary or lower-extremity angioplasty, carotid endarter-ectomy, or coronary bypass surgery.
Hospitalizations, outpatient visits
(of-fice, hospital clinic, or other), outpatient tests and procedures, rehabilitation/ long-term care, and home care were as-sessed annually through face-to-face in-terviews at clinic visits and at 6-month intervals by telephone. A validation study confirmed that information on hospitalizations for procedures unre-lated to major study end points that had lengths of stay of#3 days could be collected by self-report. These ac-counted for 14% of hospitalizations. For the other 86% of hospitalizations, hospital records were reviewed for ad-mission and discharge dates, reasons for hospitalization, and discharge status. Hospitalizations were categorized using the Clinical Classifications Software sys-tem from the Agency for Healthcare Re-search and Quality (www.hcup-us.ahrq .gov/toolssoftware/ccs/ccsfactsheet .jsp). Participants brought prescription medications to annual clinic visits for re-cording. Follow-up was censored at each participant’s last interview and, thus, excludes health-care use and costs associated with death. All data were collected by centrally trained staff who were masked to intervention assignment.
on Medicare Skilled Nursing Facility Pro-spective Payment System and National Home Health Utilization statistics for Medicare Parts A and B (www.cms .gov). Medication costs were based on adjusted average wholesale prices ob-tained from theRed Book (www.red-book.com/redbook) from January to May 2013. Medications were grouped by using this resource to disaggregate the broader U.S. Food and Drug Admini-stration classifications (www.fda.gov/
drugs/developmentapprovalprocess/ howdrugsaredevelopedandapproved/ approvalapplications/investigational newdrugindapplication/ucm176533 .htm). Costs were obtained for both brand-name and generic-brand drugs and assigned to medications propor-tional to the reported use (i.e., brand name vs. generic) by participants. Medi-cation doses were not recorded; the most commonly prescribed doses were assumed. Adjustments accounted for the relationship between average wholesale prices and the cost of both the man-ufacturing and the purchasing of drugs (20,21). All costs were expressed in 2012 dollars, with adjustments made us-ing the medical care component of the Consumer Price Index (www.bls.gov/ data/inflation_calculator.htm).
Statistical Analysis
We report two types of outcomes: per-participant average annual rates and costs of medical service use and per-participant 10-year cumulative mean discounted costs. Data were collected from contacts with participants occur-ring before 14 September 2012. Hospi-talizations reported later but that had admission dates before 14 September 2012 were also included.
Analyses followed intention-to-treat principles and used all available data, with participants included in their ran-domization group independent of ad-herence. For per-participant average annual estimates, frequencies and costs were tallied for each participant and di-vided by follow-up time to obtain ob-served counts and costs per year. For inference, weighted ANCOVA was used to compare intervention groups, with analytical weights proportional to par-ticipants’ lengths of follow-up. Clinic, the sole stratification factor in random-ization, was a covariate. To accumulate costs over 10 years, annual estimates
were discounted at 3% per year and summed. Bootstrapping was used for CIs of the 10-year differences in accu-mulated mean costs.
The Look AHEAD protocol
prespeci-fied subgroup comparisons for the pri-mary outcome of major cardiovascular events were based on sex, history of car-diovascular disease, and race/ethnicity. Although this prespecification did not extend to other study outcomes, we re-port parallel comparisons for use rates and costs. We also report results for sub-groups based on age and baseline BMI. Tests of interaction were used to assess the consistency of differences between intervention groups for each of these subgroups.
RESULTS
Follow-up cost data were available from 5,121 of the 5,145 Look AHEAD partici-pants (99.5%). Twenty-four participartici-pants withdrew from the trial or were lost to follow-up before the collection of any cost data. Collectively, these 5,121 indi-viduals provided 50,498 person-years of follow-up (averaging 9.9 years per par-ticipant). Follow-up was terminated for refusal and lost contact in 6.2% of ILI and 6.5% of DSE participants (P= 0.62) and for death in 6.8% of ILI and 7.8% of DSE participants (P= 0.15).
Baseline Characteristics
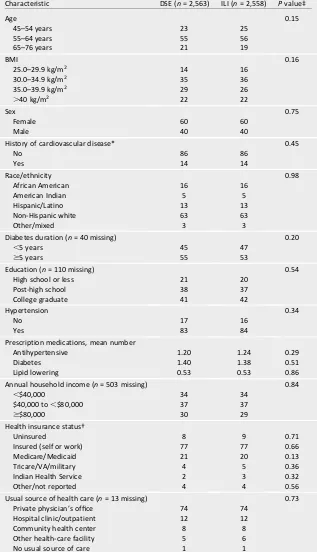
At baseline (Table 1), 25% of partici-pants were aged 45–54 years, 55% were aged 55–64 years, and 20% were aged 65–76 years. Fifteen percent were overweight (BMI 25.0–29.9 kg/m2), and 22% had class III obesity (BMI$40.0 kg/m2). Sixty percent were female; 54% had diabetes for at least 5 years; 14% had a history of cardiovascular dis-ease; and 63% were non-Hispanic white. None of the characteristics in Table 1 differed significantly between intervention groups.
Service Use
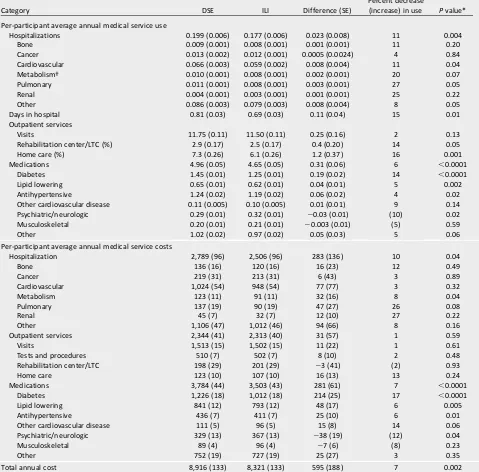
ILI participants averaged 0.177 hospital-izations per year compared with 0.199 hospitalizations per year for DSE partic-ipants, an 11% (P = 0.004) reduction (Table 2). Reductions in hospitalization rates reached nominal statistical signifi
-cance for cardiovascular (11%,P= 0.04), pulmonary (27%,P= 0.05), and other (i.e., not among the named categories) (8%,P= 0.05) diseases. There was a sig-nificant 15% (P= 0.01) reduction in the
average annual days in the hospital (0.69 vs. 0.81 days/year for ILI and DSE partic-ipants, respectively). ILI participants also had relative reductions of 14% (P= 0.05) and 16% (P= 0.001) in the annual rates of rehabilitation/long-term care and home care, respectively. There was no signifi
-cant difference between the groups in the rates of outpatient visits, but the ILI group had lower rates for outpatient re-habilitation facilities, home care, and hospitalization.
On average across follow-up, ILI par-ticipants attending clinic visits were taking 4.65 prescription medications compared with 4.96 medications in DSE, a reduction of 6% (P ,0.0001). The most significant reductions occurred
for diabetes drugs (14%, P,0.0001), lipid-lowering drugs (5%, P = 0.002), and antihypertensives (4%,P = 0.02). Use of psychiatric/neurologic drugs (the majority of which were agents that may be prescribed to treat depres-sion, neuropathy, and insomnia) was 10% (P= 0.02) greater among ILI than among DSE participants.
Costs
The per-participant average annual cost of health-care services and medications was 7% less among ILI than among DSE participants ($8,321 vs. $8,916 per year; P= 0.002). This resulted from fewer hos-pitalizations and less medication use (Table 2). The annual 11% fewer hospi-talizations translated to 10% ($283) lower per-participant average annual costs (P = 0.04). The 6% lower annual use of prescribed medications trans-lated to a 7% ($281) lower annual med-ication cost (P , 0.0001). The most significant lower per-participant aver-age annual medication costs were for diabetes drugs (17%, P , 0.0001), lipid-lowering drugs (6%, P = 0.005), and antihypertensive drugs (6%, P = 0.01). The 10% greater use of psychiatric/ neurologic drugs for ILI participants trans-lated to a 12% (P= 0.04) greater per-participant average annual psychiatric/ neurologic drug cost.
differences in discounted outpatient service costs were lower ($239 [2$267 to $745]).
From tests of interactions, the rela-tive effects of ILI on average annual total costs were similar across subgroups
based on age, baseline BMI, sex, and race/ethnicity (Table 3). Intervention ef-fects varied according to the partici-pant’s history of cardiovascular disease at baseline for outpatient (interaction P , 0.0001), medication (P = 0.02), and total costs (P = 0.02) but not for hospitalization costs (P= 0.71). For par-ticipants without a history of cardio-vascular disease at baseline, ILI was associated with lower per-participant average annual costs of $133 (95% CI $13–$252) for outpatient care, $343 ($216–$470) for medications, and $801 ($417–$1,185) for total costs. For those with a history of cardiovascular disease, ILI was associated with greater per-participant average annual outpatient costs of $592 ($286–$889).
CONCLUSIONS
The Look AHEAD intervention produced sustained differences between inter-vention groups in mean weight loss (7.9 and 2.5 percentage points at 1 and 10 years in ILI and DSE, respectively) (16) and in physicalfitness (22,23). Although not significantly reducing overall risk of
major cardiovascular disease events (16), the intervention improved many measures of health, including markers of diabetes control, blood pressure, plasma lipid levels, sleep quality, physi-cal function, and depression (24–27). Although these effects varied in magni-tude and duration, and some were not sustained throughout follow-up, each could be associated with reduced health-care needs. The medical man-agement of the participants was left to their own health-care providers, who were provided with clinically relevant information, such as annual lipid and blood pressure measurements.
Ten years of ILI broadly reduced the use of health-care services, including hospitalizations, selected outpatient services, and medications, and the total overall costs of health care, with signif-icant savings for hospitalization and medication costs across many disease indications. The 11% overall relative de-crease in 10-year hospitalization costs is less than the 17% relative reduction in 10-year inpatient care costs reported by the Diabetes Prevention Program among individuals initially free of diabe-tes (13). However, because the Look AHEAD cohort had more comorbidities and overall hospitalizations, the absolute
Table 1—Characteristics at the time of enrollment into the Look AHEAD trial by intervention assignment
Characteristic DSE (n= 2,563) ILI (n= 2,558) Pvalue‡
Age 0.15
45–54 years 23 25
55–64 years 55 56
65–76 years 21 19
BMI 0.16
25.0–29.9 kg/m2 14 16
30.0–34.9 kg/m2 35 36
35.0–39.9 kg/m2 29 26
.40 kg/m2 22 22
Sex 0.75
Female 60 60
Male 40 40
History of cardiovascular disease* 0.45
No 86 86
Yes 14 14
Race/ethnicity 0.98
African American 16 16
American Indian 5 5
Hispanic/Latino 13 13
Non-Hispanic white 63 63
Other/mixed 3 3
Diabetes duration (n= 40 missing) 0.20
,5 years 45 47
$5 years 55 53
Education (n= 110 missing) 0.54
High school or less 21 20
Post-high school 38 37
College graduate 41 42
Hypertension 0.34
No 17 16
Yes 83 84
Prescription medications, mean number
Antihypertensive 1.20 1.24 0.29
Diabetes 1.40 1.38 0.51
Lipid lowering 0.53 0.53 0.86
Annual household income (n= 503 missing) 0.84
,$40,000 34 34
$40,000 to,$80,000 37 37
$$80,000 30 29
Health insurance status†
Uninsured 8 9 0.71
Insured (self or work) 77 77 0.66
Medicare/Medicaid 21 20 0.13
Tricare/VA/military 4 5 0.36
Indian Health Service 2 3 0.32
Other/not reported 4 4 0.56
Usual source of health care (n= 13 missing) 0.73 Private physician’s office 74 74
Hospital clinic/outpatient 12 12
Community health center 8 8
Other health-care facility 5 6
No usual source of care 1 1
savings associated with its intervention were greater ($2,567 vs. $1,309 [con-verted to 2012 dollars] for the Look AHEAD ILI vs. Diabetes Prevention Program behavioral intervention, respectively).
The significant reduction in hospital-izations for cardiovascular disease dif-fers from the nonsignificantfinding for the primary end point of Look AHEAD: a composite of thefirst occurrence of car-diovascular disease death, nonfatal myocardial infarction, nonfatal stroke,
or hospitalization for angina (16). Unlike the primary end point, the cardiovascu-lar hospitalization category presented in this article is more broadly defined and not limited to the first occurrence of events.
The rate of outpatient visits did not differ between intervention groups, supporting the decision of the study in-vestigators not to provide ongoing med-ical management to participants but to leave this to their personal health-care
providers. Thus, the reduction in other use and costs was not due to medical management by study investigators of ILI participants.
A clinical trial by Tsai et al. (14) found that behavioral weight loss intervention in an obese population can reduce medication costs, which agrees with self-controlled pre- and postobservational cohort stud-ies of weight loss programs (28,29) and trials that have been analyzed as pre-and postobservational cohort studies
Table 2—Average annual rates of medical service use and average annual costs over follow-up for participants grouped by intervention assignment
Category DSE ILI Difference (SE)
Percent decrease
(increase) in use Pvalue*
Per-participant average annual medical service use
Hospitalizations 0.199 (0.006) 0.177 (0.006) 0.023 (0.008) 11 0.004
Bone 0.009 (0.001) 0.008 (0.001) 0.001 (0.001) 11 0.20
Cancer 0.013 (0.002) 0.012 (0.001) 0.0005 (0.0024) 4 0.84
Cardiovascular 0.066 (0.003) 0.059 (0.002) 0.008 (0.004) 11 0.04 Metabolism† 0.010 (0.001) 0.008 (0.001) 0.002 (0.001) 20 0.07
Pulmonary 0.011 (0.001) 0.008 (0.001) 0.003 (0.001) 27 0.05
Renal 0.004 (0.001) 0.003 (0.001) 0.001 (0.001) 25 0.22
Other 0.086 (0.003) 0.079 (0.003) 0.008 (0.004) 8 0.05
Days in hospital 0.81 (0.03) 0.69 (0.03) 0.11 (0.04) 15 0.01
Outpatient services
Visits 11.75 (0.11) 11.50 (0.11) 0.25 (0.16) 2 0.13
Rehabilitation center/LTC (%) 2.9 (0.17) 2.5 (0.17) 0.4 (0.20) 14 0.05
Home care (%) 7.3 (0.26) 6.1 (0.26) 1.2 (0.37) 16 0.001
Medications 4.96 (0.05) 4.65 (0.05) 0.31 (0.06) 6 ,0.0001
Diabetes 1.45 (0.01) 1.25 (0.01) 0.19 (0.02) 14 ,0.0001
Lipid lowering 0.65 (0.01) 0.62 (0.01) 0.04 (0.01) 5 0.002
Antihypertensive 1.24 (0.02) 1.19 (0.02) 0.06 (0.02) 4 0.02
Other cardiovascular disease 0.11 (0.005) 0.10 (0.005) 0.01 (0.01) 9 0.14 Psychiatric/neurologic 0.29 (0.01) 0.32 (0.01) 20.03 (0.01) (10) 0.02 Musculoskeletal 0.20 (0.01) 0.21 (0.01) 20.003 (0.01) (5) 0.59
Other 1.02 (0.02) 0.97 (0.02) 0.05 (0.03) 5 0.06
Per-participant average annual medical service costs
Hospitalization 2,789 (96) 2,506 (96) 283 (136) 10 0.04
Bone 136 (16) 120 (16) 16 (23) 12 0.49
Cancer 219 (31) 213 (31) 6 (43) 3 0.89
Cardiovascular 1,024 (54) 948 (54) 77 (77) 3 0.32
Metabolism 123 (11) 91 (11) 32 (16) 8 0.04
Pulmonary 137 (19) 90 (19) 47 (27) 26 0.08
Renal 45 (7) 32 (7) 12 (10) 27 0.22
Other 1,106 (47) 1,012 (46) 94 (66) 8 0.16
Outpatient services 2,344 (41) 2,313 (40) 31 (57) 1 0.59
Visits 1,513 (15) 1,502 (15) 11 (22) 1 0.61
Tests and procedures 510 (7) 502 (7) 8 (10) 2 0.48
Rehabilitation center/LTC 198 (29) 201 (29) 23 (41) (2) 0.93
Home care 123 (10) 107 (10) 16 (13) 13 0.24
Medications 3,784 (44) 3,503 (43) 281 (61) 7 ,0.0001
Diabetes 1,226 (18) 1,012 (18) 214 (25) 17 ,0.0001
Lipid lowering 841 (12) 793 (12) 48 (17) 6 0.005
Antihypertensive 436 (7) 411 (7) 25 (10) 6 0.01
Other cardiovascular disease 111 (5) 96 (5) 15 (8) 14 0.06
Psychiatric/neurologic 329 (13) 367 (13) 238 (19) (12) 0.04
Musculoskeletal 89 (4) 96 (4) 27 (6) (8) 0.23
Other 752 (19) 727 (19) 25 (27) 3 0.35
Total annual cost 8,916 (133) 8,321 (133) 595 (188) 7 0.002
(8,30). The Diabetes Prevention Program reported a 6% relative reduction in 10-year medication costs among partic-ipants assigned to its lifestyle interven-tion (13), resulting in a relative savings of $501 (converted to 2012 dollars). The 7% relative reduction produced by the Look AHEAD intervention yielded a savings of $2,474 (in 2012 dollars) because of the overall greater use of medications in its cohort. Thefinding of a greater use of
psychiatric/neurologic medications over time among ILI compared with DSE participants follows a chance imbal-ance for greater antidepressant use at baseline among participants randomly assigned to ILI (17.4%) compared with DSE (15.1%;P= 0.02). Covariate adjust-ment for baseline antidepressant use eliminated differences between inter-vention groups in the use of these medications during follow-up (P = 0.63).
The savings in total medical care costs associated with ILI accrued gradu-ally over time, resulting in a 10-year
difference of $5,280. Similar patterns were seen for the accumulation of both hospital and medications costs, with 10-year differences of $2,567 and $2,474, respectively. There were only small overall differences during thefirst 4 years of follow-up when the interven-tions were most intense, although dia-betes, hypertension, and hyperlipidemia medication costs were significantly lower among ILI participants even dur-ing thefirst year after randomization (31).
Health-care costs associated with obesity and diabetes accelerate in later life (32,33), and as expected, the rate at which costs accumulated in the Look AHEAD cohort increased with time. Fu-ture follow-up of the Look AHEAD cohort will assess whether the inter-vention has a legacy effect during the oldest years of life when health-care costs are highest (i.e., whether the dif-ferences in accumulated costs between the ILI and DSE cohorts continue to diverge).
Based on interaction tests, the sav-ings on overall medical costs associated with ILI did not depend on participant age, BMI, sex, or race/ethnicity. In con-trast, intervention effects on outpatient, medication, and total costs differed sig-nificantly according to baseline history of cardiovascular disease. For partici-pants with no cardiovascular disease history, assignment to ILI significantly reduced the costs of outpatient care and medication; for those with a history, assignment to ILI significantly increased outpatient costs and had no effect on medication costs. The ILI effect on hos-pital costs did not differ between those who had or did not have a history of cardiovascular disease.
History of cardiovascular disease at baseline was prespecified as a subgroup for comparing intervention effects on the primary outcome. The hazard ratio for the intervention effect among par-ticipants with no history of cardiovascu-lar disease for the primary outcome was 0.86 (95% CI 0.72–1.02) compared with
Figure 1—Per-participant average 10-year cumulative discounted costs.A: Ten-year cumulative total costs.B: Ten-year cumulative medication costs.
Table 3—Mean annual costs (in 2012 dollars) over follow-up by intervention assignment for subgroups of participants based on baseline characteristics
Subgroup DSE ILI Difference (95% CI) DSE vs. ILIPvalue† InteractionPvalue†
Age
45–54 years
Hospitalization 1,674 (190) 1,876 (184) 2203 (2721 to 316) 0.44 0.14 Outpatient 1,902 (80) 1,928 (78) 226 (2246 to 193) 0.81 0.85 Medication 3,439 (87) 3,372 (84) 67 (2170 to 305) 0.58 0.13 Total 7,014 (263) 7,176 (255) 2162 (2879 to 556) 0.66 0.09 55–64 years
Hospitalization 2,713 (129) 2,355 (128) 358 (2 to 713) 0.05 d
Outpatient 2,313 (54) 2,272 (54) 41 (2109 to 191) 0.59 d
Medication 3,892 (59) 3,560 (58) 332 (170 to 495) ,0.0001 d
Total 8,918 (178) 8,187 (177) 731 (239 to 1,223) 0.004 d
65–76 years
Hospitalization 4,321 (208) 3,828 (218) 493 (297 to 1,084) 0.10 d Outpatient 2,954 (88) 2,973 (92) 219 (2269 to 230) 0.88 d
Medication 3,911 (95) 3,521 (100) 390 (120 to 660) 0.005 d
Total 11,186 (288) 10,322 (302) 864 (47 to 1,681) 0.04 d
BMI
25–29.9 kg/m2
Hospitalization 2,125 (254) 2,250 (240) 2125 (2810 to 561) 0.72 0.36 Outpatient 2,085 (103) 2,219 (97) 2134 (2424 to 156) 0.36 0.43 Medication 3,476 (115) 3,084 (109) 392 (82 to 702) 0.01 0.72 Total 7,686 (352) 7,552 (333) 133 (2818 to 1,084) 0.78 0.58 30.0–39.9 kg/m2
Hospitalization 2,864 (121) 2,453 (122) 411 (74 to 748) 0.02 d
Outpatient 2,333 (51) 2,296 (51) 38 (2105 to 180) 0.60 d
Medication 3,823 (55) 3,574 (55) 249 (97 to 401) 0.001 d
Total 9,021 (168) 8,322 (169) 698 (231 to 1,165) 0.003 d
.40.0 kg/m2
Hospitalization 3,001 (202) 2,829 (201) 172 (2387 to 731) 0.55 d Outpatient 2,537 (89) 2,425 (88) 112 (2134 to 358) 0.37 d
Medication 3,867 (91) 3,603 (91) 264 (11 to 516) 0.04 d
Total 9,405 (281) 8,857 (279) 548 (2228 to 1,323) 0.17 d
Sex Female
Hospitalization 2,311 (123) 2,221 (123) 90 (2252 to 432) 0.60 0.08 Outpatient 2,293 (52) 2,256 (52) 37 (2108 to 182) 0.62 0.90 Medication 3,651 (56) 3,385 (56) 266 (111 to 421) 0.001 0.76
Total 8,255 (171) 7,862 (171) 393 (282 to 867) 0.10 0.18
Male
Hospitalization 3,510 (151) 2,931 (151) 579 (160 to 998) 0.007 d
Outpatient 2,420 (64) 2,398 (64) 23 (2155 to 201) 0.80 d
Medication 3,984 (69) 3,679 (68) 305 (115 to 495) 0.002 d
Total 9,914 (210) 9,008 (209) 906 (325 to 1,487) 0.002 d
History of cardiovascular disease No
Hospitalization 2,407 (101) 2,082 (101) 325 (46 to 604) 0.02 0.71 Outpatient 2,295 (43) 2,162 (43) 133 (13 to 252) 0.03 ,0.0001 Medication 3,667 (46) 3,324 (46) 343 (216 to 470) ,0.0001 0.02 Total 8,369 (139) 7,568 (139) 801 (417 to 1,185) ,0.0001 0.02 Yes
Hospitalization 5,373 (261) 5,191 (253) 181 (2533 to 895) 0.62 d Outpatient 2,674 (112) 3,266 (109) 2592 (2889 to2286) 0.0002 d Medication 4,569 (119) 4,635 (116) 267 (2392 to 259) 0.69 d Total 12,615 (360) 13,093 (349) 2478 (21,461 to 505) 0.34 d Race/ethnicity
African American
Hospitalization 2,118 (242) 2,590 (241) 2473 (21,142 to 197) 0.17 0.08 Outpatient 2,090 (101) 2,278 (101) 2189 (2469 to 91) 0.19 0.32 Medication 3,437 (107) 3,129 (107) 308 (11 to 605) 0.04 0.95 Total 7,644 (332) 7,998 (331) 2353 (21,271 to 565) 0.45 0.13 American Indian
Hospitalization 2,188 (431) 1,956 (424) 232 (2953 to 1,417) 0.70 d
1.12 (0.90–1.42) for those with a history of cardiovascular disease. Although this trend did not reach nominal statistical significance (P= 0.06) (16), it resembles
the difference we report for outpatient costs. Increased outpatient costs among ILI participants with prior cardiovascular disease were not triggered by an imbal-ance in cardiovascular disease events. Annual outpatient costs were 22% (P= 0.006) higher among ILI than among DSE participants before these events (in-cluding those individuals with no on-trial cardiovascular outcomes), which is similar to the overall difference in costs (Table 2). Why the intervention may af-fect costs differently among participants with and without a cardiovascular dis-ease history is not clear; however, these results imply that the ILI is most benefi
-cial to overweight and obese individuals with diabetes before cardiovascular dis-ease is diagnosed.
The study had several limitations. The Look AHEAD cohort, although geograph-ically and demographgeograph-ically diverse, comprised volunteers to a randomized clinical trial who were required to have a source of usual medical care; thus, the degree to which thefindings may gen-eralize to other populations is unclear. We relied on self-report to identify out-patient care and the occurrence of hospitalizations. We did not assess health-care costs related to death. As
noted, there were slightly fewer deaths among the ILI than among the DSE par-ticipants, and the exclusion of these costs may have led to an underestima-tion of ILI benefits. Follow-up was not complete for all participants, and the results of the service use, cost, and sub-group analyses may be biased if follow-up lengths were different. However, we used a pattern-mixture approach (34) to assess the sensitivity of the findings, examining the consistency of results across strata based on length of follow-up, which confirmed thefindings (data
not shown). We did not report interven-tion costs or draw conclusions from a cost-benefit analysis; these are reserved for future study.
In conclusion, random assignment of overweight and obese individuals with type 2 diabetes to 10 years of an in-tensive behavioral intervention that focused on weight loss and increased physical activity resulted in relatively fewer hospitalizations, fewer days in the hospital, and less use of prescrip-tion medicaprescrip-tions. Cumulatively, these effects resulted in an average annual savings of almost $600 per participant relative to a comparison condition DSE.
Duality of Interest.M.A.E. serves on monitor-ing boards for Terumo Medical Corporation and
the Kowa Research Institute. He serves on a steering committee for Boehringer Ingelheim and has recently served on an advisory com-mittee for Takeda Global Research. H.A.G. has twice been a sponsored lecturer by Merck. J.O.H. serves on advisory boards for Takeda and Novo Nordisk. E.S.H. has received consulting, advisory board, monitoring board, and speakers’
board support from Amgen; Amylin Pharmaceut-icals, LLC; Bristol-Myers Squibb/AstraZeneca; GI Dynamic, Inc.; Gilead Sciences, Inc.; Internation-al MedicInternation-al Press GlobInternation-al Partnership for Effective Diabetes Management; Janssen Pharmaceuticals, Inc.; Merck Research Laboratories, Inc.; Sanofi, Inc.; Vivus, Inc.; Theracos Pharmaceuticals, Inc.; and Takeda Pharmaceuticals, Inc. E.N. has re-ceived research support from Eli Lilly and Com-pany and GlaxoSmithKline. A.L.P. has consulted for Abbott Diabetes Care, Becton Dickinson, Bristol-Myers Squibb, Boehringer Ingelheim, Janssen, Lilly, Medtronic MiniMed, and Sanofi; has been on the speakers’bureau for Bristol-Myers Squibb/AstraZeneca and Novo Nordisk; has re-ceived research grant funding from Medtronic MiniMed; and has received editorial fees from Medscape. D.H.R. was a paid consultant/advisor to Novo Nordisk, Janssen, Takeda, Vivus, and Eisai and has an equity position in Scientific In-take. M.S. has received salary support from Am-gen and diaDexus and has served as a consultant for diaDexus. T.A.W. serves on advisory boards for Novo Nordisk and Orexigen and is a consul-tant to Boehringer Ingelheim. No other potential conflicts of interest relevant to this article were reported.
Author Contributions.M.A.E. and D.H. con-tributed to the data analysis and organization and drafting of the manuscript. H.A.G., A.B., M.E., T.K., W.C.K., M.G.M., and P.Z. organized the manuscript and wrote the initial drafts. F.L.B., G.A.B., J.M.Cl., J.M.Cu., C.E., J.P.F., S.G., E.W.G., H.P.H., J.O.H., E.S.H., V.S.H., J.M.J., R.W.J., K.C.J.,
Table 3—Continued
Subgroup DSE ILI Difference (95% CI) DSE vs. ILIPvalue† InteractionPvalue†
Outpatient 1,479 (180) 1,607 (177) 2128 (2624 to 367) 0.61 d Medication 2,649 (191) 2,503 (188) 146 (2380 to 672) 0.59 d Total 6,316 (591) 6,066 (581) 250 (21,375 to 1,874) 0.76 d Hispanic/Latino
Hospitalization 2,276 (269) 1,468 (267) 808 (65 to 1,551) 0.03 d Outpatient 1,742 (113) 1,545 (112) 197 (2114 to 508) 0.21 d
Medication 3,031 (119) 2,654 (118) 377 (47 to 707) 0.02 d
Total 7,048 (369) 5,666 (366) 1,382 (363 to 2,401) 0.008 d
Non-Hispanic white
Hospitalization 3,072 (120) 2,752 (120) 320 (213 to 652) 0.06 d
Outpatient 2,583 (50) 2,511 (50) 72 (267 to 211) 0.31 d
Medication 4,104 (53) 3,845 (53) 260 (112 to 407) 0.001 d
Total 9,760 (164) 9,108 (164) 652 (196 to 1,107) 0.005 d
Other/multiple races
Hospitalization 3,472 (569) 2,225 (539) 1,248 (2288 to 2,784) 0.11 d Outpatient 2,549 (238) 2,749 (225) 2200 (2843 to 443) 0.54 d Medication 3,805 (252) 3,551 (239) 255 (2427 to 936) 0.46 d Total 9,827 (780) 8,525 (738) 1,303 (2803 to 3,408) 0.22 d
S.E.K., A.E.K., A.K., C.E.L., M.M., A.M., D.M.N., E.N., J.P., A.L.P., X.P.-S., H.P., J.B.R., D.H.R., M.S., T.A.W., R.R.W., and S.Z.Y. designed and conducted the trial, collected data, and reviewed/edited the manuscript. J.R. contributed to the data analyses. A.G.T. contributed to the data analyses, de-signed and conducted the trial, collected data, and reviewed/edited the manuscript. M.A.E. is the guarantor of this work and, as such, had full access to all the data in the study and takes responsibility for the integrity of the data and the accuracy of the data analysis.
Prior Presentation.Parts of this study were presented in abstract form at the 73rd Scientific Sessions of the American Diabetes Association, Chicago, IL, 21–25 June 2013.
References
1. Mokdad AH, Ford ES, Bowman BA, et al. Prevalence of obesity, diabetes, and obesity-related health risk factors, 2001. JAMA 2003; 289:76–79
2. Ogden CL, Carroll MD, Kit BK, Flegal KM. Prevalence of Obesity in the United States, 2009-2010. NCHS data brief no. 82. Hyattsville, MD, National Center for Health Statistics, 2012 3. Huang ES, O’Grady M, Basu A, Capretta JC. Projecting the future diabetes population size and related costs for the U.S. Diabetes Care 2009;32:2225–2229
4. Finkelstein EA, Trogdon JG, Cohen JW, Dietz W. Annual medical spending attributable to obesity: payer-and service-specific estimates.
Health Aff (Millwood) 2009;28:w822–w831 5. Tsai AG, Williamson DF, Glick HA. Direct medical cost of overweight and obesity in the USA: a quantitative systematic review. Obes Rev 2011;12:50–61
6. American Diabetes Association. Economic costs of diabetes in the US in 2007. Diabetes Care 2008;3:595–615
7. Liebl A, Breitscheidel L, Nicolay C, Happich M. Direct costs and health-related resource uti-lization in the 6 months after insulin initiation in German patients with type 2 diabetes mellitus in 2006: INSTIGATE study. Curr Med Res Opin 2008;24:2349–2358
8. Collins RW, Anderson JW. Medication cost savings associated with weight loss for obese non-insulin-dependent diabetic men and women. Prev Med 1995;24:369–374
9. Tsai AG, Glick HA, Shera D, Stern L, Samaha FF. Cost-effectiveness of a low-carbohydrate diet and a standard diet in severe obesity. Obes Res 2005;13:1834–1840
10. Herman WH, Hoerger TJ, Brandle M, et al; Diabetes Prevention Program Research Group. The cost-effectiveness of lifestyle modification
or metformin in preventing type 2 diabetes in adults with impaired glucose tolerance. Ann In-tern Med 2005;142:323–332
11. Wolf AM, Siadaty M, Yaeger B, et al. Effects of lifestyle intervention on health care costs: Improving Control with Activity and Nutrition (ICAN). J Am Diet Assoc 2007;107:1365–1373 12. Krukowski RA, Tilford JM, Harvey-Berino J, West DS. Comparing behavioral weight loss modalities: incremental cost-effectiveness of an internet-based versus an in-person condi-tion. Obesity (Silver Spring) 2011;19:1629–
1635
13. Diabetes Prevention Program Research Group. The 10-year cost-effectiveness of life-style intervention or metformin for diabetes prevention: an intent-to-treat analysis of the DPP/DPPOS. Diabetes Care 2012;35:723–730
14. Tsai AG, Wadden TA, Volger S, et al. Cost-effectiveness of a primary care intervention to treat obesity. Int J Obes (Lond) 2013;37(Suppl. 1):S31–S37
15. Ryan DH, Espeland MA, Foster GD, et al; Look AHEAD Research Group. Look AHEAD (Ac-tion for Health in Diabetes): design and meth-ods for a clinical trial of weight loss for the prevention of cardiovascular disease in type 2 diabetes. Control Clin Trials 2003;24:610–628
16. Wing RR, Bolin P, Brancati FL, et al; Look AHEAD Research Group. Cardiovascular effects of intensive lifestyle intervention in type 2 di-abetes. N Engl J Med 2013;369:145–154 17. Wadden TA, West DS, Delahanty L, et al; Look AHEAD Research Group. The Look AHEAD study: a description of the lifestyle intervention and the evidence supporting it [published cor-rection appears in Obesity (Silver Spring) 2007; 15:1339]. Obesity (Silver Spring) 2006;14: 737–752
18. Wesche-Thobaben JA. The development and description of the comparison group in the Look AHEAD trial. Clin Trials 2011;8:320–
329
19. Healthcare Cost and Utilization Project. Overview of the Nationwide Inpatient Sample (NIS) Available from http://www.hcup-us.ahrq .gov/nisoverview.jsp. Accessed 15 September 2010
20. Levinson DR.Medicaid Drug Price Compar-ison: Average Sales Price to Average Wholesale Price. Publication OEI-03-05-00200. Washing-ton, DC, Office of the Inspector General,
Depart-ment of Health and Human Services, 2005 21. Levinson DR.Medicaid Drug Price Compar-isons: Average Manufacturer Price to Published Prices. Publication OEI-05-05-00240. Washing-ton, DC, Office of the Inspector General,
Depart-ment of Health and Human Services, 2005 22. Wing RR; Look AHEAD Research Group. Long-term effects of a lifestyle intervention on weight and cardiovascular risk factors in individ-uals with type 2 diabetes mellitus: four-year re-sults of the Look AHEAD trial. Arch Intern Med 2010;170:1566–1575
23. Jakicic JM, Jaramillo SA, Balasubramanyam A, et al; Look AHEAD Study Group. Effect of a lifestyle intervention on change in cardiorespi-ratoryfitness in adults with type 2 diabetes: results from the Look AHEAD Study. Int J Obes (Lond) 2009;33:305–316
24. Foster GD, Borradaile KE, Sanders MH, et al; Sleep AHEAD Research Group of Look AHEAD Research Group. A randomized study on the effect of weight loss on obstructive sleep apnea among obese patients with type 2 diabetes: the Sleep AHEAD study. Arch Intern Med 2009;169: 1619–1626
25. Rubin RR, Peyrot M, Gaussoin SA, et al; Look AHEAD Research Group. Four-year anal-ysis of cardiovascular disease risk factors, de-pression symptoms, and antidepressant medicine use in the Look AHEAD (Action for Health in Diabetes) clinical trial of weight loss in diabetes. Diabetes Care 2013;36: 1088–1094
26. Gregg E, Chen H, Wagenknecht L, et al.; Look AHEAD Research Group. Association of an intensive lifestyle intervention with remis-sion of type 2 diabetes. JAMA 2012;308:2489–
2496
27. Rejeski WJ, Ip EH, Bertoni AG, et al; Look AHEAD Research Group. Lifestyle change and mobility in obese adults with type 2 diabetes. N Engl J Med 2012;366:1209–1217
28. Greenway FL, Ryan DH, Bray GA, Rood JC, Tucker EW, Smith SR. Pharmaceutical cost sav-ings of treating obesity with weight loss medi-cations. Obes Res 1999;7:523–531
29. Potteiger CE, Paragi PR, Inverso NA, et al. Bariatric surgery: shedding the monetary weight of prescription costs in the managed care arena. Obes Surg 2004;14:725–730 30. Davis WA, Bruce DG, Davis TME. Economic impact of moderate weight loss in patients with type 2 diabetes: the Fremantle Diabetes Study. Diabet Med 2011;28:1131–1135
31. Redmon JB, Bertoni AG, Connelly S, et al; Look AHEAD Research Group. Effect of the look AHEAD study intervention on medi-cation use and related cost to treat cardiovas-cular disease risk factors in individuals with type 2 diabetes. Diabetes Care 2010;33: 1153–1158
32. K¨oster I, von Ferber L, Ihle P, Schubert I, Hauner H. The cost burden of diabetes mellitus: the evidence from Germanydthe CoDiM study. Diabetologia 2006;49:1498–1504
33. Wolfenstetter SB. Future direct and indirect costs of obesity and the influence of gaining weight: results from the MONICA/KORA cohort studies, 1995-2005. Econ Hum Biol 2012;10: 127–138