Australian Journal of Basic and Applied Sciences
ISSN:1991-8178Journal home page: www.ajbasweb.com
Corresponding Author: Hany Ferdinando, University of Oulu, Department of Electrical Engineering, Faculty of Information Technology and Electrical Enginering, ErkiKoiso-Kantilankatu 3, Oulu, Finland; Petra Christian University, Department of Electrical Engineering, Faculty of Industrial Technology, Siwalankerto 121-131, Surabaya, Indonesia,
Tel: +358 294 482765; E-mail: [email protected];
Emotion Recognition by Heart Rate Variability
1
Hany Ferdinando, 2Liang Ye, 3Tapio Seppänen, 4Esko Alasaarela
1University of Oulu, Department of Electrical Engineering, Faculty of Information Technology and Electrical Enginering,
ErkiKoiso-Kantilankatu 3, Oulu, Finland; Petra Christian University, Department of Electrical Engineering, Faculty of Industrial Technology, Siwalankerto 121-131, Surabaya, Indonesia
2University of Oulu, Department of Electrical Engineering, Faculty of Information Technology and Electrical Enginering,
ErkiKoiso-Kantilankatu 3, Oulu, Finland; Harbin Institute of Technology, 92 Xidazhi St, Nangang, Harbin, Heilongjiang, China
3University of Oulu, Department of Electrical Engineering, Faculty of Information Technology and Electrical Enginering,
ErkiKoiso-Kantilankatu 3, Oulu, Finland
4University of Oulu, Department of Electrical Engineering, Faculty of Information Technology and Electrical Enginering,
ErkiKoiso-Kantilankatu 3, Oulu, Finland
Background: Emotion plays an important role when people face difficult social problems in their daily activities. This study explores the application of sensors and mobile technologies to detect and recognize school bullying. Many databases offer data for emotion recognition research. One of these is the Mahnob-HCI-Tagging database, which yields a baseline accuracy for emotion recognition based on EEG, eye gaze, and a combination of EEG and eye gaze. Because EEG and eye gaze are not suitable for emotion recognition in the mobile gadget environment, it is interesting to investigate other physiological signals individually, such as ECG, galvanic skin conductance (GSR), body temperature and respiration rate. Objective: This paper focussed on the ECG signal and, more specifically, on heart rate variability (HRV), derived from ECG, to identify certain standard features used in emotion recognition. Instead of using discrete emotions as labels, we transferred emotions, such as fear, anger, happiness and anxiety, to an arousal-valence space. Results:For arousal and valence based on HRV, the baselines are 47.69% and 42.55%, respectively, while those for arousal and valence in all physiological signals were 46.2% and 45.5%, respectively. The most challenging label in this experiment turned out to be ‘neutral’ in the valence scale, as the SVM classified all results as either ‘unpleasant’ or ‘pleasant’. Conclusion: This work provided a baseline for emotion recognition research based on ECG signals. It also encourages experimental trials using GSR, body temperature and respiration rate individually.
© 2014 AENSI Publisher All rights reserved. ToCite ThisArticle: Hany Ferdinando, Liang Ye, TapioSeppänen, EskoAlasaarela., Emotion Recognition by Heart Rate Variability. Aust. J. Basic & Appl. Sci., 8(14): 50-55, 2014
INTRODUCTION
It has been established that specific physiological signals correlate strongly with certain emotions (Nwe, et al., 2003)(Pierre-Yves, 2003)(Caponetti, et al., 2011). This finding has stimulated research on emotion recognition based on physiological signals, including research reported on in(Soleymani, et al., 2012), (Koelstra,
et al., 2012), (Kortelainen & Seppänen, 2013), and (Hsieh & Chin, 2011). Unfortunately, this type of research has not been carried out in the context of anti-bullying systems, although there is a close relationship between emotion and bullying (Borg, 1998)(Waseem, et al., 2013)(Ortega, et al., 2012)(Hunter & Borg, 2006).
In bullying, the bullied person typically feels several different emotions at the same time, the exact combination varying from person to person. This fact makes it difficult to define what particular emotion is being experienced at a specific instance. Therefore, instead of using discrete emotions, we opted to apply the VA (valence-arousal) and VAD (valence-arousal-dominance) scales (Kortelainen & Seppänen, 2013)(Koelstra,
provide a starting point for the study and development of an algorithm designed to recognize similar emotions in a bullying situation. Later, the algorithm will be enhanced to bullying detection.
To detect bullying in real life requires a portable computer, and the best candidate for this purpose is the smartphone. Nowadays, as smartphones have become an essential part of human life, they are suitable for use as the brain of an anti-bullying system. A smartphone can be considered as a small computer with an operating system and memory. However, since its resources are limited, sensor instrumentation must be taken into account in system design. To reduce computational load, it is also advisable to use as few signals as possible.
One database intended for emotion recognition is the MAHNOB-HCI-Tagging database (from hereon, referred to as the Mahnob database). (Soleymani, et al., 2012) have done a study on its baseline accuracy for emotion recognition based on all physiological signals, EEG, eye gaze and a fusion of EEG and eye gaze. This work provides a good starting point to using the database. Unfortunately, EEG and eye gaze are unsuitable for smartphone applications due to issues of instrumentation and flexibility. More suitable modalities are ECG, galvanic skin response (GSR), respiration rate and skin temperature. In addition, using a wearable sensor with a wireless link, such as Bluetooth, would solve the instrumentation and flexibility problem. However, no publication exists relating to the baseline accuracy of the Mahnob database for ECG, galvanic skin response (GSR), respiration rate and skin temperature. As a result, it is important to explore its accuracy for determining individual and combined physiological signals to identify the ones most suitable for emotion recognition on a smartphone-based anti-bullying system.
The main signal employed in this research was Heart Rate Variability (HRV), derived from the ECG signal through pre-processing. Several features were then extracted from HRV in both time and frequency domains. To reduce the number of features, we used one-way Anova. A Support Vector Machine (SVM) was used to recognize emotions in an arousal-valence space. Of these, the arousal dimension comprised the categories
‘calm’, ‘medium’ and ‘activated’, while the valence dimension consisted of the categories ‘unpleasant’, ‘neutral’ and ‘pleasant’.
Background:
Using the Mahnob database, (Soleymani, et al., 2012) classified emotions in terms of arousal (calm, medium and activated) and valence (unpleasant, neutral, and pleasant) on the basis of EEG, ECG, respiration rate, temperature, GSR and eye gaze. For all signals except eye gaze, they reached an accuracy of 46.2% for arousal and 45.5% for valence. Best accuracy was obtained using a combination of EEG and eye gaze, which reached an accuracy level of 67.7% for arousal and 76.1% for valence. Although no results were provided for individual physiological signals, Soleymani et al. presented useful information on the use of one-way ANOVA to select useful features.
Koelstra et al. (2012). in turn, studied face video, EEG and peripheral physiological signals (GSR, blood volume pressure, respiration pattern, skin temperature, EMG and EOG) using the DEAP database. They
classified emotions in terms of arousal (from ‘inactive’ to ‘active’), valence (from ‘unpleasant’ to ‘pleasant’) and dominance (from ‘helpless’ and ‘weak feeling’ to ‘empowered feeling’), using a total of 9 distinct classes.
Their reported accuracy rates for arousal and valence from peripheral physiological signals were 57.0% and 62.7%, respectively. However, no information was provided on the accuracy of individual physiological signals. Hsieh and Chin (2011) used a fuzzy inference system to recognize emotions from HRV and facial images. The system ran on an embedded system with four discrete emotions: normal, happy, angry and sad. Despite its quite high average success rate, 82.03%, the system is not suitable for an anti-bullying application, as the webcam instrumentation for facial images is not practicable. No one wants to have a webcam in front of their face when going about their business.
Among emotion recognition databases that contain peripheral physiological signals, DEAP and Mahnob are the newest ones (Soleymani, et al., 2012). As a starting point, we used the Mahnob database. To the best of our knowledge, Mahnob-based publications, including those by Soleymani et al. (Soleymani, et al., 2012), Kortelainen and Seppänen (2013), Soleymani et al. (2012), do not make use of individual peripheral physiological signals.
The Mahnob database enables emotion recognition and multimedia implicit tagging with several modalities. Raw signals in this database are 32-channel EEG, 3-channel ECG, respiration rate, GSR, skin temperature, eye gaze, facial expression and audio. To create it, subjects were stimulated with pictures and short video clips.
Kreibig (2010) has established that emotion has a strong relationship with the autonomic nervous system (ANS). She has also shown that HRV is the most popular signal related to ANS. (Quintana, et al., 2012) state that HRV is a novel biological marker enabling emotion recognition in humans. They also explain how emotions influence the human body, affecting several physiological signals. This is the reason why this research started out with ECG, a signal from which HRV can be derived.
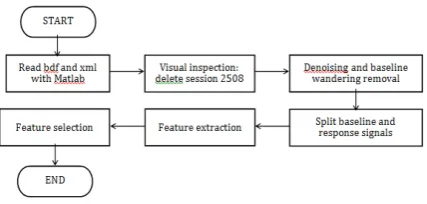
When using the Mahnob database, it is important to choose suitable data. The session ID range was selected to cover the entire range, while the emotion elicitation was set to Experiment Type. Both Stimulated and Complete fields were ticked YES. These parameters brought 565 items of data.
According to (Soleymani, et al., 2012), subjects number 9, 12 and 15 were excluded from the set owing to technical problems and unfinished data collection. During manual inspection, data from session 1984 was also discarded, because its duration is 0 seconds – meaning no data is available. Total data after these exclusions amounted to 513 and can be downloaded directly from Collections under the name of Selection of Emotion Elicitation. Figure 1 summarizes this section.
For each experiment, there are two files, one containing physiological data and the other session information. Physiological data is stored in a bdf file, while the session file is in the xml format. A Matlab script was written to read the bdf and xml files and to store the information in a mat file. After visual inspection, data from session 2508 was deleted, because it was corrupted. This made the total number of available data items 512.
ECG signals suffer from noise, induced by power line interference, electrode contact noise, motion artefacts, muscle contraction, baseline drift and instrumentation noise generated by electronic devices (Chandrakar, et al., 2013). These noises were removed with filters before further processing. Thus, to remove power line interference, a notch filter was used at 60 Hz, while baseline drift was removed by applying a high-pass filter at 0.4 Hz. Other noises were filtered out with a low-high-pass filter at 200 Hz.
At the next stage, ECG signals were split into a baseline and a response. The baseline corresponded to an unstimulated ECG signal, recorded 30 seconds before and after stimulation. During stimulation, the ECG signal was considered as a response signal. This splitting is important for observing the difference between the unstimulated and stimulated case.
Fig. 1: Process to select data from the Mahnob database.
Signal processing and classification:
With the ECG finished, feature extraction began. Extracted time-domain features included RMS of the Successive Difference between adjacent R-R intervals (RMSSD), Standard Deviation of the Successive Difference between adjacent R-R intervals (SDSD), Standard Deviation of all NN intervals (SDNN), the number of pairs of adjacent NN intervals differing by more than 50 ms (NN50), the number of pairs of adjacent NN intervals differing by more than 20 ms (NN20), the NN50 count divided by the total number of NN intervals (pNN50) and the NN20 count divided by the total number of NN intervals (pNN20) (Biopac System, Inc., 2013)(Thong, et al., 2003). Frequency-domain features included power spectral density for very low frequency (VLF), low frequency (LF), high frequency (HF) and the ratio of HF to LF (Lee & Chiu, 2010)(Sztajzel, 2004). On top of that, Poincaré analysis produced 2 features and we also calculated the ratio response to baseline features.
Next, emotion labels from the xml file were encoded in an arousal-valence space. Tables 1a and 1b show the convertion of discrete emotions to the arousal-valence space.
Table 1a: Emotional Keywords in the Arousal Scale (Soleymani, et al., 2012).
Arousal classes Emotional keywords
Calm sadness, disgust, neutral
Medium arousal joy and happiness, amusement
Excited/Activated surprise, fear, anger, anxiety
Table 1b: Emotional Keywords in the Valence Scale (Soleymani, et al., 2012)
Valence classes Emotional keywords
Unpleasant fear, anger, disgust, sadness, anxiety
Neutral surprise, neutral
Pleasant joy and happiness, amusement
This research chose the same as (Soleymani, et al., 2012), i.e., 0.05. When the one-way ANOVA found that certain features were not significant, i.e., p > 0.05, these features were rejected. This reduced the number of features from 39 to 6 for arousal and 2 for valence. Figure 2 illustrates this process.
Fig. 2: Process from database to feature selection.
This experiment used a SVM with libSVM for Matlab(Chang & Lin, 2011), with the SVM applying the RBF kernel and search C and parameters as in (Hsu, et al., 2006). The classifier searched for the best C and based on a 10-fold cross validation for both arousal and valence. First, it started with a coarse grid search, then continued with a fine grid search. It was recommendable to use a narrow search instead of a wide one, as the latter would be time-consuming. As a starting point, (Hsu, et al., 2006) recommended using exponentially growing sequences for both C and g. Usually, C values are greater than values. Figure 3 presents the experimental procedure with libSVM. During the experiment, 10 different cases of 10-fold cross validation were generated.
Experiment Results:
Tables 2 and 3 show the results for arousal and valence. The first column of the tables shows the #case for a 10-fold cross validation. It also presents the best C and parameters for the highest accuracy obtained. As seen, the average accuracy for arousal and valence are 47.69% and 42.55%, respectively.
Fig. 3: Experimental procedure with libSVM for both arousal and valence.
Table 2: Best parameter C and with 10-fold cross validation in the arousal scale.
Cases C Accuracy
1 1048576 4.8828e-04 48.1%
2 62614784 2.4414e-04 47.3%
3 65536 0.0313 47.6%
4 1024 0.1250 47.4%
5 16384 0.0156 47.5%
6 65536 0.0313 47.6%
7 16384 0.0156 47.5%
8 1048576 4.8828e-04 47.4%
9 4194304 2.4414e-04 48.05
10 1048576 4.8828e-04 48.5%
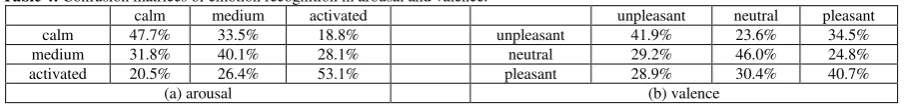
Table 4 shows confusion matrices for experiments conducted to determine arousal and valence. Each row indicates a classified label, while the columns show the truth label and achieved accuracy. For example, 47.7%
Table 3: Best parameter C and with 10-fold cross validation in the valence scale.
Cases C Accuracy
1 268435456 6.1035e-05 42.4%
2 16777216 2.4414e-04 43.5%
3 16777216 2.4414e-04 42.0%
4 67108864 2.4414e-04 41.4%
5 16777216 2.4414e-04 42.2%
6 16777216 6.1035e-05 43.0%
7 1048576 0.5 43.2%
8 8388608 2.4414e-04 42.8%
9 8388608 2.4414e-04 41.2%
10 58421659 3.0057e-04 43.8%
Discussions:
It may be concluded from the confusion matrices, that the classifier used in this research is comparable to that used in (Soleymani, et al., 2012) for all physiological signals. For all class labels, the achieved accuracy was clearly above the chance level (33%). Nonetheless, the accuracy for true positives was not high compared to false negatives and positives. It is thus clear that the classifier must be adjusted or replaced by another classifier. To improve accuracy, it might be useful to find new alternative features.
Table 4: Confusion matrices of emotion recognition in arousal and valence.
calm medium activated unpleasant neutral pleasant
calm 47.7% 33.5% 18.8% unpleasant 41.9% 23.6% 34.5%
medium 31.8% 40.1% 28.1% neutral 29.2% 46.0% 24.8%
activated 20.5% 26.4% 53.1% pleasant 28.9% 30.4% 40.7%
(a) arousal (b) valence
During the experiments, the general approach to SVMs presented and recommended in (Hsu, et al., 2006) proved very useful. We also heeded the recommendation to use a small grid value to avoid long-time iterations. Thus, for small grid values, each iteration took 3 to 15 minutes. In addition, as suggested in (Hsu, et al., 2006), the C parameter turned out to be larger than the parameter.
One-way ANOVA-based feature selection indicated that, with a p value of 0.000132, the most relevant feature for arousal was NN20 of the response signal. For valence, the most influential feature was the ratio of HF to LF, obtained from the response signal by frequency domain analysis. The recorded p value was 0.013945. When the p value threshold was set to equal 0.05, the ratio of HF to LF proved a relevant parameter for both arousal and valence.
It would be interesting to study ECG, respiration rate, GSR and body temperature to find out which has the strongest relationship with emotion. This type of research would help to select which signals to include in emotion recognition experiments with limited resources. We may presume that GSR or body temperature would be good candidates, since people can control their respiration rate. It is worth noting here that combining several physiological signals would also be necessary, although no one can guarantee the result. Another future initiative is to extend research to include the dominance scale. Psychologists, after all, use the VAD (valence-arousal-dominance) scale to represent emotion.
Conclusions:
This work provided a baseline for emotion recognition research based on ECG signals. Using data from the Mahnob database, we obtained an accuracy of 47.69% and 42.55% for arousal and valence, respectively. These values do not differ significantly from those reported on (Soleymani, et al., 2012) for peripheral physiological signals. If emotion was determined not only in terms of valence and arousal but also in terms of dominance, this work could be seen as an extension of the previous effort.
Based on the one-way ANOVA’s feature selection by the p-value of 0.05, the ratio of HF to LF in the response signal proved an important feature for both valence and arousal. Among all features, NN20 was the strongest with a p-value of 0.000132.
Future work will include experimenting with instrumentation to determine such physiological signals as GSR, body temperature and respiration rate. The results may be combined with this experiment to raise the overall accuracy level. Sorting out physiological signals with high accuracy from among a number of signals is important, since the final application will use a smartphone with limited resources. The idea is to use the least possible signal.
ACKNOWLEDGEMENT
REFERENCES
Biopac System, Inc, 2013. Application Note 129 Heart Rate Variability. [Online]
Available at: https://www.biopac.com/Manuals/app_pdf/app129.pdf
[Accessed 21 January 2014].
Borg, M.G., 1998. The Emotional Reactions of School Bullies and their Victims. Educational Psychology: An International Journal of Experimental Educational Psychology, 18(4): 433-444.
Caponetti, L., C.A. Buschicchio, G. Castellano, 2011. Biologically inspired emotion recognition from speech. EURASIP Journal on Advances in Signal Processing, 24(1): 1-10.
Chandrakar, B., O.P. Yadav, V.K. Chandra, 2013. A Survey Of Noise Removal Techniques For ECG Signals. International Journal of Advanced Research in Computer and Communication Engineering, March, 2(3): 1354-1357.
Chang, C.C., C.J. Lin, 2011. LIBSVM : a library for support vector machines. ACM Transactions on Intelligent Systems and Technology (TIST), 2(3-27) : 1-27:27.
Guo, B., M.S. Nixon, 2009. Gait Feature Subset Selection by Mutual Information. IEEE Transactions on Systems, Man, and Cybernetics - Part A: Systems and Humans, 39(1): 36-46.
Hsieh, P.Y., C.L. Chin, 2011. The Emotion Recognition System with Heart Rate Variability and Facial Image Features. Taipei, Taiwan, s.n.
Hsu, C.W., C.C. Chang, C.J. Lin, 2006. A Practical Guide to Support Vector Classification. [Online]
Available at: http://www.csie.ntu.edu.tw/~cjlin/papers/guide/guide.pdf
[Accessed 21 January 2014].
Hunter, S.C., M.G. Borg, 2006. The Influence of Emotional Reaction on Help Seeking by Victims of School Bullying. Educational Psychology: An International Journal of Experimental Educational Psychology,
26(6): 813-826.
Koelstra, S., et al., 2012. DEAP: A Database for Emotion Analysis using Physiological Signals. IEEE Trans. Affective Comptuing, 3(1): 18-31.
Kortelainen, J., T. Seppänen, 2013. EEG-based Recognition of Video-induced Emotions: Selecting Subject-independent Feature Set. Osaka, Japan, s.n.
Kreibig, S.D., 2010. Autonomic Nervous System Activity in Emotion: A Review. Journal of Biological Psychology, 84(3): 394-421.
Lee, T.C., H.W. Chiu, 2010. Frequency-domain Heart Rate Variability Analysis Performed by Digital Filters. Belfast, s.n., 589-592.
Mena, M.E., 2012. Emotion Recognition from Speech Signals, Ljubljana: University of Ljubljana.
Nwe, T.L., S.W. Foo, L.C. De Silva, 2003. Speech emotion recognition using hidden Markov models.
Speech Communication, 41(4): 603-623.
Ortega, R., et al., 2012. The Emotional Impact of Bullying and Cyberbullying on Victims: A European Cross-National Study. Aggressive Behavior, 38(5): 342-356.
Pierre-Yves, O., 2003. The production and recognition of emotions in speech: features and algorithms.
International Journal Human-Computer Studies, 59(1-2): 157-183.
Quintana, D.S., et al., 2012. Heart rate variability is associated with emotion recognition: Direct evidence for a relationship between the autonomic nervous system and social cognition. International Journal of Psychophysiology, 86(2): 168-172.
Soleymani, M., J. Lichtenauer, T. Pun, M. Pantic, 2012. A Multimodal Database for Affect Recognition and Implicit Tagging. IEEE Transactions on Affective Computing, 3(1): 1-14.
Soleymani, M., M. Pantic, P. Thierry, 2012. Multimodal Emotion Recognition in Response to Videos.
IEEE Transactions on Affective Computing, 3(2): 211-223.
Sztajzel, J., 2004. Heart rate variability: a noninvasive electrocardiographic method to measure the autonomic nervous system. Swiss Medical Weekly, 134(35): 514-522.
Thong, T., et al., 2003. Accuracy of Ultra-Short Heart Rate Variability Measures. Cancun, Mexico, s.n., 2424-2427.