TECHNICAL REPORT:
2013 SERO-SENTINEL SURVEILLANCE
AND
2013 RAPID BEHAVIORAL SURVEY
Technical Report: 2013 Sero-Sentinel Sur
veillance And 2013 Rapid Behavioral Sur
vey
1
TECHNICAL REPORT:
2013 SERO-SENTINEL SURVEILLANCE
AND
2013 RAPID BEHAVIORAL SURVEY
veillance And 2013 Rapid Behavioral Sur
vey
Katalog Dalam Terbitan. Kementerian Kesehatan RI
Indonesia. Kementerian Kesehatan RI. Direktorat Jenderal Pengendalian Penyakit dan Penyehatan Lingkungan
Technical report: 2013 sero - surveilance survey And 2013 rapid behavioral survey. - Jakarta: Kementerian Kesehatan RI. 2014
ISBN 978-602-235-796-4
1. Judul I. HUMAN IMMUNODEFICIENCY SYNDROME 616.91
Technical Report: 2013 Sero-Sentinel Sur
veillance And 2013 Rapid Behavioral Sur
vey
1 This report contains the results of the 2013 HIV Sero-Surveillance Survey and the Rapid
Behavioral surveys. In its first part, the report describes the results of the 2013 HIV Sero-Surveillance Survey Survey (SSS) conducted by the Ministry of Health (MOH) and in its second part, it provides the results of the 2013 Rapid Behavioral survey (RBS) conducted by the National AIDS Commission (NAC).
The 2013 Sero-Surveillance Survey was conducted among direct female sex workers (DFSW), people who inject drugs (PWID), men who have sex with men (MSM) and transgenders in 22 cities while the 2013 Rapid Behavioral Survey included MSM, DFSW, and PWID in 8 cities.
The Sero-Surveillance Survey aimed to determine the magnitude of the HIV epidemic and syphilis among key populations and the Rapid Behavioral Survey studied the prevalence of associated risk factors. The results of these surveys will serve to set targets for the new national HIV/AIDS national strategic plan and for planning and/or modifying existing programs to prevent HIV in Indonesia.
DFSW and transgender participants were sampled using a two stages probability proportional to size method while MSM and PWID were sampled using the respondent driven sampling method (RDS). The target sample sizes were 250 for each key population
per site for the 2013 SSS and 240 per site for the 2013 Rapid Behavioral Survey.
A total of 6603 participants were recruited for the 2013 SSS. Of those, 3685 were DFSW, 985 were transgenders, 978 were PWID, and 985 were MSM.
The total number of participants in the 2013 Rapid Behavioral Survey was 2829. Of these, 1120 were DFSW, 989 were PWID, and 720 were MSM.
Characteristics of Respondents
In the 2013 SSS, direct female sex workers represented 55.8% of participants, PWID and transgenders represented each 14.8%, and MSM represented 14.5% of participants. The distribution of all key populations by location was as followed: 14% were from Malang, 15% from Surabaya, 15% from Jakarta and 15% from Bandung. All the other locations had less than 7% of the participants.
In the 2013 Rapid Behavioral Survey, 25% of the participants were MSM, 40% DFSW and 35% were PWID. By location, Jakarta, Bandung and Surabaya contributed each 17% of participants; Denpasar 14% and Malang, Medan and Banyuwangi contributed each 8%.
veillance And 2013 Rapid Behavioral Sur
vey
HIV and STI Prevalence
HIV prevalence was highest among the PWIDs with 44.5% and it was followed by
transgenders with 19%, MSM with 17.3% and DFSW with 10%.
The highest HIV prevalence among PWID was found in Malang (59.1%) and the
lowest in Bandung (27.1%). In Jakarta, Surabaya and Medan HIV prevalence among PWID was 49.2%, 48.8% and 27.3% respectively
HIV prevalence among MSM was highest in Surabaya with 22.1% followed by
Bandung (21.3%), Jakarta (19.6%) and lastly by Malang (6.3% )
Jakarta had the highest HIV prevalence among transgenders with 29.6% followed by
Surabaya with 27.5%, Bandung and Malang with 9.6% and 9.2% respectively
The highest prevalence among DFSW was found in Jayawijaya (32.5%) and the lowest
was noted in Deli Serdang (1.6%)
HIV prevalence among DFSW was 20.3% in Denpasar and Jayapura, Ambon, and
Surabaya had HIV prevalence among DFSW above 10%
The prevalence of syphilis was 6.6% among all the participants in the 2013 SSS.
The highest prevalence of syphilis was among transgenders (16.2%), followed by
MSM (12.7%) and direct female sex workers (5.5%).
The highest prevalence of syphilis prevalence among PWID, was recorded in Medan
(7.3%), followed by Jakarta (3.8%) and Bandung (1.3%).
Malang and Surabaya did not register any case of syphilis among PWID in the 2013
Sero-Surveillance Survey
The highest prevalence of syphilis among MSM was recorded in Bandung at 15.4%,
followed by Surabaya and Jakarta with 14.6% and 14.2% respectively. In Malang, syphilis prevalence among MSM was 6.7%.
Among transgenders, Jakarta had the highest syphilis prevalence with 29.2%,
followed by Surabaya with 17.1%, Bandung with 14% and Malang was last with 4,2%
The prevalence of syphilis among DFSW was highest in Jayawijaya (33.3%), followed
by Ambon (10.2%), Denpasar (7.3%) and Malang and Lampung (6.8% and 6.4% in respectively).
The lowest prevalence of syphilis among DFSW was recorded in Batang (1.2%).
The comparison of HIV and syphilis prevalence between 2013 Sero-Sentinel Survey and 2011 Integrated Biological and Behavioral Survey
Technical Report: 2013 Sero-Sentinel Sur
veillance And 2013 Rapid Behavioral Sur
vey
3
The prevalence of syphilis significantly declined from 27.5% to 16.2% among
transgenders. [p<0.000001, OR=1.96 (1.57-2.44)] and from 8.8% to 5% among DFSW [p<0.000001, OR=1.82(1.48-2.24)]
HIV prevalence increased significantly in Malang from 36.4% to 59.1% [p<0.001,
OR=0.4 (0.27-0.58)]
HIV prevalence among MSM increased in Bandung and in Surabaya from 10.4%
to 21.3% [p=0.001, OR=0.43(0.26-0.72)] and from 10% to 17.3% [p<0.001, OR=0.53(0.4-0.69)]
HIV prevalence among transgenders significantly decline in Malang from 16.8% to
9.2% [p=0.017, OR=2.01(1.16-3.48)]
The prevalence of syphilis among transgenders declined significantly in Bandung
from 26.4% to 14% [p<0.001, OR=2.19(1.39-3.46)] and in Malang from 20.8% to 4.2% [p<0.001, OR=6.07(3-12.26)]
HIV prevalence among DFSW significantly decreased in Jakarta and in Bandung from
10.5% to 3.8% [p=0.0046, OR=3 (1.38-6.56)] and from 20.7% to 9.4% [p=0.0013, OR=2.53(1.45-4.4) respectively
The overall syphilis prevalence among DFSW declined from 9.8% from the 2011
Integrated Biological and Behavioral Survey to 5.7% in the 2013 Sero-Surveillance
Survey.
Syphilis prevalence among DFSW significantly decreased in five of the 15 locations
surveyed. It decreased from 16.6% to 4.8% [p<0.05, OR 0.42(0.28-0.63)] in Deli Serdang. It also decreased from 11.6% to 3.3% [p=0.001, OR=3.3(1.5-6.75)] in Batam, from 10.4% to 2.8% [p<0.001, OR=4.03(1.7-9.72)] in Bandung; from 12.4% to 4.6% [p=0.003, OR=2.96(1.45-6.04)] in Surabaya and from 13.4% to 1.2% [p<0.0001, OR=13.1(3.88-44.2)] in Batang. Trends of HIV prevalence among Key Populations, 2007, 2011-2013
Risk behaviors among key population from the 2013 Rapid Behavioral Survey
The highest number of clients per DFSW per week was noted in Denpasar (14
clients) followed by Malang (eight clients) and Banyuwangi (seven clients).
Condom use during the last commercial sexual intercourse among DFSW was 76.5%
in Denpasar, 71.3% in Malang and Banyuwangi and 68.8% in Semarang.
Consistent condom use during the last week preceding the survey was 65.5% in
Denpasar, 38.3% in Semarang, 35.1% in Banyuwangi and 24.2% in Malang.
More than two thirds (73%) of MSM in Jakarta used condoms during their last sexual
intercourse, compared to 43% in Bandung and 53% in Surabaya.
In none of the three cities surveyed, MSM reported the use of injectable drugs.
The proportion of PWID who have tested for HIV was highest in Medan (66.2%);
veillance And 2013 Rapid Behavioral Sur
vey
Jakarta, Bandung, and Semarang had rates of PWIDs who shared needles at their
last injection above 10%
The proportion of PWIDs sharing needles was lowest in Surabaya (0.8%) followed by
Medan (3.1%).
Comparison between risk behaviors between 2013 Rapid Behavioral Survey and 2011 Integrated Biological and Behavioral Surveyin the some locations
The median number of clients per DFSW per week remained high
Significant declined of the proportion of DFSW who used condom during their last
sexual encounter in Malang from 83.2 % to 71.3 % [P=0.0025, OR= 1.99 (1.29-3.07)] and was from 90 % to 76.5% [P=0.00003, OR=2.74(1.71-4.4) in Denpasar.
Significant decline of proportion of reported consistent condom use during the last
week prior to the survey among DFSW from 35.1% to 12.5% [P<0.001, OR=3.78(2.38-5.99)] in Bandung and from 44.9% to 24.2% [P<0.001, OR=2.57 (1.74-3.780] in Malang.
Significant increase in condom use during commercial sex among DFSW during the
same period from 49.6% to 65.5% in Denpasar [P<001, OR=0.52 (0.38-0.72)].
The percentage of MSM injecting drugs dropped from 5% to 0% in Jakarta between
2011 and 2013 (p<001) but remained stable in the other cities.
The proportion of MSM who used condom during their last sexual encounter dropped
significantly in Surabaya from 75.9% to 53% [P=00001, OR=2.79(1.9-4.1)].
The comparison of data from the 2011 Integrated Biological and Behavioral Survey
and the 2013 Rapid Behavioral Survey revealed that there have been a significant drop in the proportion of PWIDs who ever tested for HIV from 59.6% to 41.3% in Bandung [P<0.001, OR=2.1(1.5-3)]. This was also noted in Denpasar from 77.6% to 47.5% [P<0.001, OR=3.83(2.59-5.66)] from 2011 Integrated Biological and Behavioral Survey
to the 2013 Rapid Behavioral Survey
During the same period of time, proportion of PWIDs who shared needles during the
last injection dropped significantly from 18 % to 10.8 % [P=0.033, OR=1.81(1.07-3.04)] in Bandung and from 8.4 % to 0.8 % [P=0.0002, OR=10.9(2.5-47.07)] in Surabaya.
The trends analysis from 2007 to 2013 showed that:
Statistically significant decline of HIV prevalence of about 15% among PWIDs in
Technical Report: 2013 Sero-Sentinel Sur
veillance And 2013 Rapid Behavioral Sur
vey
5
HIV prevalence increased among MSM in Jakarta, Bandung and Surabaya from 8.1%
to 19.6% [p=0.00031, OR=2.837], from 2% to 21.3% [p<0.00001, OR=13.22] and from 5.6% to 22.1% [p<0.00001, OR=4.778] respectively.
The prevalence of syphilis increased among MSM in Jakarta from 3.2% to 14.2%
[p=0.00013, OR=5.055]; in Bandung from 5.6% to 15.4% [p=0.034, OR=2.129] and in Surabaya it increased from 4% to 14.6% [p=0.00008, OR=4.098].
The analysis revealed that HIV prevalence among transgenders decreased by 5%
from its 24.4% level in 2007 to 19% in 2013. [p=0.00284, OR=0.726].
The prevalence of syphilis declined among transgenders from 24.4% to 16.2%
[p=0.00001, OR=0.599] and among DSFW from 6.2% to 5% [p=0.0317, OR=0.796].
HIV prevalence among transgenders significantly declined in Malang 16.8% to 9.2%
[p=0.00792, OR=0.497] from 2007 to 2013.
The prevalence of syphilis among transgenders significantly declined from 25.2%
to 14% in Bandung [p=0.00204, OR=.0483]; from 28.8% to 17.1% in Surabaya [p=0.00198, OR=.509] and from 20.8% to 4.2% [p<0.00001, OR=0.165]in Malang between 2007 and 2013
HIV prevalence significantly declined among PWIDs by 50% in Medan and in by 37%
in Bandung between 2007 and 2013 [p=0.00014, OR=0.496].
The prevalence of syphilis increases significantly among PWIDs in Jakarta and
Bandung from 0.1% to 3.8% [p=0.03, OR=9.86] and from 0% to 1.3% [p=0.033, OR=9.818]
Between 2007 and 2013, HIV prevalence declined significantly among DFSW from
6.1% to 1.6% [p=0.00662, OR 0.254] in Deli Serdang; from 10.2% to 3.8% [p=0.00654, OR=0.337] in Jakarta and from 6.6% to 2.5% [p=0.0229, OR=0.36. in Semarang.
HIV prevalence among DFSW increased in Surabaya from 6.5% to 12.5% [p=0.02754,
OR=2.089] and in Denpasar from 14.1% to 20.3% [p=0.04, OR=1.56] between 2007
and 2013
Syphilis prevalence declined among DFSW in Deli Serdang from 12.9% to 4.8%
[p=0.0037, OR=0.342], in Batam from 16.8% to 3.8% [p<0.00001, OR=0.198] and in Jakarta from 9.2% to 2.5% [p=0.00084, OR=0.253] between 2007 and 2013
The prevalence of syphilis among DFSW also declined in Jayapura from 6% to 2.4%
[p=0.027, OR=2.6(1.08-6.23)].
The prevalence of syphilis among DFSW increased in Batang from 0.9% to 1.2%
[p=0.00713, OR=1.488] and in Ambon from 5.2% to 10.2% [p=0.048, OR=0.47(0.22-1)]
The data showed a strong relation between HIV and syphilis prevalence among all
veillance And 2013 Rapid Behavioral Sur
vey
SUMMARY 1
TABLE OF CONTENTS 7
LIST OF TABLES 10
LIST OF FIGURES 11
LIST OF ABBREVIATIONS 12
CHAPTER I: INTRODUCTION 13
1. Background 13
2. Scope 15
3. Outcomes 15
CHAPTER II: METHODOLOGY 16
2.1. Sero-Surveillance Survey 16
2.1.1. Selection criteria 16
2.1.1.1. Sampling 16
2.1.2. Biological testing and quality assurance 17
2.1.3. Locations 18
2.2. Rapid Behavioral Survey 19
2.2.1. Sample size 19
2.2.2. Tools 19
2.3. Implementation 19
2.4. Analysis 19
CHAPTER III:RESULTS 21
3.1. Results of the 2013 HIV Sero-Surveillance Survey 21
3.1.1. Participation rate 21
3.1.2. Characteristics of the Population Groups 22
3.1.3. HIV prevalence 22
3.1.3.1. HIV prevalence among different key population 22
Technical Report: 2013 Sero-Sentinel Sur
veillance And 2013 Rapid Behavioral Sur
vey
7
3.1.4. Prevalence of syphilis 27
3.1.4.1. Syphilis prevalence among different key population 27
3.1.4.2. Prevalence of Syphilis among PWID 27
3.1.4.3. Prevalence of syphilis among MSM 27
3.1.4.4. Prevalence of syphilis among transgenders 28
3.1.4.5. Prevalence of syphilis among DFSW 29
3.1.5. Comparison between HIV and syphilis prevalence between 2011 Integrated
Biological and Behavioral Survey and 2013 Sero-Surveillance Survey 31
3.1.6. Trends analysis of HIV and syphilis prevalence among key populations between
2007 and 2013 33
3.1.6.1. Trends of HIV prevalence among Key Populations, 2007-2013 33
3.1.6.2. Trends of HIV Prevalence among Key Populations by Location, 2007-2013 34
3.1.6.3. Trends of HIV Prevalence among PWIDs by Locations, 2007-2013 34
3.1.6.4. Trends of Syphilis Prevalence among PWIDs by Locations, 2007-2013 35
3.1.6.5. Trends of HIV Prevalence among MSM by Locations, 2007-2013 35
3.1.6.6. Trends of Syphilis Prevalence among MSM by Locations, 2007-2013 36
3.1.6.7. Trends of HIV Prevalence among Transgenders by Locations, 2007-2013 36 3.1.6.8. Trends of Syphilis Prevalence among Transgenders by Locations, 2007-2013 37
3.1.6.9. Trends of HIV Prevalence among DFSW by Locations, 2007-2013 37
3.1.6.10. Trends of Syphilis Prevalence among DFSW by Locations, 2007-2013 38
3.1.6.11. Relationship between HIV Prevalence and Syphilis prevalence among
Different Key Populations, Sero-Surveillance Survey 2013 39
3.2. Results of the 2013 HIV Rapid Behavioral survey 40
3.2.1. Participation rate 40
3.2.2. Risk behaviors among key population 40
3.2.2.1. Direct female sex workers 40
3.2.2.2. Men who have sex with men 41
3.2.2.3. People who inject drugs 42
3.2.3. Comparison between risk behaviors between the 2011 Integrated Biological
and Behavioral Survey and 2013 Rapid Behavioral Survey 45
CHAPTER IV: CONCLUSION, DISCUSSION AND RECOMMENDATIONS 46
4.1. Conclusion 46
4.2. Discussion 48
4.3. Recommendations 50
veillance And 2013 Rapid Behavioral Sur
vey
Table 1 : List of provinces, districts/cities and the number of the participating sites 18
Table 2 : Planned Sample Size and Sampling Method by Target Population and Location 21 Table 3 : Prevalence of HIV and Syphilis per Target Group of Key Affected Populations
in the Sero-Surveillance Survey 2013 22
Table 4 : HIV Prevalence among PWID per Location in IBBS 2011 and Sero-Surveillance
Survey 2013 23
Table 5 : HIV Prevalence among the MSM per Location in IBBS 2011 and in
Sero-Surveillance Survey (SS) 2013 24
Table 6 : HIV Prevalence among the transgenders per location in IBBS 2011 and in
Sero-Surveillance Survey (SS) 2013 25
Table 7 : HIV Prevalence of DFSW per location in IBBS 2011 and Sero-Surveillance
Survey 2013 26
Table 8 : Prevalence of Syphilis among PWID per Location in IBBS 2011 and
Sero-Surveillance Survey 2013 27
Table 9 : Prevalence of Syphilis among the MSM per Location in IBBS 2011 and in
Sero-Surveillance Survey (SS) 2013 28
Table 10 : Prevalence of Syphilis among the Transgenders by Location in IBBS 2011 and in
Sero-Surveillance Survey (SS) 2013 29
Table 11 : Prevalence of Syphilis among the DFSW by Location in IBBS 2011 and in
Sero-Surveillance Survey (SS) 2013 30
Table 12 : Comparing HIV prevalence among key population in the same locations for IBBS
2011 and Sero-Surveillance Survey 2013 31
Table 13 : Prevalence of Syphilis among PWID by Location, 2011-2013 32
Table 14 : Sample sizes by locations for the Rapid Behavioral Survey, 2013
Sero-Surveillance Survey 40
Table 15 : Prevalence of Risk Behaviors among DFSW in Semarang and Banyuwangi,
2011-2013 41
Table 16 : Prevalence of Risk Behaviors among DFSW in Malang and Denpasar,
2011-2013 41
Table 17 : Prevalence of Risk Behaviors among MSM inJakarta, Bandung and Surabaya,
2011-2013 42
Table 18 : Prevalence of risk Behavior among PWID in Medan, 2010-2013 43
Technical Report: 2013 Sero-Sentinel Sur
veillance And 2013 Rapid Behavioral Sur
vey
9
Figure 1 : Trends of HIV Prevalence among Key Populations, 2007-2013 33
Figure 2 : Trends of HIV Prevalence among Key Population by Location, 2007-2013 34
Figure 3 : Trends of HIV Prevalence among PWIDs by Locations, 2007-2013 34
Figure 4 : Trends of Syphilis Prevalence among PWIDs by Locations, 2007-2013 35
Figure 5 : Trends of HIV Prevalence among MSM by Locations, 2007-2013 35
Figure 6 : Trends of Syphilis Prevalence among MSM by Locations, 2007-2013 36
Figure 7 : Trends of HIV Prevalence among Transgenders by Locations, 2007-2013 36
Figure 8 : Trends of Syphilis Prevalence among Transgenders by Locations,
2007-2013 37
Figure 9 : Trends of HIV Prevalence among DFSW by Locations, 2007-2013 38
Figure 10 : Trends of Syphilis Prevalence among DFSW by Locations, 2007-2013 38
Figure 11 : Correlation between HIV and Syphilis Prevalence among DFSW, MSM, and
Transgenders, SSS 2013 39
veillance And 2013 Rapid Behavioral Sur
vey
AIDS : Acquired Immune Deficiency Syndrome
CIS : Cluster Information System
DFSW : Direct Female Sex Workers FSW : Female sex workers
HIV : Human Immunodeficiency Virus
HRM : High Risk Men
IBBS : Integrated Biological Behavioral Survey IFSW : Indirect Female Sex Worker
MOH : Ministry of Health
MSM : Men who have sex with men
NAC : National AIDS Commission
NGO : Non-Governmental Organization PWID : People Who Inject Drugs
RBS : Rapid Behavioral Survey
RDS : Respondent Driven Sampling
RPR : Rapid plasma reagin
PPS : Probability Proportional to Size
SSS : Sero-Surveillance Survey
STI : Sexually Transmitted Infection
TPHA : Treponema pallidum particule agglutination assay WHO : World Health Organization
SRS : Simple Random Sampling
Technical Report: 2013 Sero-Sentinel Sur
veillance And 2013 Rapid Behavioral Sur
vey
11
1. Background
Indonesia is facing one of the fast growing HIV epidemic in the Southeast Asia region. With an estimated half a million people believed to be infected by HIV in Indonesia[1]. Indonesia has both concentrated epidemic in the majority of its districts and a generalized epidemic in the Papua region[2]. Given the mortality and morbidity caused by the disease, it is very important to continuously monitor its burden in order to orient efficiently prevention and support programs and evaluate the response put in place to tackle the epidemic. Hence, the country has instituted HIV surveillance. This is a systematic data collection on HIV, followed by analysis, interpretation to collected data, and dissemination for utilization for HIV programs design, planning and for the evaluation of impacts in the community.
Since 1988, Indonesia conducted HIV Sero-Surveillance Survey and Syphilis in two provinces, Jakarta and East Java to measure the burden and the trend of HIV and Syphilis distribution among sex workers. For more representativeness of the HIV surveillance, the number of provinces and districts participating in HIV surveillance and the target groups increased over the years. Since then, HIV prevalence surveillance was conducted as sentinel surveillance or as ad hoc exercises. Other key populations including men who have sex with men (MSM), direct female commercial sex workers (DFSW), indirect female sex workers (IDFSW), people who inject drug (PWID), transgenders and other high risk populations who are at risk of getting HIV due to their occupations such as fishermen, truck drivers (called high risk men (HRM) were included.
From 1996, a surveillance of risky behaviors exposing individuals to HIV was instituted. This was followed by the adoption of the report on the second generation of HIV surveillance[3] and the HIV surveillance system in Indonesia included HIV prevalence, risky behaviors and knowledge about HIV prevention and HIV program coverages. In 2007, for the first time, Indonesia conducted its first integrated biological and behavioral survey(IBBS)[1], which was followed by two other rounds in 2011[2] in the same geographical areas. However, given the large size of the country and logistic challenges to conduct the integrated biological and behavioral survey across the country at once, IBBS was conducted in two groups of provinces in two different waves of surveys. The survey also included the measurement of sexually transmitted infections (STIs) as STIs increases the transmission of HIV [4]. Therefore, an increase in STIs may indicate a potential risk of increased HIV prevalence.
HIV prevalence has been high in some key populations in most of the districts in Indonesia except in Papua region where the infection has reached the general population The 2000 Sentinel Surveillance showed that HIV prevalence among the female sex workers (FSW) was greater than 5% in several locations. It was even higher as 26.5% in Sorong (Papua).
veillance And 2013 Rapid Behavioral Sur
vey
STIs prevalence remains high among sexual active and other adult key populations in Indonesia. The 2011 Integrated Biological and Behavior Survey indicated that prevalence of gonorrhea in several locations was between 19% and 38%, the prevalence of chlamydia ranged between 21% and 41%, syphilis was found among 2% and 10% of tested adults. It also showed that HIV prevalence was between 0.7% and 41% and both gonorrhea and or chlamydia were concomitantly found among 33% to 56% of tested adults[2].
STIs prevalence may also reflect condom use behavior. An increasing condom use will reduce STIs’ incidence and prevalence, and if sustained, it can also have an impact on the reduction of HIV prevalence with time. The STIs prevalence is also able to inform on the coverage and quality of the STI control program. Therefore, given the higher prevalence of STIs among key populations and the great concern that the prevalence of HIV in Indonesia is increasing following the pattern of STIs distribution, a periodical data monitoring of STI prevalence as part of HIV surveillance is needed, to see the trend of sexual behavior, and the potential of HIV transmission [4]. STI’ surveillance may serve as a tool for monitoring, evaluation, and planning of STI and HIV and AIDS control program.
With the introduction of the second generation of HIV surveillance approach, Indonesia started monitoring risky behaviors among key populations.
In 2010, the national AIDS commission, in collaboration with different partners and local authorities, conducted the first rapid behavioral survey among PWID and female commercial sex workers. PWID were surveyed in 8 cities (Medan, Palembang, DKI Jakarta, Bandung, Semarang, Surabaya, Denpasar, Makassar) and were recruited from 10 cities (Bintan, Palembang, Jakarta Barat, Semarang City, Malang, Banyuwangi, Denpasar, Makassar, Jayapura and Sorong City) respectively. This survey showed that 73% PWID did not share needles at their last injection, 63% of them did not share needles in their last week injections, 61% of them did not share needles in the last moth injections and 35% did not share needles during injections in the past last year prior to the survey[5, 6].
Technical Report: 2013 Sero-Sentinel Sur
veillance And 2013 Rapid Behavioral Sur
vey
13
2. Scope
This report aimed to provide data to assess the impact of the national response to the HIV epidemic. It aims at:
Determining the prevalence of HIV and syphilis among key affected populations in
twenty-three districts/cities in Indonesia in 2013.
Determining the trends of the prevalence of HIV and syphilis among key affected
populations in twenty-two districts/cities in Indonesia by comparing these results with the 2007 and 2011 IBBS, and 2013 Sero-Surveillance Survey.
Determine trends in the level of selected HIV related risk behaviors among key
affected populations in twenty-two districts/cities in Indonesia and comparing them with the 2007 IBBS and 2011 IBBS.
3. Outcomes
The report provides information about the following indicators for the locations and cities surveyed:
1. Prevalence of HIV among PWIDs, MSM, transgenders and direct FSW 2. Prevalence of syphilis among PWIDs, MSM, transgenders and direct FSW 3. Number of DFSW’s clients per week
4. Proportion of DFSW who used condom during the last commercial sex 5. Proportion of DSFW who used condoms in commercial sex the last week 6. Proportion of MSM who ever injected drug
7. Proportion of MSM who used condom at their last commercial sex 8. Proportion of PWIDs who ever tested for HIV
veillance And 2013 Rapid Behavioral Sur
vey
2.1. Sero-Surveillance Survey
The Sero-Surveillance Survey was a cross-sectional, using a two-stage sampling techniques. It was conducted from July to October 2013 in 22 cities/districts from 11 provinces. For the Sero-Surveillance Survey DFSW were recruited form 16 cites, PWID were recruited from five cities, transgenders were from four cities, and MSM were recruited from four cities (Table 2).
The population for the Sero-Surveillance Survey included direct female sex workers, people who inject drugs, transgenders and men who have sex with men. The participants for the Sero-Surveillance Survey wererecruited from multiple sites, including community health centers, hotspots, support groups and community based organizations.
2.1.1. Selection criteria
To be included in the study, participants should have been identified to one of the key population definitions below:
Direct female sex worker (DFSW) - a woman who operates openly as a commercial
sex worker;
Transgenders are biologically males but behave and feel like women. Transgenders
in this 2013 Sero-Surveillance Survey are not only sex workers but also include those who work in salons;
Men who have sex with men includes men who consider themselves as gay or those
who do not but have sex with men and includes men who are bisexual as well as homosexual;
People who inject drugs are people who inject drugs or have a history of injecting
drugs in the last 1 year.
2.1.1.1. Sampling
During the sampling of DFSW and transgenders, the first stage consisted into selecting sample at the survey sites by using the Cluster Information Sheet (CIS) application according to the decided sampling framework. The CIS application was used to perform the sample selection at the survey sites using Probability Proportional to Size
Technical Report: 2013 Sero-Sentinel Sur
veillance And 2013 Rapid Behavioral Sur
vey
15
The respondents driven sampling was used for mobile and hard to find key populations such as MSM and PWID. This sampling method was used because behavior in which these subpopulations engaged in is illegal or stigmatized. A total of eight participants were selected by the surveyors and recruited as seeds. These seeds recruited the next wave of participants who also went on to recruit each three (3) other participants using the snowball technique until the end of the recruiting period.
For the Sero-Surveillance Survey, the sample size for each key population was 250 per surveyed site. The total sample size planned for DFSW, PWID, MSM and transgenders was eight thousand participants.
2.1.2. Biological testing and quality assurance
Blood was collected by venipuncture from consenting key population participants. All surveyors were trained to collect and handle specimen accordingly to the national standard procedures. Laboratory technicians were also trained in performing correctly HIV and syphilis tests. All collected specimens were sent to the provincial laboratories designated by the Ministry of Health. HIV tests were performed using Focus (R1) and Oncoprobe (R2) HIV 1 & 2 Antibody Rapid Test reagents following the MOH national HIV testing algorithm for HIV surveillance. Syphilis test used Rapid SD (TPHA) and RPR Shield (RPR).
All laboratories had an internal and external quality assurance system in place to ensure
the validity of the test result.
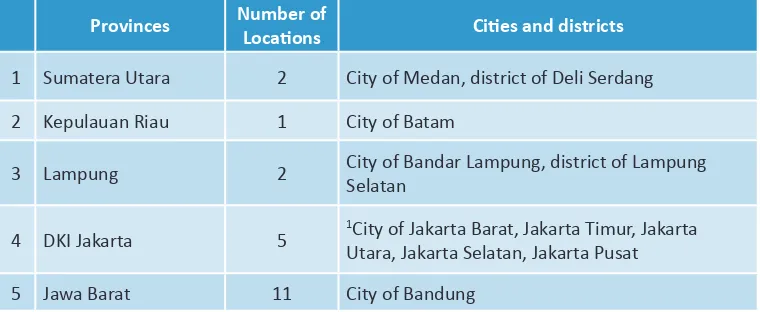
2.1.3. Locations
Both the 2013 Sero-surveillance Survey and Rapid Behavioral Survey (RBS) recruited
participants from the 22 cities/districts in 11 provinces listed below:
Table 1: List of provinces, districts/cities and the number of the participating sites
Provinces Number of
Locations Cities and districts
1 Sumatera Utara 2 City of Medan, district of Deli Serdang
2 Kepulauan Riau 1 City of Batam
3 Lampung 2 City of Bandar Lampung, district of Lampung Selatan
4 DKI Jakarta 5
1City of Jakarta Barat, Jakarta Timur, Jakarta
veillance And 2013 Rapid Behavioral Sur
vey
Provinces Number of Locations Cities and districts
6 Jawa Tengah 2 2,3City of Semarang, district of Batang
7 Jawa Timur 3 City of Surabaya,2,3 Malang, 2district of
Banyuwangi
8 Bali 1 2City of Denpasar
9 Nusa Tenggara Timur 1 City of Kupang
10 Maluku 1 City of Ambon
11 Papua 3 City of Jayapura, district of Jayapura, and
Jayawijaya.
2.2. Rapid Behavioral Survey
2.2.1. Sample size
The sample size for each risk sub population was determined accordingly to the WHO recommendation and the National Guideline of Second Generation HIV Surveillance of 2013. These recommend a selection of 30 clusters of seven respondents in each location. To account for data quality and none response, the sample size was fixed at 240 respondents per each risk group in each selected location (city or district). This is generally sufficient enough to be fairly a uniform distribution of the key population of interest as per WHO recommendation. The total sample size key population and location is provided below (Table 2).
2.2.2. Tools
A structured questionnaire was used to collect behavioral data on injecting and sexual behaviors between MSM and DFSW. Surveyors were trained to conduct interview and record participants ‘responses in the questionnaire. PWID were not included in the
2013 Rapid Behavioral Survey.
2.3. Implementation
Technical Report: 2013 Sero-Sentinel Sur
veillance And 2013 Rapid Behavioral Sur
vey
17
2.4. Analysis
Univariate analysis was conducted at location level only for both biological and behavioral data to determine prevalence of HIV and syphilis among different key populations and the frequency of risk behaviors among DFSW, PWID, and MSM. A chi square test was used to compare observed data in 2013 Sero-Surveillance Survey to the 2011 Integrated Biological and Behavioral Survey results. This test was also used to determine the trends within same locations having data for 2007-2013.
These analyses concerned only DFSW, PWID, MSM, and transgenders.
Limitations
The behavioral data and the biological data from the 2013 Sero-Surveillance Survey could not be linked at individual level due to some technical reasons, making any association between HIV and syphilis prevalence and risk behaviors difficult. Only indirect inference can be made from the data in this report.
Comparison of data of HIV and syphilis prevalence at location level should be interpreted with caution as the disaggregation at that level yielded small numbers.
Limitations inherent to sampling methods are not excluded from this study. The multi-stage sampling method used for transgenders and direct female sex workers may not reflect the diversity of the community from where the sample came. It may provide less information per observation than a simple random sampling (SRS) of the same size (redundant information: similar information from the others in the cluster) and the standard errors of the estimates may be high, compared to other sampling designs with same sample size.
veillance And 2013 Rapid Behavioral Sur
vey
Chapter III:
Results
3.1. Results of the 2013 HIV Sero-Surveillance Survey
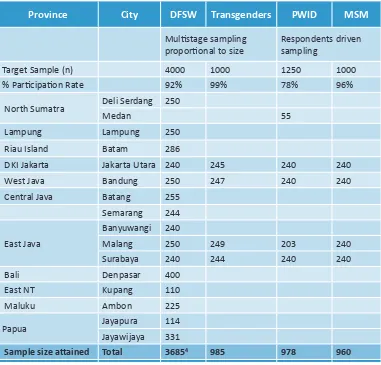
3.1.1. Participation rateTable 2: Planned Sample Size and Sampling Method by Target Population and Location
Province City DFSW Transgenders PWID MSM
Multistage sampling proportional to size
Respondents driven
sampling
Target Sample (n) 4000 1000 1250 1000
% Participation Rate 92% 99% 78% 96%
North Sumatra Deli Serdang 250
Medan 55
Lampung Lampung 250
Riau Island Batam 286
DKI Jakarta Jakarta Utara 240 245 240 240
West Java Bandung 250 247 240 240
Central Java Batang 255
Semarang 244
East Java
Banyuwangi 240
Malang 250 249 203 240
Surabaya 240 244 240 240
Bali Denpasar 400
East NT Kupang 110
Maluku Ambon 225
Papua Jayapura 114
Jayawijaya 331
Technical Report: 2013 Sero-Sentinel Sur
veillance And 2013 Rapid Behavioral Sur
vey
19 HIV Prevalence Syphilis Prevalence
Target
Group N HIV +(n) % HIV (95% CI) N
Syphilis
Positive (n) %Syphilis (95% CI) PWID 978 435 44.5 (41.4-47.6) 978 16 1.6 (0.8-2.4) MSM 960 166 17.3 (14.9-19.7) 960 122 12.7 (10.6-14.8)
Transgender 980 186 19 (16.5-21.5) 980 159 16.2 (13.9-18.5) Direct FSW 3685 367 10 (9-11) 3575 202 5.7 (4.9-6.5)
Total 6603 1154 17.5 (16.6-18.4) 6493 499 7.7 (7-8.3)
3.1.2. Characteristics of the Population Groups
A total of 6603 participants were recruited for the 2013 SSS. Of those, 3685 were DFSW, 985 were transgenders, 978 were PWID, and 985 were MSM.
In the 2013 SSS, direct female sex workers represented 55.8%of participants, PWID and transgenders represented each 14.8%, and MSM represented 14.5% of participants. The distribution of all key populations by location was as followed: 14% were from Malang, 15% from Surabaya, 15% from Jakarta and 15% from Bandung. All the other locations had less than 7% of the participants.
3.1.3. HIV prevalence
3.1.3.1. HIV prevalence among different key population
Table 3: Prevalence of HIV and Syphilis per Target Group of Key Affected Populations in the Sero-Surveillance Survey 2013
From the key populations surveyed in the 2013 Sero-Surveillance Survey, HIV prevalence was highest among the PWIDs with 44.5%. They were followed by transgenders with 19%, MSM with 17.3% and DFSW with 10% (Table 3).
3.1.3.2. HIV prevalence among PWID
veillance And 2013 Rapid Behavioral Sur
vey
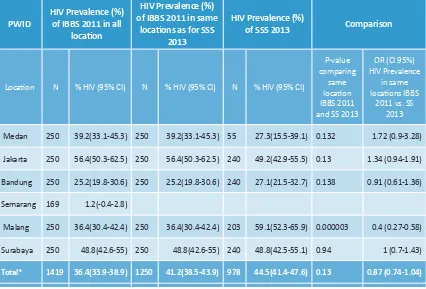
Table 4: HIV Prevalence among PWID per Location in IBBS 2011 and Sero-Surveillance Survey 2013
3.1.3.3. HIV Prevalence among MSM
The Sero-Surveillance Survey results showed, in table 5, that HIV prevalence among MSM was highest in Surabaya with 22.1% followed by Bandung (21.3%), Jakarta (19.6%) and lastly by Malang (6.3%).
PWID
locations as for SSS
2013
Medan 250 39.2(33.1-45.3) 250 39.2(33.1-45.3) 55 27.3(15.5-39.1) 0.132 1.72 (0.9-3.28)
Jakarta 250 56.4(50.3-62.5) 250 56.4(50.3-62.5) 240 49.2(42.9-55.5) 0.13 1.34 (0.94-1.91)
Bandung 250 25.2(19.8-30.6) 250 25.2(19.8-30.6) 240 27.1(21.5-32.7) 0.138 0.91 (0.61-1.36)
Semarang 169 1.2(-0.4-2.8)
Malang 250 36.4(30.4-42.4) 250 36.4(30.4-42.4) 203 59.1(52.3-65.9) 0.000003 0.4 (0.27-0.58)
Surabaya 250 48.8(42.6-55) 250 48.8(42.6-55) 240 48.8(42.5-55.1) 0.94 1 (0.7-1.43)
Total* 1419 36.4(33.9-38.9) 1250 41.2(38.5-43.9) 978 44.5(41.4-47.6) 0.13 0.87 (0.74-1.04)
PWID
locations as for SSS
2013
Medan 250 39.2(33.1-45.3) 250 39.2(33.1-45.3) 55 27.3(15.5-39.1) 0.132 1.72 (0.9-3.28)
Jakarta 250 56.4(50.3-62.5) 250 56.4(50.3-62.5) 240 49.2(42.9-55.5) 0.13 1.34 (0.94-1.91)
Bandung 250 25.2(19.8-30.6) 250 25.2(19.8-30.6) 240 27.1(21.5-32.7) 0.138 0.91 (0.61-1.36)
Semarang 169 1.2(-0.4-2.8)
Malang 250 36.4(30.4-42.4) 250 36.4(30.4-42.4) 203 59.1(52.3-65.9) 0.000003 0.4 (0.27-0.58)
Surabaya 250 48.8(42.6-55) 250 48.8(42.6-55) 240 48.8(42.5-55.1) 0.94 1 (0.7-1.43)
Technical Report: 2013 Sero-Sentinel Sur
veillance And 2013 Rapid Behavioral Sur
vey
21
Table 5: HIV Prevalence among the MSM per Location in IBBS 2011 and in Sero-Surveillance Survey (SS) 2013
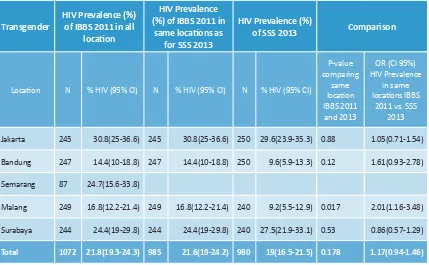
3.1.3.4. HIV prevalence among transgenders
Jakarta had the highest HIV prevalence among Transgenders with 29.6% followed by Surabaya with 27.5%, Bandung and Malang with 9.6% and 9.2% respectively (Table 6).
MSM
HIV Prevalence (%) of IBBS 2011 in all
location
HIV Prevalence (%) of IBBS 2011 in
same locations as
for SSS 2013
HIV Prevalence (%)
of SSS 2013 Comparison
Location N % HIV (95% CI) N % HIV (95% CI) N
P-value comparing
same location IBBS 2011
and 2013
OR (CI 95%) HIV Prevalence
in same locations IBBS
2011 vs. SSS 2013
Jakarta 250 17.2 (12.5-21.9) 250 17.2 (12.5-21.9) 240 19.6 (14.6-24.6) 0.57 0.85 (0.54-1.35)
Bandung 250 10.4 (6.6-14.2) 250 10.4 (6.6-14.2) 240 21.3 (16.1-26.5) 0.001 0.43 (0.26-0.72)
Semarang 249 0 (0-0)
Malang 247 2.5 (0.6-4.4) 247 2.5 (0.6-4.4) 240 6.3 (3.2-9.4) 0.64 0.37 (0.14-0.98)
Surabaya 248 9.6 (5.9-13.3) 248 9.6 (5.9-13.3) 240 22.1 (16.9-27.3) 0.00028 0.38 (0.22-0.06)
veillance And 2013 Rapid Behavioral Sur
vey
Transgender
HIV Prevalence (%) of IBBS 2011 in all
location
HIV Prevalence (%) of IBBS 2011 in
same locations as
for SSS 2013
HIV Prevalence (%)
of SSS 2013 Comparison
Location N % HIV (95% CI) N % HIV (95% CI) N % HIV (95% CI)
P-value comparing
same location IBBS 2011
and 2013
OR (CI 95%) HIV Prevalence
in same locations IBBS
2011 vs. SSS 2013
Jakarta 245 30.8(25-36.6) 245 30.8(25-36.6) 250 29.6(23.9-35.3) 0.88 1.05(0.71-1.54)
Bandung 247 14.4(10-18.8) 247 14.4(10-18.8) 250 9.6(5.9-13.3) 0.12 1.61(0.93-2.78)
Semarang 87 24.7(15.6-33.8)
Malang 249 16.8(12.2-21.4) 249 16.8(12.2-21.4) 240 9.2(5.5-12.9) 0.017 2.01(1.16-3.48)
Surabaya 244 24.4(19-29.8) 244 24.4(19-29.8) 240 27.5(21.9-33.1) 0.53 0.86(0.57-1.29)
Total 1072 21.8(19.3-24.3) 985 21.6(19-24.2) 980 19(16.5-21.5) 0.178 1.17(0.94-1.46)
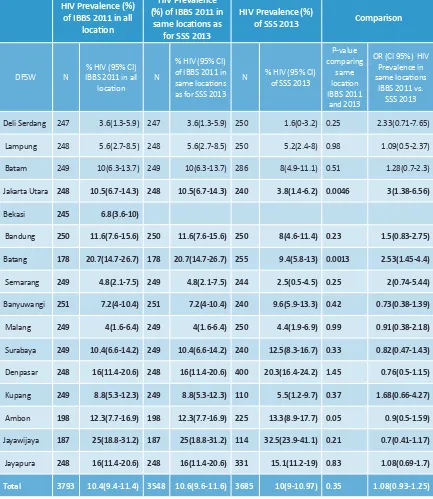
3.1.3.5. HIV prevalence among DFSW
From the 2013 HIV and Syphilis Sero-Surveillance Survey, HIV prevalence among direct female sex workers spanned between 32.5%, the highest prevalence found in Jayawijaya, and 1.6%, the lowest found in Deli Serdang. Denpasar had 20.3% HIV prevalence. Jayapura, Ambon, and Surabaya were the other three districts with an HIV prevalence above 10% among DFSW (Table 7).
Technical Report: 2013 Sero-Sentinel Sur
veillance And 2013 Rapid Behavioral Sur
vey
of SSS 2013 Comparison
DFSW N IBBS 2011 in all % HIV (95% CI)
Deli Serdang 247 3.6(1.3-5.9) 247 3.6(1.3-5.9) 250 1.6(0-3.2) 0.25 2.33(0.71-7.65)
Lampung 248 5.6(2.7-8.5) 248 5.6(2.7-8.5) 250 5.2(2.4-8) 0.98 1.09(0.5-2.37)
Batam 249 10(6.3-13.7) 249 10(6.3-13.7) 286 8(4.9-11.1) 0.51 1.28(0.7-2.3)
Jakarta Utara 248 10.5(6.7-14.3) 248 10.5(6.7-14.3) 240 3.8(1.4-6.2) 0.0046 3(1.38-6.56)
Bekasi 245 6.8(3.6-10)
Bandung 250 11.6(7.6-15.6) 250 11.6(7.6-15.6) 250 8(4.6-11.4) 0.23 1.5(0.83-2.75)
Batang 178 20.7(14.7-26.7) 178 20.7(14.7-26.7) 255 9.4(5.8-13) 0.0013 2.53(1.45-4.4)
Semarang 249 4.8(2.1-7.5) 249 4.8(2.1-7.5) 244 2.5(0.5-4.5) 0.25 2(0.74-5.44)
Banyuwangi 251 7.2(4-10.4) 251 7.2(4-10.4) 240 9.6(5.9-13.3) 0.42 0.73(0.38-1.39)
Malang 249 4(1.6-6.4) 249 4(1.6-6.4) 250 4.4(1.9-6.9) 0.99 0.91(0.38-2.18)
Surabaya 249 10.4(6.6-14.2) 249 10.4(6.6-14.2) 240 12.5(8.3-16.7) 0.33 0.82(0.47-1.43)
Denpasar 248 16(11.4-20.6) 248 16(11.4-20.6) 400 20.3(16.4-24.2) 1.45 0.76(0.5-1.15)
Kupang 249 8.8(5.3-12.3) 249 8.8(5.3-12.3) 110 5.5(1.2-9.7) 0.37 1.68(0.66-4.27)
Ambon 198 12.3(7.7-16.9) 198 12.3(7.7-16.9) 225 13.3(8.9-17.7) 0.05 0.9(0.5-1.59)
Jayawijaya 187 25(18.8-31.2) 187 25(18.8-31.2) 114 32.5(23.9-41.1) 0.21 0.7(0.41-1.17)
Jayapura 248 16(11.4-20.6) 248 16(11.4-20.6) 331 15.1(11.2-19) 0.83 1.08(0.69-1.7)
Total 3793 10.4(9.4-11.4) 3548 10.6(9.6-11.6) 3685 10(9-10.97) 0.35 1.08(0.93-1.25)
veillance And 2013 Rapid Behavioral Sur
vey
3.1.4. Prevalence of syphilis
3.1.4.1. Syphilis prevalence among different key population
The 2013 HIV and Syphilis Sero-Surveillance Survey showed that the overall syphilis
prevalence was 6.6 % among all the participants. The syphilis prevalence was highest among transgenders (16.2%), followed by MSM (12.7%) and direct female sex workers (5.5%) (Table3).
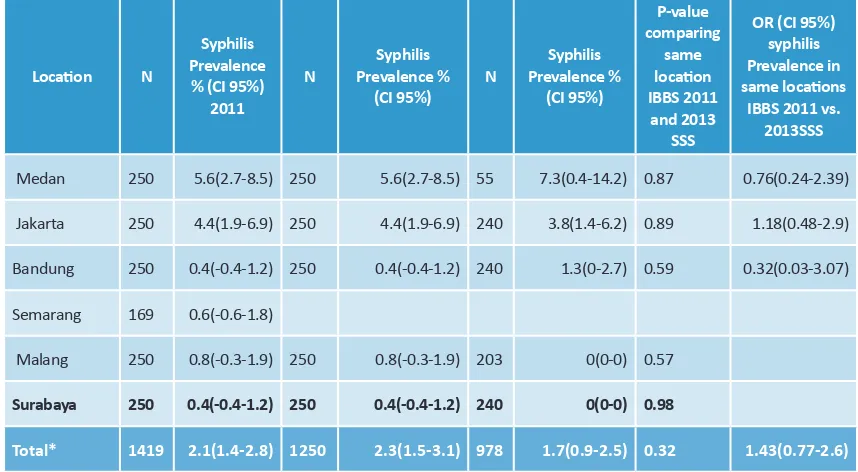
3.1.4.2. Prevalence of Syphilis among PWID
Among PWID, the highest syphilis prevalence was recorded in Medan at 7.3%, followed by Jakarta with a rate of 3.8% and Bandung with 1.3%. Malang and Surabaya did not register any case of syphilis in the survey (Table 8).
Table 8: Prevalence of Syphilis among PWID per Location in IBBS 2011 and Sero-Surveillance Survey 2013
3.1.4.3. Prevalence of syphilis among MSM
Syphilis prevalence was highest among MSM in Bandung at 15.4% followed by Surabaya
Location N
Medan 250 5.6(2.7-8.5) 250 5.6(2.7-8.5) 55 7.3(0.4-14.2) 0.87 0.76(0.24-2.39)
Jakarta 250 4.4(1.9-6.9) 250 4.4(1.9-6.9) 240 3.8(1.4-6.2) 0.89 1.18(0.48-2.9)
Bandung 250 0.4(-0.4-1.2) 250 0.4(-0.4-1.2) 240 1.3(0-2.7) 0.59 0.32(0.03-3.07)
Semarang 169 0.6(-0.6-1.8)
Malang 250 0.8(-0.3-1.9) 250 0.8(-0.3-1.9) 203 0(0-0) 0.57
Surabaya 250 0.4(-0.4-1.2) 250 0.4(-0.4-1.2) 240 0(0-0) 0.98
Technical Report: 2013 Sero-Sentinel Sur
veillance And 2013 Rapid Behavioral Sur
vey
25
Table 9: Prevalence of Syphilis among the MSM per Location in IBBS 2011 and in Sero-Surveillance Survey (SS) 2013
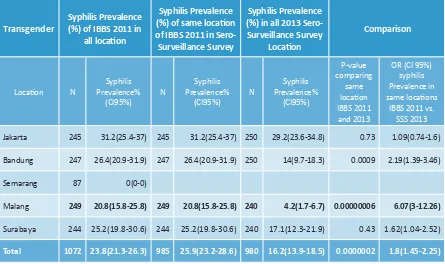
3.1.4.4. Prevalence of syphilis among transgenders
Among transgenders, Jakarta had the highest syphilis prevalence with 29.2%, followed by Surabaya with 17.1%, Bandung with 14% and Malang was last with 4,2% (Table 10 ).
MSM
Jakarta 250 16.8(12.2-21.4) 250 16.8(12.2-21.4) 240 14.2(9.8-18.6) 0.5 1.22(0.75-2)
Bandung 250 11.2(7.3-15.1) 250 11.2(7.3-15.1) 240 15.4(10.8-20) 0.21 0.69(0.41-1.17)
Malang 247 3.4(1.1-5.7) 247 3.4(1.1-5.7) 240 6.7(3.5-9.9) 0.12 0.47(0.2-1.12)
Surabaya 248 9.6(5.9-13.3) 248 9.6(5.9-13.3) 240 14.6(10.1-19.1) 0.13 0.63(0.336-1.09)
veillance And 2013 Rapid Behavioral Sur
of IBBS 2011 in Sero-Surveillance Survey
Location N Prevalence% Syphilis (CI95%) N
Jakarta 245 31.2(25.4-37) 245 31.2(25.4-37) 250 29.2(23.6-34.8) 0.73 1.09(0.74-1.6)
Bandung 247 26.4(20.9-31.9) 247 26.4(20.9-31.9) 250 14(9.7-18.3) 0.0009 2.19(1.39-3.46)
Semarang 87 0(0-0)
Malang 249 20.8(15.8-25.8) 249 20.8(15.8-25.8) 240 4.2(1.7-6.7) 0.00000006 6.07(3-12.26)
Surabaya 244 25.2(19.8-30.6) 244 25.2(19.8-30.6) 240 17.1(12.3-21.9) 0.43 1.62(1.04-2.52)
Total 1072 23.8(21.3-26.3) 985 25.9(23.2-28.6) 980 16.2(13.9-18.5) 0.0000002 1.8(1.45-2.25)
Table 10: Prevalence of Syphilis among the Transgenders by Location in IBBS 2011 and in Sero-Surveillance Survey (SS) 2013
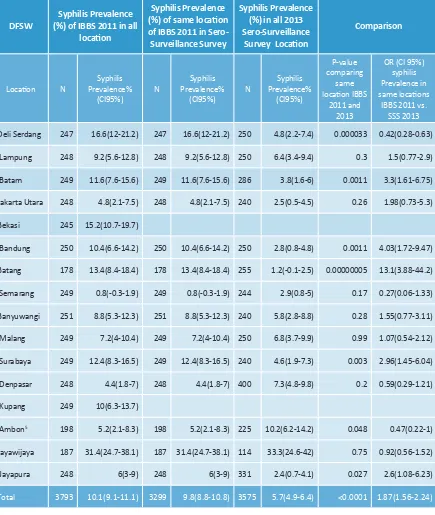
3.1.4.5. Prevalence of syphilis among DFSW
Technical Report: 2013 Sero-Sentinel Sur
veillance And 2013 Rapid Behavioral Sur
vey
of IBBS 2011 in Sero-Surveillance Survey
Location N Prevalence% Syphilis
(CI95%) N
Deli Serdang 247 16.6(12-21.2) 247 16.6(12-21.2) 250 4.8(2.2-7.4) 0.000033 0.42(0.28-0.63)
Lampung 248 9.2(5.6-12.8) 248 9.2(5.6-12.8) 250 6.4(3.4-9.4) 0.3 1.5(0.77-2.9)
Batam 249 11.6(7.6-15.6) 249 11.6(7.6-15.6) 286 3.8(1.6-6) 0.0011 3.3(1.61-6.75)
Jakarta Utara 248 4.8(2.1-7.5) 248 4.8(2.1-7.5) 240 2.5(0.5-4.5) 0.26 1.98(0.73-5.3)
Bekasi 245 15.2(10.7-19.7)
Bandung 250 10.4(6.6-14.2) 250 10.4(6.6-14.2) 250 2.8(0.8-4.8) 0.0011 4.03(1.72-9.47)
Batang 178 13.4(8.4-18.4) 178 13.4(8.4-18.4) 255 1.2(-0.1-2.5) 0.00000005 13.1(3.88-44.2)
Semarang 249 0.8(-0.3-1.9) 249 0.8(-0.3-1.9) 244 2.9(0.8-5) 0.17 0.27(0.06-1.33)
Banyuwangi 251 8.8(5.3-12.3) 251 8.8(5.3-12.3) 240 5.8(2.8-8.8) 0.28 1.55(0.77-3.11)
Malang 249 7.2(4-10.4) 249 7.2(4-10.4) 250 6.8(3.7-9.9) 0.99 1.07(0.54-2.12)
Surabaya 249 12.4(8.3-16.5) 249 12.4(8.3-16.5) 240 4.6(1.9-7.3) 0.003 2.96(1.45-6.04)
Denpasar 248 4.4(1.8-7) 248 4.4(1.8-7) 400 7.3(4.8-9.8) 0.2 0.59(0.29-1.21)
Kupang 249 10(6.3-13.7)
Ambon5 198 5.2(2.1-8.3) 198 5.2(2.1-8.3) 225 10.2(6.2-14.2) 0.048 0.47(0.22-1)
Jayawijaya 187 31.4(24.7-38.1) 187 31.4(24.7-38.1) 114 33.3(24.6-42) 0.75 0.92(0.56-1.52)
Jayapura 248 6(3-9) 248 6(3-9) 331 2.4(0.7-4.1) 0.027 2.6(1.08-6.23)
Total 3793 10.1(9.1-11.1) 3299 9.8(8.8-10.8) 3575 5.7(4.9-6.4) <0.0001 1.87(1.56-2.24)
Table 11: Prevalence of Syphilis among the DFSW by Location in IBBS 2011 and in Sero-Surveillance Survey (SS) 2013
veillance And 2013 Rapid Behavioral Sur
vey
3.1.5. Comparison between HIV and syphilis prevalence between 2011 Integrated
Biological and Behavioral Survey and 2013 Sero-Surveillance Survey
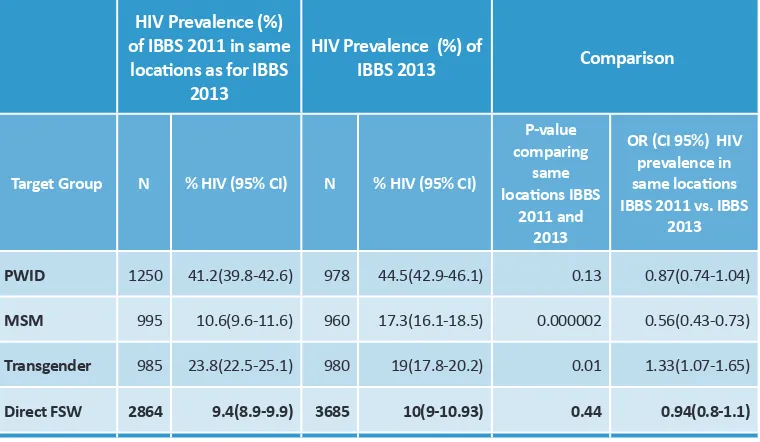
When compared to the 2011 IBBS, and including only the districts which participated in the 2011 integrated biological and behavioral survey, HIV prevalence among the MSM increased significantly from 10.6% to 17.3% [p< 0.000002, OR=0.56 (0.43-0.73)]. On the other hand there was a significant decrease in HIV prevalence among transgenders from 23.8% to 19% [p=0.01, OR=1.33 (1.07-1.65). The prevalence of HIV among PWID and among DFSW remained stable (the change was not statistically significant at 95% of confidence interval) between the two surveys (Table 12).
Table 12: Comparing HIV prevalence among key population in the same locations for IBBS 2011 and Sero-Surveillance Survey 2013
HIV Prevalence (%) of IBBS 2011 in same
locations as for IBBS
2013
PWID 1250 41.2(39.8-42.6) 978 44.5(42.9-46.1) 0.13 0.87(0.74-1.04)
MSM 995 10.6(9.6-11.6) 960 17.3(16.1-18.5) 0.000002 0.56(0.43-0.73)
Transgender 985 23.8(22.5-25.1) 980 19(17.8-20.2) 0.01 1.33(1.07-1.65)
Direct FSW 2864 9.4(8.9-9.9) 3685 10(9-10.93) 0.44 0.94(0.8-1.1)
Technical Report: 2013 Sero-Sentinel Sur
veillance And 2013 Rapid Behavioral Sur
vey
29
Table 13: Prevalence of Syphilis among PWID by Location, 2011-2013
Except for Malang where HIV prevalence increased significantly from 36.4% to 59.1% [p<0.001, OR=0.4 (0.2 7-0.58)]; HIV prevalence among PWID remained stable between the 2011 Integrated Biological and Behavioral Survey and the 2013 HIVSero-Surveillance Survey (Table 4). Syphilis prevalence remained stable among PWID across all locations (Table 8) HIV prevalence among MSM increased in Bandung and in Surabaya from 10.4% to 21.3% [p=0.001, OR=0.43(0.26-0.72)] and from 10% to 17.3% [p<0.001, OR=0.53(0.4-0.69)]. There was no significant change of the syphilis prevalence among MSM across different locations between the two surveys (Tables 5-9).
HIV prevalence among transgenders remained stable across all the locations (p>0.05) except in Malang where a significant decline was observed from 16.8% to 9.2% [p=0.017, OR=2.01(1.16-3.48)] (Table 6). Among the same key population, the prevalence of syphilis declined significantly in Bandung from 26.4% to 14% [p<0.001, OR=2.19(1.39-3.46)] and in Malang from 20.8% to 4.2% [p<0.001, OR=6.07(3-12.26)] (Table 10).
HIV prevalence among DFSW significantly decreased in Jakarta and in Bandung from 10.5% to 3.8% [p=0.0046, OR=3(1.38-6.56)] and from 20.7% to 9.4% [p=0.0013, OR=2.53(1.45-4.4) respectively. The other districts had their rate unchanged (Table 7).
The overall syphilis prevalence among DFSW declined from 9.8% from the 2011 Integrated Biological and Behavioral Survey to 5.7% in the 2013 Sero-Surveillance Survey (Table 7). Syphilis prevalence among DFSW significantly declined in five of the 15 locations surveyed
in the 2013 Sero-Surveillance Survey compared to the 2011 IBBS6. It decreased from 16.6%
to 4.8% [p<0.05, OR 0.42(0.28-0.63)] in Deli Serdang. It also decreased from 11.6% to 3.3% [p=0.001, OR=3.3(1.5-6.75)] in Batam, from 10.4% to 2.8% [p<0.001, OR=4.03(1.7-9.72)] in Bandung; from 12.4% to 4.6% [p=0.003, OR=2.96(1.45-6.04)] in Surabaya and from 13.4% to 1.2% [p<0.0001, OR=13.1(3.88-44.2)] in Batang (Table 11).
Target Group N
PWID 1419 2.1(1.4-2.8) 1250 2.3(1.5-3.1) 978 1.6(0.8-2.4) 0.32 1.42(77-2.64)
MSM 1244 9.3(7.7-10.9) 995 10.3(8.4-12.2) 960
12.7(10.6-14.8) 0.12 0.79(0.6-1.05)
Transgender 1072 25.3(22.7-27.9) 985 27.5(24.7-30.3) 980
16.2(13.9-18.5) < 0.000001 1.96(1.57-2.44)
Direct FSW 3793 10.2(9.2-11.2) 2864 8.8(7.8-9.8) 3575 5.7(4.9-6.4) < 0.000001 1.82(1.48-2.24)
veillance And 2013 Rapid Behavioral Sur
vey
3.1.6. Trends analysis of HIV and syphilis prevalence among key populations between
2007 and 2013
3.1.6.1. Trends of HIV prevalence among Key Populations, 2007-2013
The trends analysis showed that there has been a statistically significant decline of HIV prevalence of about 15% among PWIDs in the locations surveyed from 52.3% to 44.5% between 2007 and 2013. [p=0.00036, OR=0.729]. On the other hand, HIV prevalence increased steadily between 2007 and 2013 from 5% to 17.3%. This represented an increase of more than 200% from 2007.
Figure 1: Trends of HIV Prevalence among Key Populations, 2007-2013
0% 10% 20% 30% 40% 50% 60%
PWID MSM Transgender Direct FSW
Trends of HIV Prevalence Among Key Populations, 2007-2013
2007 IBBS 2011 IBBS 2013 SS
Technical Report: 2013 Sero-Sentinel Sur
veillance And 2013 Rapid Behavioral Sur
vey
31 3.1.6.2. Trends of HIV Prevalence among Key Populations by Location, 2007-2013
Between 2007 and 2013, syphilis prevalence increased significantly among MSM from 1% to 12.7% [p=00001, OR=0.599]. However, the prevalence of syphilis declined among transgenders from 24.4% to 16.2% [p=0.00001, OR=0.599] and among DSFW from 6.2% to 5% [p=0.0317, OR=0.796].
Figure 2: Trends of HIV Prevalence among Key Population by Location, 2007-2013
3.1.6.3. Trends of HIV Prevalence among PWIDs by Locations, 2007-2013
The trends data analysis showed that there has been a significant HIV prevalence decline among PWIDs in Medan from 2007 to 2015 as witnessed by the two surveys conducted in those years. Syphilis prevalence has dropped to half its original level in 2007.
Bandung has also noted a significant decline of HIV prevalence among PWIDs between 2007 and 2013. HIV prevalence reduced by 37% from its original level of 42.8% to reach 27.1% in 2013 [p=0.00014, OR=0.496].
Figure 3: Trends of HIV Prevalence among PWIDs by Locations, 2007-2013 3.1.6.3. Trends of HIV Prevalence among PWIDs by Locations, 2007-2013
0.0%
PWID MSM Transgender Direct FSW
Trends of Syphilis Prevalence Among Key Populations, 2007-2013
2007 IBBS 2011 IBBS 2013 SS
0.0%
Medan Jakarta Bandung Malang* Surabaya Trends of HIV Prevalence Among PWIDs by Locations, 2007-2013
veillance And 2013 Rapid Behavioral Sur
vey
3.1.6.4. Trends of Syphilis Prevalence among PWIDs by Locations, 2007-2013
The trends analysis revealed that the prevalence of syphilis increases significantly among PWIDs in Jakarta and Bandung from 0.1% to 3.8% [p=0.03, OR=9.86] and from 0% to 1.3% [p=0.033, OR=9.818].In Surabaya, syphilis prevalence remained stable among PWIDs between 2007 and 2013 [p=0.0457].
Figure 4: Trends of Syphilis Prevalence among PWIDs by Locations, 2007-2013
3.1.6.5. Trends of HIV Prevalence among MSM by Locations, 2007-2013
Data showed that HIV prevalence increased among MSM in Jakarta, Bandung and Surabaya from 8.1% to 19.6% [p=0.00031, OR=2.837], from 2% to 21.3% [p<0.00001, OR=13.22] and from 5.6% to 22.1% [p<0.00001, OR=4.778] respectively.
Figure 5: Trends of HIV Prevalence among MSM by Locations, 2007-2013
0% 2% 4% 6% 8% 10% 12% 14% 16%
Medan Jakarta Bandung Malang Surabaya
Series1 Series2 Series3
5% 10% 15% 20% 25% 30%
IV Prev
al
el
n
ce
%
Technical Report: 2013 Sero-Sentinel Sur
veillance And 2013 Rapid Behavioral Sur
vey
33 3.1.6.6. Trends of Syphilis Prevalence among MSM by Locations, 2007-2013
The analysis showed that syphilis increased among MSM in Jakarta from 3.2% to 14.2% [p=0.00013, OR=5.055]; in Bandung from 5.6% to 15.4% [p=0.034, OR=2.129] and in Surabaya it increased from 4% to 14.6% [p=0.00008, OR=4.098]. Jakarta has the biggest increase of all the cities.
Figure 6: Trends of Syphilis Prevalence among MSM by Locations, 2007-2013
3.1.6.7. Trends of HIV Prevalence among Transgenders by Locations, 2007-2013
Figure 7: Trends of HIV Prevalence among Transgenders by Locations, 2007-2013
Compared to the starting prevalence level of 2007, Jakarta syphilis increased more than five folds. It was followed by Surabaya with four folds Bandung with two folds. There was no statistically significant change between the prevalence of syphilis among MSM in Malang between 2011 and 2013.
0%
2007 IBBS 2011 IBBS 2013 SS
0%
Trends of HIV Prevalvence among Transgenders by Location, 2007-2013
veillance And 2013 Rapid Behavioral Sur
vey
The trends analysis revealed that HIV prevalence declined significantly among DFSW in the following locations between 2007 and 2013: Deli Serdang; from 6.1% to 1.6% [p=0.00662, OR 0.254], Jakarta, from 10.2% to 3.8% [p=0.00654, OR=0.337] and in Semarang, from 6.6% to 2.5% [p=0.0229, OR=0.36. Between the same period, HIV prevalence increased in Surabaya from 6.5% to 12.5% [p=0.02754, OR=2.089] and in Denpasar from 14.1% to 20.3% [p=0.04, OR=1.56]. HIV prevalence remained stable in the remaining locations between 2007 and 2013 (Figure 9).
3.1.6.8. Trends of Syphilis Prevalence among Transgenders by Locations, 2007-2013
In figure 8, trends analysis of syphilis among transgenders showed that apart from Jakarta, Bandung, Malang, and Surabaya have noted significant declined of syphilis prevalence. The latter declined, between 2007 and 2013, from 25.2% to 14% in Bandung [p=0.00204, OR=.0483] and from 28.8% to 17.1% in Surabaya [p=0.00198, OR=.509]. In Malang, between 2007 and 2013, syphilis prevalence decreased from 20.8% to 4.2% [p<0.00001, OR=0.165].
Figure 8: Trends of Syphilis Prevalence among Transgenders by Locations, 2007-2013
0%
2007 IBBS 2011 IBBS 2013 SS
3.1.6.9. Trends of HIV Prevalence among DFSW by Locations, 2007-2013
Technical Report: 2013 Sero-Sentinel Sur
veillance And 2013 Rapid Behavioral Sur
vey
35 3.1.6.10. Trends of Syphilis Prevalence among DFSW by Locations, 2007-2013
The trends analysis of the syphilis prevalence revealed a decline among DFSW between 2007 and 2013 in Deli Serdang from 12.9% to 4.8% [p=0.0037, OR=0.342], in Batam from 16.8% to 3.8% [p<0.00001, OR=0.198] and in Jakarta from 9.2% to 2.5% [p=0.00084, OR=0.253]. The prevalence of syphilis also declined on Jayapura from 6% to 2.4% [p=0.027, OR=2.6(1.08-6.23)]. On the opposite, between the same period, the prevalence of syphilis increased in Batang from 0.9% to 1.2% [p=0.00713, OR=1.488] and in Ambon from 5.2% to 10.2% [p=0.048, OR=0.47(0.22-1)]. The other locations saw their syphilis remaining stable between the study’s periods (Figure 10).
Figure 10: Trends of Syphilis Prevalence among DFSW by Locations, 2007-2013 0%
2007 IBBS 2011 IBBS 2013 SS
-10%
2007 IBBS 2011 IBBS 2013 SS
veillance And 2013 Rapid Behavioral Sur
vey
3.1.6.11. Relationship between HIV Prevalence and Syphilis prevalence among Different Key Populations, Sero-Surveillance Survey 2013
The data showed a strong relation between HIV and syphilisprevalence among all the key populations (R-Squared=0.9656). The prevalence of HIV and syphilis were not correlated among PWID as their main mode of transmission of HIV is unsafe drug injections and not sexual intercourse.
Figure 11: Correlation between HIV and Syphilis Prevalence among DFSW, MSM, and Transgenders, SSS 2013
17.3%, 12.7% 19.0%, 16.2%
10.0%, 5.7%
2.1%, 1.1%
y = 0.8698x - 0.0159 R² = 0.9659
0% 2% 4% 6% 8% 10% 12% 14% 16% 18%
0% 2% 4% 6% 8% 10% 12% 14% 16% 18% 20%
Sy
p
h
il
is
P
re
v
al
ence
Technical Report: 2013 Sero-Sentinel Sur
veillance And 2013 Rapid Behavioral Sur
vey
37
3.2. Results of the 2013 HIV Rapid Behavioral survey
3.2.1. Participation rate
Table 14: Sample sizes by locations for the Rapid Behavioral Survey, 2013 Sero-Surveillance Survey
Data for the rapid behavioral survey from integrated location were collected from the cities and locations as follow:
PWID: Medan City, DKI Jakarta, Bandung City, Semarang City, Surabaya City
DFSW: Semarang City, Denpasar City, Malang City, Banyuwangi district
MSM: DKI Jakarta, Bandung City, Surabaya City.
The planned sample size for each key population was 240 per selected site except from DFSW in Denpasar were the planned sample was elevated to 400 because of its size of DFSW. The participation rate was maximal for in all the cities and location except from Semarang where the sample size for PWID was reached at 18% and in Medan where PWID were reached at 94%.
3.2.2. Risk behaviors among key population 3.2.2.1. Direct female sex workers
From the 2013 Rapid Behavioral Survey, the weekly median number of clients per DFSW in Semarang was four clients. The highest number of clients per DFSW per week was noted in Denpasar (14 clients) followed by Malang (eight clients) and Banyuwangi
(seven clients).
The proportion of DFSW who used condom during their last commercial sexual intercourse was 76.5% in Denpasar, 71.3% in Malang and Banyuwangi and 68.8% in Semarang. Consistent condom use during the last week preceding the survey was reported at 65.5% in Denpasar, 38.3% in Semarang, 35.1% in Banyuwangi and 24.2% in Malang.
Jakarta Bandung Semarang Malang Surabaya Banyuwangi Denpasar Medan Total
MSM 240 240 240 720
DFSW 240 240 240 400 1120
PWID 240 240 447 240 225 989
Total 480 480 284 240 480 240 400 225 2829
veillance And 2013 Rapid Behavioral Sur
vey
Table 15: Prevalence of Risk Behaviors among DFSW in Semarang and Banyuwangi, 2011-2013
Semarang Banyuwangi
per week (Median) 6(4.5-7.5) 4(2.8-5.2) P=0.47, OR=1.47(0.65-3.35) 4 (1.6-6.4) 7 (3.8-10.2) P=0.19, OR=0.54(0.2-1.2)
Proportion of DFSW who used condom
during the last commercial sex
75.2(72.5-77.9) 68.8(65.9-71.7) P=0.14, OR=1.37(0.9-2) 71.1 (65.5-76.7) 71.3 (65.6-77) P=0.99, OR=0.98(0.7-1.5)
Proportion of DSFW who used condoms
in commercial sex
the last week
52(48.9-55.1) 38.3(35.2-41.4) P=0.0037, OR=1.73(1.2-2.5) 35.1(29.2-41) 12.5 (10.4-14.6) P=0.0000, OR=3.78(2.4-6)
Table 16: Prevalence of Risk Behaviors among DFSW in Malang and Denpasar, 2011-2013
Malang Denpasar
DFSW IBBS 2011 (n=249) RBS 2013 (n=240) P, OR (CI 95%) IBBS 2011 (n=248) RBS 2013 (n=400) P, OR (CI 95%) Number of Clients
per week (Median) 5(2.3-7.7) 8(6.3-9.7) P=0.22, OR=0.59(0.3-1.2) 14(9.7-18.3) 14(10.6-17.4) P=0.94, OR=1(0.6-1.6)
Proportion of DFSW who used condom
during the last commercial sex
83.2(78.6-87.8) 71.3(68.4-74.2) P=0.0025, OR=1.99(1.3-3.1) 90(86.3-93.7) 76.5(72.3-80.7) P=0.00003,
OR=2.74(1.71-4.4)
Proportion of DSFW who used condoms
in commercial sex
the last week
44.9(38.7-51.1) 24.2(21.5-26.9) P=0.000002, OR=2.57(1.74-3.78) 49.6(43.4-55.8) 65.5(63.2-67.8) P=0.00009, OR=0.52(0.38-0.72)
3.2.2.2. Men who have sex with men
Technical Report: 2013 Sero-Sentinel Sur
veillance And 2013 Rapid Behavioral Sur
vey
39
Table 17: Prevalence of Risk Behaviors among MSM inJakarta, Bandung and Surabaya, 2011-2013
Table 18: Prevalence of risk Behavior among PWID in Medan, 2010-2013
Jakarta Bandung Surabaya
Ever Injected 5.2(3.8-6.6) 0(0-0) 0.00097
0.8(0.2-1.4) 0(0-0) 0.46 1.2(0.5-1.9) 0(0-0) 1.25
Using a
(0.9-1.8) 75.9(73.2-78.6) 53(49.8-56.2) P=0,
Never Tested for HIV 63.6(57.5-69.7) 66.2(60.2-72.2) [P=0.62, OR=0.89(0.61-1.3)]
Proportion of IDUs sharing needle during injection last
month
4.8(2.1-7.5) 3.1(0.9-5.3) [P=0.48, OR=1.57(0.61-4.1)]
Proportion of IDUs not sharing
needle during the last injection 60(56.7-63.3) 97.8(95.9-99.6) P<0.00001, OR=0.034(0.014-0.086) 3.2.2.3. People who inject drugs
The study results indicated that the proportion of PWID who have tested for HIV was highest in Medan (66.2%); followed by Jakarta (64%), Surabaya (47.5%), Bandung (41%), and Semarang (25%).
veillance And 2013 Rapid Behavioral Sur
vey
Table 19: Prevalence of Risk Behavior among PWID in Jakarta, 2010-2013
Table 20: Prevalence of risk Behavior among PWID in Bandung, 2010-2013
Table 21: Prevalence of risk Behavior among PWID in Semarang, 2010-2013
IDUs (%) Jakarta
RBS
2010(n=210) IBBS 2011 (n=250) RSC 2013 (n=240) P, OR (CI 95%)
Never Tested for HIV 71.6(65.9-77.3) 64.2(58.1-70.2)
Proportion of IDUs sharing needle during injection last
month
20.1(15-25.2) 17.1(12.3-21.8) [P=0.095, OR=1.41(0.96-2.06)]
Proportion of IDUs not sharing
needle during the last injection 93.8(90.7-96.8) [P=0.48, OR=1.2(0.77-1.92)]
IDUs (%) Bandung
RBS
2010(n=210) IBBS 2011 (n=250) RSC 2013 (n=240) P, OR (CI 95%)
Never Tested for HIV 59.6(53.4-65.8) 41.3(35-47.5) [P=0.00007, OR=2.1(1.47-3.01)]
Proportion of IDUs
sharing needle during
injection last month 18(13.1-22.9) 10.8(6.9-14.8) [P=0.033, OR=1.81(1.07-3.04)]
Proportion of IDUs not
sharing needle during
the last injection 84.8(82.3-87.2) 98.8(97.3-100.2) P<0.00001, OR=0.07(0.02-0.23)
IDUs (%) Semarang
RSC
2010(n=210) IBBS 2011 (n=169) RSC 2013 (n=44) P, OR (CI 95%)
Never Tested for HIV 27.1(21.5-32.7) 25(19.5-30.5) [P=0.9, OR=1.12(0.52-2.4)]
Proportion of IDUs sharing
Technical Report: 2013 Sero-Sentinel Sur
veillance And 2013 Rapid Behavioral Sur
vey
41
Table 22: Prevalence of risk Behavior among PWID in Surabaya, 2010-2013
IDUs (%) Surabaya
RBS
2010(n=210)
IBBS 2011
(n=250) RSC 2013 (n=240) P, OR (CI 95%)
Never Tested for HIV 77.6(72.3-82.9) 47.5(44.3-50.7) [P=0.0000, OR=3.83(2.59-5.66)]
Proportion of IDUs sharing needle during injection
last month
8.4(4.9-11.9) 0.8(-0.3-2) [P=0.0002, OR=10.9(2.5-47.07)]
Proportion of IDUs not
sharing needle during the
last injection 56.2(52.8-59.5) 99.2(98-100) P<0.0001, OR=0.01(0.003-0.045)
3.2.3. Comparison between risk behaviors between the 2011 Integrated Biological
and Behavioral Survey and 2013 Rapid Behavioral Survey
There has not been a significant declined of the median number of DFSWs' sexual clients per week in the four cities surveyed. However, the results showed a significant declined of the proportion of DFSW who used condom during their last sexual encounter in Malang and in Denpasar. This rate dropped from 83.2% to 71.3% [P=0.0025, OR= 1.99 (1.29-3.07)] in Malang. In addition, in Denpasar, that drop was from 90% to 76.5% [P=0.00003, OR=2.74(1.71-4.4). It is also worth noting that the proportion of DFSW who reported consistent condom use during the last week prior to the survey declined significantly from 35.1% to 12.5% [P<0.001, OR=3.78(2.38-5.99)] in Bandung and from 44.9% to 24.2% [P<0.001, OR=2.57 (1.74-3.780] in Malang. It was noted that the use condom in commercial sex among DFSW during the same period increased significantly from 49.6% to 65.5% in Denpasar [P<001, OR=0.52 (0.38-0.72)]. The percentage of MSM injecting drugs dropped from 5% to 0% in Jakarta between 2011 and 2013 (p<001) but remained stable in the other cities. The proportion of MSM who used condom during their last sexual encounter dropped significantly in Surabaya from 75.9% to 53% [P=00001, OR=2.79(1.9-4.1)].