“ The best, most complete technical book I have
read in years”
—
J
ACK
C
ROOK
, Incident Handler
“ The authoritative guide to memory forensics”
—
B
RUCE
D
ANG
,
Microsoft
“ An in-depth guide to memory forensics from
the pioneers of the field”
—B
RIAN
C
ARRIER
, B
ASIS
T
ECHNOLOGY
Praise for
The
A R T
of
The Art of
Memory
Forensics
Detecting Malware and
Threats in Windows, Linux,
and Mac Memory
Michael Hale Ligh
Andrew Case
Jamie Levy
10475 Crosspoint Boulevard Indianapolis, IN 46256
www.wiley.com
Copyright © 2014 by John Wiley & Sons, Inc., Indianapolis, Indiana Published simultaneously in Canada
ISBN: 978-1-118-82509-9 ISBN: 978-1-118-82504-4 (ebk) ISBN: 978-1-118-82499-3 (ebk)
Manufactured in the United States of America 10 9 8 7 6 5 4 3 2 1
No part of this publication may be reproduced, stored in a retrieval system or transmitted in any form or by any means, electronic, mechanical, photocopying, recording, scanning or otherwise, except as permitted under Sections 107 or 108 of the 1976 United States Copyright Act, without either the prior writ-ten permission of the Publisher, or authorization through payment of the appropriate per-copy fee to the Copyright Clearance Center, 222 Rosewood Drive, Danvers, MA 01923, (978) 750-8400, fax (978) 646-8600. Requests to the Publisher for permission should be addressed to the Permissions Department, John Wiley & Sons, Inc., 111 River Street, Hoboken, NJ 07030, (201) 748-6011, fax (201) 748-6008, or online at http:// www.wiley.com/go/permissions.
Limit of Liability/Disclaimer of Warranty: The publisher and the author make no representations or war-ranties with respect to the accuracy or completeness of the contents of this work and specifically disclaim all warranties, including without limitation warranties of fitness for a particular purpose. No warranty may be created or extended by sales or promotional materials. The advice and strategies contained herein may not be suitable for every situation. This work is sold with the understanding that the publisher is not engaged in rendering legal, accounting, or other professional services. If professional assistance is required, the services of a competent professional person should be sought. Neither the publisher nor the author shall be liable for damages arising herefrom. The fact that an organization or Web site is referred to in this work as a citation and/or a potential source of further information does not mean that the author or the publisher endorses the information the organization or website may provide or recommendations it may make. Further, readers should be aware that Internet websites listed in this work may have changed or disappeared between when this work was written and when it is read.
For general information on our other products and services please contact our Customer Care Department within the United States at (877) 762-2974, outside the United States at (317) 572-3993 or fax (317) 572-4002. Wiley publishes in a variety of print and electronic formats and by print-on-demand. Some material included with standard print versions of this book may not be included in e-books or in print-on-demand. If this book refers to media such as a CD or DVD that is not included in the version you purchased, you may download this material at http://booksupport.wiley.com. For more information about Wiley prod-ucts, visit www.wiley.com.
Library of Congress Control Number: 2014935751
write this book, I’d spend every minute with you. Looking forward to our new house!
—Michael Hale Ligh
I would like to thank my wife, Jennifer, for her patience during my many sleepless nights and
long road trips. I would also like to thank my friends and family, both in the physical and digital
world, who have helped me get to where I am today.
—Andrew Case
To my family, who made me the person I am today, and especially to my husband, Tomer, the
love of my life, without whose support I wouldn’t be here.
—Jamie Levy
To my family for their unconditional support; to my wife, Robyn, for her love and
understanding; and to Addisyn and Declan for reminding me what is truly important and
creating the only memories that matter.
Executive Editor
Carol Long
Project Editor
T-Squared Document Services
Technical Editors
Golden G. Richard III Nick L. Petroni, Jr.
Production Editor
Christine Mugnolo
Copy Editor
Nancy Sixsmith
Manager of Content Development and Assembly
Mary Beth Wakefield
Director of Community Marketing
David Mayhew
Marketing Manager
Dave Allen
Business Manager
Amy Knies
Vice President and Executive Group Publisher
Richard Swadley
Associate Publisher
Jim Minatel
Project Coordinator, Cover
Patrick Redmond
Compositor
Maureen Forys, Happenstance Type-O-Rama
Proofreaders
Jennifer Bennett Josh Chase
Indexer
Johnna VanHoose Dinse
Cover Designer
© iStock.com/Raycat
Cover Image
About the Authors
Michael Hale Ligh (@iMHLv2) is author of Malware Analyst’s Cookbook and secretary-treasurer of the Volatility Foundation. As both a developer and reverse engineer, his focus is malware cryptography, memory forensics, and automated analysis. He has taught advanced malware and memory forensics courses to students around the world.
Andrew Case (@attrc) is digital forensics researcher for the Volatility Project responsible for projects related to memory, disk, and network forensics. He is the co-developer of Registry Decoder (a National Institute of Justice–funded forensics application) and was voted Digital Forensics Examiner of the Year in 2013. He has presented original memory forensics research at Black Hat, RSA, and many others.
Jamie Levy (@gleeda) is senior researcher and developer with the Volatility Project. Jamie has taught classes in computer forensics at Queens College and John Jay College. She is an avid contributor to the open-source computer forensics community, and has authored peer-reviewed conference publications and presented at numerous conferences on the topics of memory, network, and malware forensics analysis.
AAron Walters (@4tphi) is founder and lead developer of the Volatility Project, presi-dent of the Volatility Foundation, and chair of the Open Memory Forensics Workshop. AAron’s research led to groundbreaking developments that helped shape how digital investigators analyze RAM. He has published peer-reviewed papers in IEEE and Digital Investigation journals, and presented at Black Hat, DoD Cyber Crime Conference, and American Academy of Forensic Sciences.
About the Technical Editors
Golden G. Richard III (@nolaforensix) is currently Professor of Computer Science and Director of the Greater New Orleans Center for Information Assurance at the University of New Orleans. He also owns Arcane Alloy, LLC, a private digital forensics and computer security company.
Acknowledgments
W
e would like to thank the memory forensics community at large: those who spend their weekends, nights, and holidays conducting research and creating free, open-source code for practitioners. This includes developers and users, both past and present, that have contributed unique ideas, plugins, and bug fixes to the Volatility Framework. Specifically, for their help on this book, we want to recognize the following:•
Dr. Nick L. Petroni for his invaluable comments during the book review process and whose innovative research inspired the creation of Volatility.•
Dr. Golden G. Richard III for his expertise and commitment as technical editor.•
Mike Auty for his endless hours helping to maintain and shepherd the Volatilitysource code repository.
•
Bruce Dang and Brian Carrier for taking time out of their busy schedules to review our book.•
Brendan Dolan-Gavitt for his numerous contributions to Volatility and the memory forensics field that were highlighted in the book.•
George M. Garner, Jr. (GMG Systems, Inc.) for his insight and guidance in the memory acquisition realm.•
Matthieu Suiche (MoonSols) for reviewing the Windows Memory Toolkit section and for his advancements in Mac OS X and Windows Hibernation analysis.•
Matt Shannon (Agile Risk Management) for this review of the F-Response sectionof the book.
•
Jack Crook for reviewing our book and for providing realistic forensics challenges that involve memory samples and allowing people to use them to become better analysts.•
Wyatt Roersma for providing memory samples from a range of diverse systems and for helping us test and debug issues.•
Andreas Schuster for discussions and ideas that helped shape many of the memory forensics topics and techniques.•
Robert Ghilduta, Lodovico Marziale, Joe Sylve, and Cris Neckar for their review of the Linux chapters and research discussions of the Linux kernel.•
Cem Gurkok for his Volatility plugins and research into Mac OS X.•
Dionysus Blazakis, Andrew F. Hay, Alex Radocea, and Pedro Vilaça for their help with the Mac OS X chapters, including providing memory captures, malware sam-ples, research notes, and chapter reviews.Contents
Introduction . . . xvii
I
An Introduction to Memory Forensics . . . .1
1
Systems Overview . . . 3
Digital Environment...3
PC Architecture ...4
Operating Systems ...17
Process Management ...18
Memory Management ...20
File System ...24
I/O Subsystem ...25
Summary ...26
2
Data Structures . . . 27
Basic Data Types...27
Summary ...43
3
The Volatility Framework . . . 45
Why Volatility?...45
What Volatility Is Not ...46
Installation ...47
The Framework ...51
Using Volatility ...59
Summary ...67
4
Memory Acquisition . . . 69
Preserving the Digital Environment ...69
Software Tools...79
Memory Dump Formats...95
Converting Memory Dumps ...106
Volatile Memory on Disk ...107
II
Windows Memory Forensics . . . .115
5
Windows Objects and Pool Allocations . . . 117
Windows Executive Objects ... 117
Pool-Tag Scanning ...129
Limitations of Pool Scanning ...140
Big Page Pool ...142
Pool-Scanning Alternatives ...146
Summary ...148
6
Processes, Handles, and Tokens . . . 149
Processes ...149
Process Tokens ...164
Privileges ... 170
Process Handles ... 176
Enumerating Handles in Memory ...181
Summary ...187
7
Process Memory Internals . . . 189
What’s in Process Memory?...189
Enumerating Process Memory ...193
Summary ...217
8
Hunting Malware in Process Memory . . . 219
Process Environment Block ...219
PE Files in Memory ...238
Packing and Compression...245
Code Injection ...251
Summary ...263
9
Event Logs . . . .265
Event Logs in Memory ...265
Real Case Examples ...275
Summary ...279
10
Registry in Memory . . . .281
Windows Registry Analysis ...281
Volatility’s Registry API ...292
Detecting Malware with the Shimcache ...297
Reconstructing Activities with Shellbags...298
Dumping Password Hashes ...304
Obtaining LSA Secrets ...305
Summary ...307
11
Networking . . . .309
Network Artifacts ...309
Hidden Connections ...323
Raw Sockets and Sniffers ...325
Next Generation TCP/IP Stack ...327
Internet History ...333
DNS Cache Recovery ...339
Summary ...341
12
Windows Services . . . .343
Service Architecture ...343
Installing Services...345
Tricks and Stealth...346
Investigating Service Activity ...347
Summary ...366
13
Kernel Forensics and Rootkits . . . .367
Kernel Modules...367
Modules in Memory Dumps ...372
Threads in Kernel Mode ... 378
Driver Objects and IRPs ...381
Device Trees ...386
Auditing the SSDT ...390
Kernel Callbacks ...396
Kernel Timers ...399
Putting It All Together ...402
Summary ...406
14
Windows GUI Subsystem, Part I . . . .407
The GUI Landscape ...407
GUI Memory Forensics ...410
The Session Space ...410
Window Stations ...416
Atoms and Atom Tables ...429
Windows ...435
Summary ...452
15
Windows GUI Subsystem, Part II. . . .453
Window Message Hooks...453
User Handles ...459
Event Hooks ...466
Windows Clipboard ...468
Case Study: ACCDFISA Ransomware...472
Summary ...476
16
Disk Artifacts in Memory . . . .477
Master File Table...477
Extracting Files...493
Defeating TrueCrypt Disk Encryption ...503
Summary ...510
17
Event Reconstruction . . . 511
Strings ...511
Command History ...523
Summary ...536
18
Timelining . . . 537
Finding Time in Memory ...537
Generating Timelines ...539
Gh0st in the Enterprise ...543
Summary ...573
III
Linux Memory Forensics. . . 575
19
Linux Memory Acquisition . . . .577
Historical Methods of Acquisition ...577
Modern Acquisition ...579
Volatility Linux Profiles ...583
Summary ...589
20
Linux Operating System . . . 591
Linux Data Structures ...603
Linux Address Translation ...607
procfs and sysfs...609
Compressed Swap ... 610
Summary ... 610
21
Processes and Process Memory . . . 611
Processes in Memory ...611
Enumerating Processes...613
Process Address Space ... 616
Process Environment Variables ...625
Open File Handles ...626
Saved Context State ...630
Bash Memory Analysis...630
Summary ...635
22
Networking Artifacts . . . .637
Network Socket File Descriptors...637
Network Connections ...640
Queued Network Packets ...643
Network Interfaces ...646
The Route Cache ...650
ARP Cache ...652
Summary ...655
23
Kernel Memory Artifacts . . . .657
Physical Memory Maps ...657
Virtual Memory Maps ...661
Kernel Debug Buffer...663
Loaded Kernel Modules ...667
Summary ...673
24
File Systems in Memory . . . 675
Mounted File Systems...675
Listing Files and Directories...681
Extracting File Metadata ...684
Recovering File Contents ...691
25
Userland Rootkits . . . .697
Shellcode Injection ...698
Process Hollowing ...703
Shared Library Injection ...705
LD_PRELOAD Rootkits ...712
GOT/PLT Overwrites...716
Inline Hooking ...718
Summary ...719
26
Kernel Mode Rootkits. . . 721
Accessing Kernel Mode ...721
Hidden Kernel Modules ...722
Hidden Processes ...728
Elevating Privileges ...730
System Call Handler Hooks ...734
Keyboard Notifiers ...735
TTY Handlers...739
Network Protocol Structures ...742
Netfilter Hooks ...745
File Operations ...748
Inline Code Hooks...752
Summary ...754
27
Case Study: Phalanx2 . . . 755
Phalanx2 ...755
Phalanx2 Memory Analysis ...757
Reverse Engineering Phalanx2...763
Final Thoughts on Phalanx2...772
Summary ...772
IV
Mac Memory Forensics . . . 773
28
Mac Acquisition and Internals . . . .775
Mac Design...775
Memory Acquisition...780
Mac Volatility Profiles ...784
Mach-O Executable Format...787
29
Mac Memory Overview . . . .793
Mac versus Linux Analysis ...793
Process Analysis ...794
Address Space Mappings ...799
Networking Artifacts ...804
SLAB Allocator...808
Recovering File Systems from Memory ...811
Loaded Kernel Extensions ...815
Other Mac Plugins ...818
Mac Live Forensics ...819
Summary ...821
30
Malicious Code and Rootkits . . . .823
Userland Rootkit Analysis ...823
Kernel Rootkit Analysis ...828
Common Mac Malware in Memory...838
Summary ...844
31
Tracking User Activity . . . .845
Keychain Recovery ...845
Mac Application Analysis ...849
Summary ...858
Introduction
M
emory forensics is arguably the most fruitful, interesting, and provocative realm of digital forensics. Each function performed by an operating system or applica-tion results in specific modificaapplica-tions to the computer’s memory (RAM), which can often persist a long time after the action, essentially preserving them. Additionally, memory forensics provides unprecedented visibility into the runtime state of the system, such as which processes were running, open network connections, and recently executed com-mands. You can extract these artifacts in a manner that is completely independent of the system you are investigating, reducing the chance that malware or rootkits can interfere with your results. Critical data often exists exclusively in memory, such as disk encryp-tion keys, memory-resident injected code fragments, off-the-record chat messages, unen-crypted e-mail messages, and non-cacheable Internet history records.By learning how to capture computer memory and profile its contents, you’ll add an invaluable resource to your incident response, malware analysis, and digital forensics capabilities. Although inspection of hard disks and network packet captures can yield compelling evidence, it is often the contents of RAM that enables the full reconstruction of events and provides the necessary puzzle pieces for determining what happened before, during, and after an infection by malware or an intrusion by advanced threat actors. For example, clues you find in memory can help you correlate traditional forensic artifacts that may appear disparate, allowing you to make associations that would otherwise go unnoticed.
Overview of the Book and Technology
The world’s reliance on computing grows enormously every day. Companies protect themselves with digital defenses such as firewalls, encryption, and signature/heuristic scanning. Additionally, nations plan attacks by targeting power grids, infiltrating mili-tary data centers, and stealing trade secrets from both public and private organizations. It is no wonder that detecting, responding, and reporting on these types of intrusions, as well as other incidents involving computer systems, are critical for information security professionals.
As these attack surfaces expand and the sophistication of adversaries grows, defend-ers must adapt in order to survive. If evidence of compromise is never written to a hard drive, you cannot rely on disk forensics. Memory, on the other hand, has a high potential to contain malicious code from an infection, in whole or in part, even if it’s never writ-ten to disk—because it must be loaded in memory to execute. The RAM of a victimized system will also contain evidence that system resources were allocated by, and in support of, the malicious code.
Likewise, if the data exfiltrated from an organization is encrypted across the network, a packet capture is not likely to help you determine which sensitive files were stolen. However, memory forensics can often recover encryption keys and passwords, or even the plain-text contents of files before they were encrypted, giving you an accelerated way to draw conclusions and understand the scope of an attack.
The most compelling reason for writing this book is that the need for memory foren-sics in digital investigations greatly exceeds the amount of information available on the topic. Aside from journals, short academic papers, blog posts, and Wiki entries, the most thorough documentation on the subject of consists of a few chapters in Malware Analyst’s Cookbook (Wiley, 2010, Chapters 15 through 18). Nearing its fourth birthday, much of the Cookbook’s content is now outdated, and many new capabilities have been developed since then.
Who Should Read This Book
This book is written for practitioners of technical computing disciplines such as digital forensics, malicious code analysis, network security, threat intelligence gathering, and incident response. It is also geared toward law enforcement officers and government agents who pursue powerful new ways to investigate digital crime scenes. Furthermore, we know that many students of colleges and universities are interested in studying similar topics. If you have worked, or desire to work, in any of the aforementioned fields, this book will become a major point of reference for you.
The material we present is intended to appeal to a broad spectrum of readers inter-ested in solving modern digital crimes and fighting advanced malware using memory forensics. While not required, we assume that you have a basic familiarity with C and Python programming languages. In particular, this includes a basic understanding of data structures, functions, and control flow. This familiarity will allow you to realize the full benefit of the code exhibits, which are also presented with detailed explanations.
For those new to the field, we suggest carefully reading the introductory material in the first part, because it will provide the building blocks to help you through the rest of the book. For the experienced reader, you may want to use the first part as reference material and skip to the parts that interest you most. Regardless of the path you take, the book is intended for the digital investigator who constantly strives to build their skills and seeks new ideas for combating sophisticated and creative digital adversaries.
How This Book Is Organized
Conventions
There are a number of conventions used throughout the book, such as the following:
•
Hexadecimal addresses and names of files, API functions, variables, and other terms related to code are shown in monofont. For example: 0x31337, user.ds,PsCreateProcess, process_pid = 4
•
Typed commands are shown in monofont and bold. If the command is preceded by a $ sign, that means we were using a UNIX system (Linux or Mac OS X). Otherwise, you’ll see a Windows prompt. For example:$ echo "typing on UNIX" | grep typing
C:\Users\Mike\Desktop> echo "typing on windows" | findstr typing
•
If we truncated output for the sake of brevity, we inserted “snip” to indicate the placement of missing fields.•
Unless otherwise noted, the memory dump files used as evidence throughout the text are not publicly available. However, the evidence package on the website (see “What’s on the Website”) contains memory dumps you can explore.NOTE
Tips, hints, and references related to the current discussion look like this. For example, Francesco Picasso ported Benjamin Delpy’s Mimikatz (password recovery Windbg plugin) to Volatility. See https://github.com/gentilkiwi/mimikatz and https://code .google.com/p/hotoloti.
WARNING
Common mistakes, misconceptions, and potentially threatening anti-forensics techniques look like this. For example, Dementia (https://code.google.com/p/ dementia-forensics) by Luka Milkovic is an open source anti-forensics tool.
Analysis Objectives
Your objectives are these:
•
This is an objective•
This is an objective Data StructuresThis section shows data structures.
Key Points
The key points are as follows:
•
This is a key point•
This is a key pointTo facilitate understanding and help associate context with the artifacts, we show practical examples of using memory forensics to detect specific behaviors exhibited by high profile malware samples, rootkits, suspects, and threat groups.
What’s on the Website
On the book’s website (http://artofmemoryforensics.com) you will find the lab guide and exemplary evidence files. These hands-on exercises are designed to simulate practical investigations and to reinforce the concepts you learn in the text. You can also find any necessary errata (i.e., mistakes, bug fixes) on the website.
Tools You Will Need
To complete the hands-on exercises, you will need at a minimum:
•
Access to Volatility (http://volatilityfoundation.org), the open-source memory forensics framework version 2.4 or greater.•
A Windows, Linux, or Mac computer with Python (http://www.python.org) version 2.7 installed.The following tools are not required for memory forensics per se, but they’re mentioned throughout the book and can help complement your memory-related investigations.
•
IDA Pro and Hex-Rays (https://www.hex-rays.com) if you plan to disassemble or decompile code.•
Sysinternals Suite (http://technet.microsoft.com/en-us/sysinternals/bb842062 .aspx) to analyze artifacts on running Windows systems.•
Wireshark (http://www.wireshark.org) for capturing and analyzing network data.•
Microsoft WinDbg debugger (http://www.microsoft.com/whdc/devtools/debugging/default.mspx).
•
YARA (https://plusvic.github.io/yara), the “pattern matching swiss army knife for malware researchers.”•
Virtualization software such as VMware or VirtualBox, if you plan to execute malware in a controlled environment.Please note that some tools may require third-party libraries or dependencies.
Memory Forensics Training
The authors of this book, also the core developers of the Volatility Framework, teach an internationally acclaimed five-day training course: Windows Malware and Memory Forensics Training by The Volatility Project. Although books help us disseminate the information that we feel is critical to the future of digital forensics, they only provide one-way com-munication. If you prefer a classroom environment with the ability to ask questions and receive one-on-one tutorials, we invite you to bring your curiosity and enthusiasm to this weeklong journey to the center of memory forensics.
Keep an eye on our training website (http://www.memoryanalysis.net) for upcoming announcements regarding the following:
•
Public course offerings in North and South America, Europe, Australia, and other locations•
Online, self-paced training options covering Windows, Linux, and Mac OS X•
Availability for private training sessions provided on siteChapter 1:
Systems Overview
Chapter 2:
Data Structures
Chapter 3:
The Volatility Framework
Chapter 4:
Memory Acquisition
I
An Introduction
T
his chapter provides a general overview of the hardware components and operat-ing system structures that affect memory analysis. Although subsequent chapters discuss implementation details associated with particular operating systems, this chapter provides useful background information for those who are new to the field or might need a quick refresher. The chapter starts by highlighting important aspects of the hardware architecture and concludes by providing an overview of common operating system primi-tives. The concepts and terminology discussed in this chapter are referred to frequently throughout the remainder of the book.Digital Environment
This book focuses on investigating events that occur in a digital environment. Within the context of a digital environment, the underlying hardware ultimately dictates the constraints of what a particular system can do. In many ways, this is analogous to how the laws of physics constrain the physical environment. For example, physical crime scene investigators who understand the laws of physics concerning liquids can leverage bloodstains or splatter patterns to support or refute claims about a particular crime. By applying knowledge about the physical world, investigators gain insight into how or why a particular artifact is relevant to an investigation. Similarly, in the digital environment, the underlying hardware specifies the instructions that can be executed and the resources that can be accessed. Investigators who can identify the unique hardware components of a system and the impact those components can have on analysis are in the best position to conduct an effective investigation.
On most platforms, the hardware is accessed through a layer of software called an
operating system, which controls processing, manages resources, and facilitates commu-nication with external devices. Operating systems must deal with the low-level details of the particular processor, devices, and memory hardware installed in a given system.
Typically, operating systems also implement a set of high-level services and interfaces that define how the hardware can be accessed by the user’s programs.
During an investigation, you look for artifacts that suspected software or users might have introduced into the digital environment and try to determine how the digital envi-ronment changed in response to those artifacts. A digital investigator’s familiarity with a system’s hardware and operating system provide a valuable frame of reference during analysis and event reconstruction.
PC Architecture
This section provides a general overview of the hardware basics that digital investiga-tors who are interested in memory forensics should be familiar with. In particular, the discussion focuses on the general hardware architecture of a personal computer (PC). We primarily use the nomenclature associated with Intel-based systems. It is important to note that the terminology has changed over time, and implementation details are constantly evolving to improve cost and performance. Although the specific technologies might change, the primary functions these components perform remain the same.
NOTE
We generically refer to a PC as a computer with an Intel or compatible processor that can run Windows, Linux, or Mac OS X.
Physical Organization
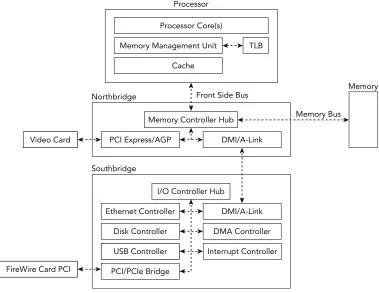
A PC is composed of printed circuit boards that interconnect various components and pro-vide connectors for peripheral devices. The main board within this type of system, the moth-erboard, provides the connections that enable the components of the system to communicate. These communication channels are typically referred to as computer busses. This section highlights the components and busses that an investigator should be familiar with. Figure 1-1 illustrates how the different components discussed in this section are typically organized.
CPU and MMU
Disk Controller
USB Controller
PCI/PCIe Bridge
Interrupt Controller Ethernet Controller
I/O Controller Hub Southbridge
Northbridge Front Side Bus
DMA Controller DMI/A-Link Video Card
FireWire Card PCI
PCI Express/AGP
Memory Controller Hub Memory Bus
Memory
DMI/A-Link Cache
Memory Management Unit Processor Core(s)
Processor
TLB
Figure 1-1: Physical organization of a modern system
Reading from main memory is often dramatically slower than reading from the CPU’s own memory. As a result, modern systems leverage multiple layers of fast memory, called
caches, to help offset this disparity. Each level of cache (L1, L2, and so on) is relatively slower and larger than its predecessor. In most systems, these caches are built into the processor and each of its cores. If data is not found within a given cache, the data must be fetched from the next level cache or main memory.
The CPU relies on its memory management unit (MMU) to help find where the data is stored. The MMU is the hardware unit that translates the address that the processor requests to its corresponding address in main memory. As we describe later in this chap-ter, the data structures for managing address translation are also stored in main memory. Because a given translation can require multiple memory read operations, the processor uses a special cache, known as the translation lookaside buffer (TLB), for the MMU transla-tion table. Prior to each memory access, the TLB is consulted before asking the MMU to perform a costly address translation operation.
North and Southbridge
The CPU relies on the memory controller to manage communication with main memory. The memory controller is responsible for mediating potentially concurrent requests for system memory from the processor(s) and devices. The memory controller can be imple-mented on a separate chip or integrated within the processor itself. On older PCs, the CPU connected to the northbridge (memory controller hub) using the front-side-bus and the northbridge connected to main memory via the memory bus. Devices (for example, network cards and disk controllers) were connected via another chip, called the southbridge
or input/output controller hub, which had a single shared connection to the northbridge for access to memory and the CPU.
To improve performance and reduce the costs of newer systems, most capabilities associated with the memory controller hub are now integrated into the processor. The remaining chipset functionality, previously implemented in the southbridge, are concen-trated on a chip known as the platform controller hub.
Direct Memory Access
To improve overall performance, most modern systems provide I/O devices the capability to directly transfer data stored in system memory without processor intervention. This capability is called direct memory access (DMA). Before DMA was introduced, the CPU would be fully consumed during I/O transfers and often acted as an intermediary. In modern architectures, the CPU can initiate a data transfer and allow a DMA controller to manage the data transfer, or an I/O device can initiate a transfer independent of the CPU. Besides its obvious impact on system performance, DMA also has important rami-fications for memory forensics. It provides a mechanism to directly access the contents of physical memory from a peripheral device without involving the untrusted software running on the machine. For example, the PCI bus supports devices that act as bus masters, which means they can request control of the bus to initiate transactions. As a result, a PCI device with bus master functionality and DMA support can access the system’s memory without involving the CPU.
Another example is the IEEE 1394 interface, commonly referred to as Firewire. The IEEE 1394 host controller chip provides a peer-to-peer serial expansion bus intended for connecting high-speed peripheral devices to a PC. Although the IEEE 1394 interface is typically natively found only on higher-end systems, you can add the interface to both desktops and laptops using expansion cards.
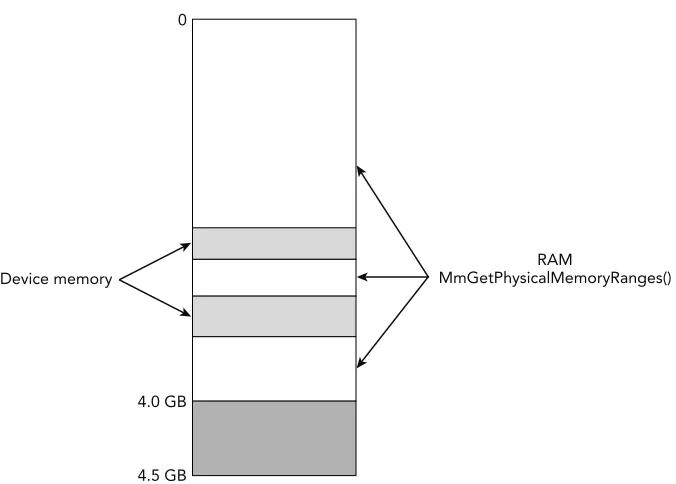
Volatile Memory (RAM)
sequential access storage typically associated with disks, random access refers to the char-acteristic of having a constant access time regardless of where the data is stored on the media. The main memory in most PCs is dynamic RAM (DRAM). It is dynamic because it leverages the difference between a charged and discharged state of a capacitor to store a bit of data. For the capacitor to maintain this state, it must be periodically refreshed—a task that the memory controller typically performs.
RAM is considered volatile memory because it requires power for the data to remain accessible. Thus, except in the case of cold boot attacks (https://citp.princeton.edu/ research/memory), after a PC is powered down, the volatile memory is lost. This is the main reason why the “pull the plug” incident response tactic is not recommended if you plan to preserve evidence regarding the system’s current state.
CPU Architectures
As previously mentioned, the CPU is one of the most important components of a computer system. To effectively extract structure from physical memory and understand how mali-cious code can compromise system security, you should have a firm understanding of the programming model that the CPU provides for accessing memory. Although the previous section focused on the physical organization of the hardware, this section focuses on the logical organization exposed to the operating system. This section begins by discussing some general topics that pertain to CPU architectures and then highlights the features relevant to memory analysis. In particular, this section focuses on the 32-bit (IA-32) and 64-bit (Intel 64) organization, as specified in the Intel 64 and IA-32 Architecture Software Developer’s Manual (http://www.intel.com/content/dam/www/public/us/en/documents/ manuals/64-ia-32-architectures-software-developer-manual-325462.pdf).
Address Spaces
For the CPU to execute instructions and access data stored in main memory, it must specify a unique address for that data. The processors discussed in this book leverage byte addressing, and memory is accessed as a sequence of bytes. The address space refers to a range of valid addresses used to identify the data stored within a finite allocation of memory. In particular, this book focuses on systems that define a byte as an 8-bit quantity. This addressing scheme generally starts with byte 0 and ends at the offset of the final byte of memory in the allocation. The single continuous address space that is exposed to a running program is referred to as a linear address space. Based on the memory models discussed in the book and their use of paging, we use the terms linear addresses
page tables (discussed in more detail soon). The following sections discuss how memory address spaces are implemented in different processor architectures.
NOTE
When dealing with raw, padded memory dumps (see Chapter 4), a physical address is essentially an offset into the memory dump file.
Intel IA-32 Architecture
The IA-32 architecture commonly refers to the family of x86 architectures that support 32-bit computation. In particular, it specifies the instruction set and programming envi-ronment for Intel’s 32-bit processors. The IA-32 is a little endian machine that uses byte addressing. Software running on an IA-32 processor can have a linear address space and a physical address space up to 4GB. As you will see later, you can expand the size of physical memory to 64GB using the IA-32 Physical Address Extension (PAE) feature. This section and the remainder of the book focuses on protected-mode operation of the IA-32 architecture, which is the operational mode that provides support for features such as virtual memory, paging, privilege levels, and segmentation. This is the primary state of the processor and also the mode in which most modern operating systems execute.
Registers
The IA-32 architecture defines a small amount of extremely fast memory, called registers, which the CPU uses for temporary storage during processing. Each processor core con-tains eight 32-bit general-purpose registers for performing logical and arithmetic opera-tions, as well as several other registers that control the processor’s behavior. This section highlights a few of the control registers relevant for memory analysis.
The EIP register, also referred to as the program counter, contains the linear address of the next instruction that executes. The IA-32 architecture also has five control registers that specify configuration of the processor and the characteristics of the executing task. CR0 contains flags that control the operating mode of the processor, including a flag that enables paging. CR1 is reserved and should not be accessed. CR2 contains the linear address that caused a page fault. CR3 contains the physical address of the initial structure used for address translation. It is updated during context switches when a new task is scheduled. CR4 is used to enable architectural extensions, including PAE.
Segmentation
IA-32 processors implement two memory management mechanisms: segmentation and
segments. All IA-32 memory references are addressed using a 16-bit segment selector, which identifies a particular segment descriptor, and a 32-bit offset into the specified segment. A segment descriptor is a memory-resident data structure that defines the loca-tion, size, type, and permissions for a given segment. Each processor core contains two special registers, GDTR and LDTR, which point to tables of segment descriptors, called the Global Descriptor Table (GDT) and the Local Descriptor Table, respectively. The segmen-tation registers CS (for code), SS (for stack), and DS, ES, FS, and GS (each for data) should always contain valid segment selectors.
While segmentation is mandatory, the operating systems discussed in this book hide segmented addressing by defining a set of overlapping segments with base address zero, thereby creating the appearance of a single continuous “flat” linear address space. However, segmentation protections are still enforced for each segment, and separate segment descriptors must be used for code and data references.
NOTE
Because most operating systems do not take advantage of more sophisticated IA-32 segmentation models, segmented addressing is disabled in 64-bit mode. In particular, segment base addresses are implicitly zero. Note that segmentation protections are still enforced in 64-bit mode.
Paging
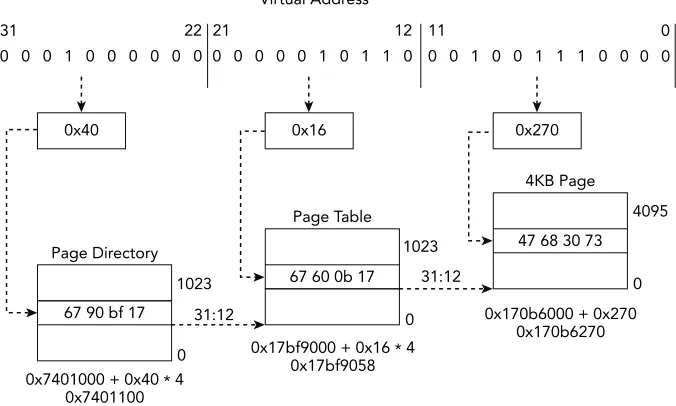
Paging provides the ability to virtualize the linear address space. It creates an execution environment in which a large linear address space is simulated with a modest amount of physical memory and disk storage. Each 32-bit linear address space is broken up into fixed-length sections, called pages, which can be mapped into physical memory in an arbitrary order. When a program attempts to access a linear address, this mapping uses memory-resident page directories and page tables to translate the linear address into a physi-cal address. In the typiphysi-cal scenario of a 4KB page, as shown in Figure 1-2, the 32-bit virtual address is broken into three sections, each of which is used as an index in the paging structure hierarchy or the associated physical page.
Virtual Address
Figure 1-2: Address translation to a 4KB page using 32-bit paging
PDE
Figure 1-3: Formats for paging structure addresses used in 32-bit paging
To compute the page directory entry (PDE) address, you combine bits 31:12 from the CR3 register with bits 31:22 from the virtual address. You then locate the page table entry (PTE) by combining bits 31:12 from the PDE with bits 21:12 of the virtual address. Finally, you can obtain the physical address (PA) by combining bits 31:12 of the PTE with bits 11:0 of the virtual address. You’ll see these calculations applied in the next section as you walk through translating an address manually.
Address Translation
NOTE
The Python classes in Volatility that handle address translation expose a method called
vtop (virtual to physical). Callers pass the function a virtual address and it returns the physical offset, which it computes using the steps described in this section. Similarly, if you’re working with Microsoft’s debugger (WinDbg), you can use the !vtop command.
For the sake of this exercise, we assume you are analyzing one of the memory samples, ENG-USTXHOU-148, included in Jack Crook’s November 2012 forensics challenge (see
http://blog.handlerdiaries.com/?p=14). During your analysis, you found a reference to a virtual address, 0x10016270, within the virtual address space of the svchost.exe
process with PID 1024. The page directory base (CR3) for PID 1024 is 0x7401000. You want to find the corresponding physical address to see what other data might be in close spatial proximity.
Your first step is to convert the virtual address, 0x10016270, from hexadecimal to binary format because you will be working with ranges of address bits:
0001 0000 0000 0001 0110 0010 0111 0000
Next, you decompose the address into the relevant offsets that are used during the translation process. This data is shown in Table 1-1.
Table 1-1: A Breakdown of the Bits for Virtual Address Translation
Paging Structure VA Bits Binary Hex
Page directory index Bits 31:22 0001000000 0x40 Page table index Bits 21:12 0000010110 0x16 Address offset Bits 11:0 001001110000 0x270
As seen in Figure 1-2 and Figure 1-3, you can calculate the physical address of the PDE by multiplying the page directory index by the size of the entry (4 bytes) and then adding the page directory base, 0x7401000. The 10 bits from the virtual address can index 1024 (210) entries in the page directory.
PDE address = 0x40 * 4 + 0x7401000 = 0x7401100
the virtual address provide the page table index because the page table is composed of 1024 (210) entries. You can calculate the physical address of the PTE by multiplying the
size of the entry (4 bytes) by the page table index and then adding that value to the page table base.
PTE address = 0x16 * 4 + 0x17bf9000 = 0x17bf9058
The value of the PTE stored at that address is 0x170b6067. Based on Figure 1-3, you know that bits 31:12 of the physical address are from the PTE and bits 11:0 are from the virtual address. Thus, the final converted physical address is this:
Physical address = 0x170b6000 + 0x270 = 0x170b6270
After completing the translation, you found that the virtual address 0x10016270 trans-lates to the physical address 0x170b6270. Figure 1-4 provides a graphical illustration of the steps that were involved. You can find that byte offset in the memory sample and look for any related artifacts that might be in close proximity. This is the same process that the Volatility IA32PagedMemory address space performs every time a virtual address is accessed. In the following text, you see how this process can be extended to support larger virtual address spaces.
NOTE
It is also important to highlight a couple of the bit flags stored in paging structure entries that directly affect translation for all three paging modes discussed in the book. The address translation process will terminate if a paging structure entry has bit 0 (the present flag) set to 0, which signifies “not present.” Thus, it generates a page fault exception. If you are processing an intermediary paging structure, meaning more than 12 bits remain in the linear address, bit 7 of the current paging structure entry is used as the page size (PS) flag. When the bit is set, it designates that the remaining bits map to a page of memory as opposed to another paging structure.
Physical Address Extension
The IA-32 architecture’s paging mechanism also supports PAE. This extension allows the processor to support physical address spaces greater than 4GB. Although programs still possess linear address spaces of up to 4GB, the memory management unit maps those addresses into the expanded 64GB physical address space. On systems with PAE enabled, the linear address is divided into four indexes:
•
Page directory pointer table (PDPT)•
Page directory (PD)•
Page table (PT)•
Page offsetFigure 1-5 shows an example of address translation to a 4KB page using 32-bit PAE paging. The main differences are the introduction of another level in the paging structure hierarchy called the page directory pointer table and the fact that the paging structure entries are now 64 bits. Given these changes, the CR3 register now holds the physical address of the page directory pointer table.
Figure 1-6 shows the formats for the paging structure addresses that are used in 32-bit PAE paging. When PAE is enabled, the first paging table has only 4 (22) entries. The bits
31:30 from the virtual address select the page directory pointer table entry (PDPTE). The bits 29:21 are an index to select from the 512 (29) PDEs. If the PS flag is set, the PDE
maps a 2MB page. Otherwise, the 9 bits extracted from bits 20:12 are selected from the 512 (29) PTEs. Assuming that all entries are valid, and the address is mapping a 4KB
Directory Pointer
Figure 1-5: Address translation to a 4KB page using 32-bit PAE paging
5 5 4 4 4 4 4 4 4 4 4 4 3 3 3 3 3 3 3 3 3 3 2 2 2 2 2 2 2 2 2 2 1 1 1 1 1 1 1 1 1 1
PDE PDPTE[51:12] VA[29:21] 00 0
VA[11:0]
Figure 1-6: Formats for paging structure addresses used in 32-bit PAE paging
Intel 64 Architecture
The execution environment for the Intel 64 architecture is similar to IA-32, but there are a few differences. The registers highlighted in the IA-32 architecture still exist within Intel 64, but have been expanded to hold 64 bits. The most significant change is that Intel 64 can now support 64-bit linear addresses. As a result, the Intel 64 architecture supports a linear address space up to 264 bytes. Note that the most current implementations of the
47. For example, the address 0xfffffa800ccc0b30 has bits 63:48 set because bit 47 is set (this is also known as sign-extension).
It is also important for you to focus on the changes to memory management because they have a direct impact on memory forensics. The most important difference is that the Intel 64 architecture now supports an additional level of paging structures called page map level 4 (PML4). All entries in the hierarchy of paging structures are 64 bits, and they can map virtual addresses to pages of size 4KB, 2MB, or 1GB. Figure 1-7 shows an example of address translation to a 4KB page using 64-bit/IA-32e paging.
Virtual Address
Figure 1-7: Address translation to a 4KB page using 64-bit/IA-32e paging
Figure 1-8 shows the formats for the paging structure addresses used in 64-bit/IA-32e paging. Each of the paging structures is composed of 512 entries (29) and is indexed by
the values extracted from the following ranges taken from the 48-bit virtual address:
•
Bits 47:39 (PML4E offset)•
Bits 38-30 (PDPTE offset)•
Bits 29:21 (PDE offset)•
Bits 20:12 (PTE offset)If you are interested in the details of how the different paging structure entry flags affect memory forensics, you are encouraged to check out the Intel Manual and Volatility’s
AMD64PagedMemory address space.
5 5 4 4 4 4 4 4 4 4 4 4 3 3 3 3 3 3 3 3 3 3 2 2 2 2 2 2 2 2 2 2 1 1 1 1 1 1 1 1 1 1
1 0 9 8 7 6 5 4 3 2 1 0 9 8 7 6 5 4 3 2 1 0 9 8 7 6 5 4 3 2 1 0 9 8 7 6 5 4 3 2 1 0 9 8 7 6 5 4 3 2 1 0
1GB Page
2MB Page
PTE
PA
VA[20:0] PDPTE[51:30]
PTE[51:21]
PDE[51:12]
PTE[51:12]
VA[20:0]
VA[20:12] 00 0
PDPTE PML4E[51:12] VA[38:30] 00 0
PML4E CR3[51:12] VA[47:39] 00 0
PDE PDPTE[51:12] VA[29:21] 00 0
VA[11:0]
Figure 1-8: Formats for paging structure addresses used in 64-bit/IA-32e paging
Interrupt Descriptor Table
PC architectures often provide a mechanism for interrupting process execution and pass-ing control to a privileged mode software routine. For the IA-32 and Intel 64 architectures, the routines are stored within the Interrupt Descriptor Table (IDT). Each processor has its own IDT composed of 256 8-byte or 16-byte entries, in which the first 32 entries are reserved for processor-defined exceptions and interrupts. Each entry contains the address of the interrupt service routine (ISR) that can handle the particular interrupt or exception. In the event of an interrupt or exception, the specified interrupt number serves as an index into the IDT (which indirectly references a segment in the GDT), and the CPU will call the respective handler.
WARNING
Given the critical role that the IDT performs for operating systems, it has been a fre-quent target of malicious software. Malicious software might try to redirect entries, modify handler code, add new entries, or even create entirely new interrupt tables. For example, Shadow Walker (https://www.blackhat.com/presentations/bh-jp-05/ bh-jp-05-sparks-butler.pdf) hooked the page fault handler by modifying the IDT and was able to return “fake” pages to the caller.
An interesting paper regarding the use of IDT for rootkit and anti-forensic pur-poses is Stealth Hooking: Another Way to Subvert the Windows Kernel (http://phrack.org/ issues/65/4.html). You can use the Volatility plugins idt (Windows) and linux_idt
(Linux) for auditing the IDT.
Operating Systems
This section provides a general overview of the aspects of modern operating systems that impact memory forensics. In particular, it focuses on important features common to the three operating systems discussed in this book: Microsoft Windows, Linux, and Mac OS X. Although the topics might be familiar, this section discusses them within the context of memory forensics. Investigators familiar with operating system internals might choose to skip most of the material in this section or use it as a reference for topics covered in later chapters.
Privilege Separation
To prevent potentially malfunctioning or malicious user applications from accessing or manipulating the critical components of the operating system, most modern operating systems implement some form of user and kernel mode privilege isolation. This isola-tion attempts to prevent applicaisola-tions from affecting the stability of the operating system or other processes. The code associated with user applications (untrusted) executes in user mode, and the code associated with the operating system (trusted) executes in kernel mode.
process memory regions (except on newer systems with SMEP, which prevents ring 0 execution of user pages). For a user application to access critical components of the operat-ing system, the application switches from user mode to kernel mode usoperat-ing a well-defined set of system calls. Understanding the level of access that malicious code has gained can help provide valuable insight into the type of modifications it can make to the system.
System Calls
Operating systems are designed to provide services to user applications. A user applica-tion requests a service from the operating system’s kernel using a system call. For example, when an application needs to interact with a file, communicate over the network, or spawn another process, system calls are required. As a result, system calls define the low-level API between user applications and the operating system kernel. Note that most appli-cations are not implemented directly in terms of system calls. Instead, most operating systems define a set of stable APIs that map to one or more system calls (for example, the APIs provided by ntdll.dll and kernel32.dll on Windows).
Before a user application makes a system call, it must configure the execution environ-ment to pass arguenviron-ments to the kernel through a predetermined convention (for example, on the stack or in specific registers). To invoke the system call, the application executes a software interrupt or architecture-specific instruction, which saves the user mode register context, changes the execution mode to kernel, initializes the kernel stack, and invokes the system call handler. After the request is serviced, execution is returned to user mode and the unprivileged register context is restored. Control then returns to the instruction following the system call.
Because it is such a critical bridge between user applications and the operating sys-tem, the code used to service system call interrupts is commonly intercepted by security products and targeted by malicious software. Later in the book, you will learn how to use memory forensics to detect modifications made to this critical interface on Windows, Linux, and Mac systems.
Process Management
thread of execution. A process provides the execution environment, resources, and con-text for threads to run. An important aspect of memory analysis involves enumerating the processes that were executing on a system and analyzing the data stored within their address spaces, including passwords, URLs, encryption keys, e-mail, and chat logs.
Threads
A thread is the basic unit of CPU utilization and execution. A thread is often character-ized by a thread ID, CPU register set, and execution stack(s), which help define a thread’s execution context. Despite their unique execution contexts, a process’s threads share the same code, data, address space, and operating system resources. A process with multiple threads can appear to be simultaneously performing multiple tasks. For example, one thread can communicate over the network while another thread displays data on the screen. In terms of memory forensics, thread data structures are useful because they often contain timestamps and starting addresses. This information can help you determine what code in a process has executed and when it began.
CPU Scheduling
The operating system’s capability to distribute CPU execution time among multiple threads is referred to as CPU scheduling. One goal of scheduling is to optimize CPU utili-zation as threads switch back and forth between waiting for I/O operations and perform-ing CPU-intensive computation. The operatperform-ing system’s scheduler implements policies that govern which threads execute and how long they execute. Switching execution of one thread to another is called a context switch.
An execution context includes the values of the CPU registers, including the current instruction pointer. During a context switch, the operating system suspends the execu-tion of a thread and stores its execuexecu-tion context in main memory. The operating system then retrieves the execution context of another thread from memory, updates the state of the CPU registers, and resumes execution where it was previously suspended. The saved execution context associated with suspended threads can provide valuable insight during memory analysis. For example, it can provide details about which sections of code were being executed or which parameters were passed to system calls.
System Resources
can access them, and how they are accessed. Examples of operating system resources that are typically tracked include processes, threads, files, network sockets, synchronization objects, and regions of shared memory.
The type of resources being managed and the data structures being used to track them often differ between operating systems. For example, Windows leverages an object man-ager to supervise the use of system resources and subsequently stores that information in a handle table. A handle provides the process with a unique identifier for accessing and manipulating system resources. It is also used to enforce access control to those resources and track their usage. Linux and Mac both use file descriptors in a similar manner. Later in the book, we describe how to extract this information from the handle or file descriptor tables and how to use it to gain insights into that process’ activity.
Memory Management
Memory management refers to the operating system’s algorithms for managing the alloca-tion, deallocaalloca-tion, and organization of physical memory. These algorithms often depend on the previously discussed hardware support.
Virtual Memory
Operating systems provide each process with its own private virtual address space. This abstraction creates a separation between the logical memory that a process sees and the actual physical memory installed on the machine. As a result, you can write programs as if they have access to the entire address space and in which all ranges are memory resident. In reality, some pages of the address space might not be resident. Behind the scenes, the memory manager is responsible for transferring regions of memory to second-ary storage to free up space in physical memory. During execution, the memory manager and the MMU work together to translate the virtual address into physical addresses. If a thread accesses a virtual address that has been moved to secondary storage, that data is then brought back into physical memory (typically via page fault). This interaction is represented in Figure 1-9.
Virtual Address Space Virtual Address Space
Disk (pagefile/file)
Physical Address Space
Physical Memory Sample
Figure 1-9: Illustration of multiple virtual address spaces sharing memory and secondary storage
Demand Paging
The mechanism that is commonly used to implement virtual memory is demand paging, which is a memory management policy for determining which regions are resident in main memory and which are moved to a slower secondary storage when the need arises. The most common secondary storage is a file or partition on an internal disk, referred to as the page file or swap, respectively. A demand paging implementation attempts to load only the pages that are actually needed into memory as opposed to entire processes.
Demand paging relies on a characteristic of memory usage known as locality of refer-ence, which is based on the observation that memory locations are likely to be frequently accessed in a short period time, as are their neighbors. Ideally, demand paging reduces the time it takes to load a process into memory and increases the number of processes that are memory resident at any one time. To improve performance and stability, an operat-ing system’s memory manager often has a mechanism for designatoperat-ing which regions of memory are paged versus those that must remain resident.
The memory manager typically tracks which pages are memory resident and which are not in the previously discussed paging data structures. If a thread attempts to access a page that is not resident, the hardware generates a page fault. While the hardware generates the page fault, the operating system leverages state information encoded in the paging structures to determine how to handle the fault. For example, the page might be associated with a region of a file that had not been loaded into memory, or the page might have been moved to the page file.
non-memory-resident data found on disk with the data stored in memory to provide a more complete view of virtual memory.
Shared Memory
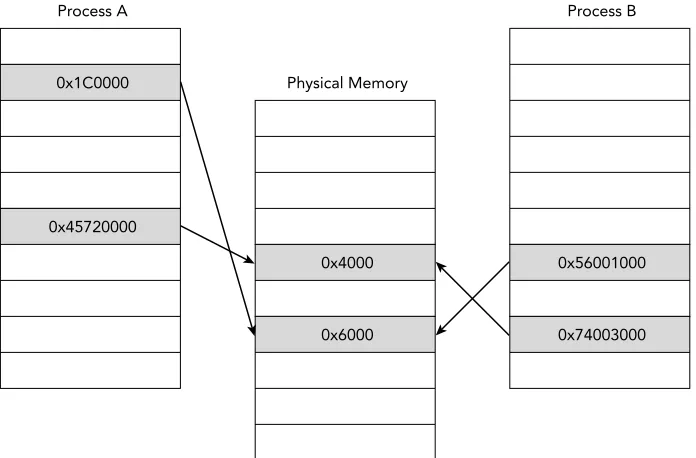
The previous sections discussed how process address spaces are isolated from each other to improve system security and stability. However, modern operating systems also pro-vide mechanisms that allow processes to share memory. You can view shared memory as memory that is accessible from more than one virtual address space. For example, Figure 1-10 shows that Process A and Process B have regions of their private virtual address space that map to common pages in physical memory. One common use for shared memory is to provide an efficient means of communication between processes. After a shared region is mapped into virtual address spaces, processes can use the region to exchange messages and data.
Process A
0x1C0000
0x45720000
Physical Memory
0x4000
0x6000
Process B
0x56001000
0x74003000
Figure 1-10: Example of shared memory mappings between two processes
memory has been modified. After the page is written to, the memory manager allocates a private copy of that page with the associated modifications and updates the virtual memory mappings for that process. The other processes are unaffected and still map to the original shared page.
Both shared memory and copy-on-write mappings are frequently encountered during memory forensics because malicious software often attempts to modify the code of shared libraries to hijack the flow of execution. In Chapter 17, you see an example of how to spot discrepancies by comparing the data shared between multiple processes.
Stacks and Heaps
The user address space is typically divided into a number of regions. The stack region holds the temporary data associated with executing functions. The data in this region is stored in a data structure called a stack frame. Each frame includes information, such as the function parameters, local variables, and the information required to recover the previous stack frame. When a thread is executing, stack frames are stored (pushed) when calling a function and removed (popped) when returning from a function. Because a process can execute in either kernel mode or user mode, operating systems typically use a separate stack for the functions executed within each mode.
Analysis of remnant and active stack frames are extremely useful during memory forensics because they provide valuable insight into which code was being executed and what data was being processed. For example, keys can be passed to encryption routines, stolen data from the computer (keystrokes, file contents) can be sent to functions for exfiltration, and a number of other possibilities. During malware analysis, stack frames can be used to infer what part of the malware was active and what parts of the system the malware was interacting with.
NOTE
Carl Pulley wrote a stack unwinding plugin for Volatility named exportstack (https:// github.com/carlpulley/volatility). It integrates with Microsoft’s debugging symbols so that it can properly label addresses and associate them with API function names. Edwin Smulders wrote a similar plugin named linux_process_stack (https://github .com/Dutchy-/volatility-plugins) for analyzing stacks in Linux memory dumps.
Applications can allocate memory regions on the heap as they are needed and then deal-locate them after use.
The operating system might also have regions of memory that are dynamically allo-cated within kernel mode. For example, Windows creates paged and nonpaged regions within the kernel that are referred to as pools. Common examples of interesting data that you can find in the heap include data read from files on disk, data transferred over the network, and input typed into a keyboard. Due to the nature of data stored within it, the heap can provide valuable evidence during forensics investigations. Because the data can be application dependent, manual analysis might be required, such as viewing data with a hex editor or by extracting strings for further examination.
File System
We previously discussed how the memory management subsystem leverages second-ary storage to free up main memory. Operating systems also use secondsecond-ary storage to manage persistent data objects that a user wants to access for a timeframe longer than the lifetime of any particular process. Unlike volatile main memory, secondary storage is typically composed of nonvolatile block devices such as hard disks. The collection of data structures that allow an application to perform primitive operations on the stored data is called a file system. File system forensics involves finding files or content of interest, recovering file artifacts (deleted, fragments, hidden), and leveraging temporal metadata such as timestamps to reconstruct the events of an incident.
Although file systems have historically been one of the most common sources of digital evidence, general file system forensic analysis is not a focus of this book. This book dis-cusses file system artifacts that you find in volatile storage, main memory artifacts that you find within the file system, and how you can combine these types of data to provide a more comprehensive view of the state of a system. For example, data stored in files and the directory structures must be loaded into memory when they are needed. The operat-ing system also caches frequently accessed data in main memory to reduce the overhead associated with repetitively querying slower secondary storage.