Development for Human Welfare 2016
392
VALUATION IRRIGATION OF RICE FARMING AT UPSTREAM
AND DOWNSTREAM AREAS IN SPECIAL REGION OF
YOGYAKARTA
Habibullah1*, Triyono1, Aris Slamet Widodo1 1)Department of Agribusiness, Faculty of Agriculture
Universitas Muhammadiyah Yogyakarta
Jl. Lingkar Selatan, Kasihan, Bantul Regency, Yogyakarta *corresponding author: [email protected]
ABSTRACT
This study aims to know Willingness To Pay (WTP) farmers for management and maintenance of irrigation and factors that influence it on rice farming at upstream and downstream areas in Special Region of Yogyakarta. Survey is conducted to 60 respondents, 30 farmers at upstream area and 30 farmers at downstream area. Primary data obtained through questioners and interviews, and then analyzed using multiple linear regression and descriptive analysis. Analysis results show that the WTP average amount of Rp17.500,- at upstream area and Rp11.167 at downstream area. Willingness to pay is influenced significantly by family size, wide land area, irrigation management services, quality of irrigation water and location. There are some farmers in downstream area that will not pay for the irrigation. They opine the water is already in nature as God’s present.
Keywords: valuation, willingness to pay (WTP), irrigation, rice farming
INTRODUCTION
Agriculture Ministry (2013) issuing to increase crop production especially for rice farming 2,3% per year. That target could be achieved by increasing farming productivity with land intensification. Intensification could be increased by optimizing production inputs. One of that inputs is to hand over availability of irrigation water, especially at wet land farming. That statement is agreed by U.S Environmental Protection Agency (2012) with statement, “Irrigation makes agriculture possible in areas previously unsuitable for intensive crop production”. In a row with previously statement, Agriculture Ministry (2013) in framework of developing main food crop production give an assignment to Unit of Echelon 1, as part of General Directorate of Infrastructure and Tools to execute developing agricultural irrigation in Indonesia.
Province of Special Region of Yogyakarta (2013) has wide wet land in amount of 56.539 acre. The land spread in some areas with wider wet land located in Sleman and Bantul Regency. Based on
area characteristic Sleman Regency is located closer with water irrigation sources, so it could be called as upstream area of water irrigation in Special Region of Yogyakarta. The irrigation water flow to various areas in Special Region of Yogyakarta, one of area is Bantul Regency which it has second wider wet land area after Sleman. Based on irrigation flow, Bantul could be called as downstream area.
393 willingness to pay (WTP) for sustainable management and maintenance of irrigation.
This study use Contingent Valuation Method (CVM) to get the value of WTP. This technique is explained by Suparmoko, et al (2014 and has been used in study of Misra, et al (1991), Tresnadi (2000), Norwood, et al (2005), Whitehead (2006), Weldesilassie, et al (2009), they use CVM as a method to determine value of goods and service which it are not marketable. To get the price of environmental cost could be got by respondents preference toward to non-market natural resource with give question about Willingness To Accept (WTA) or Willingness To Pay (WTP) as substitute merit loss or as to defend and increasing services of natural resource.
Based on earlier study willingness to pay for management and maintenance of irrigation is influenced by many factors. According to Alhassan,et al (2013); Cho, et al (2008); Arifah (2008) explain that the factors influence WTP consist of farm land location, ownership of land farm, land lease prices, income, knowledge, and farmer age. According to Hershey (1993) that water quality and management are also important factors for irrigation process. Then, the both factors should try analyzed as new factors that affect to farmers WTP.
This study aims to know farmers Willingness To Pay (WTP) for management and maintenance of irrigation, and the factors that influence it on rice farming at upstream and downstream areas in Special Region of Yogyakarta.
METHOD
This study use descriptive analysis. Location determination is chosen using purposive method. Purposive method is used by consideration that water of the irrigation in the downstream area is flowed from water irrigation in the upstream area, therefore the both irrigation canal have one water source. This study took samples of each irrigation areas in upstream and downstream as many as 5 farmers as respondents with
simple random sampling non proportional technique. The overall number of samples in this study is 60 farmers.
RESULT AND DISCUSSION
Willingness To Pay (WTP)
Willingness to pay farmers for management and maintenance of irrigation describe the level of willingness of farmers' participation in ensuring the sustainability of irrigation in farming areas in order to empower independent farmers. The independent farmers will assist the government in giving aid that precise target, so the costs for management and maintenance of irrigation from government can be accommodated by irrigation expense contribution of farmers. Willingness to pay farmers distribution of rice farming at upstream and downstream areas in Yogyakarta can be seen in the following table.
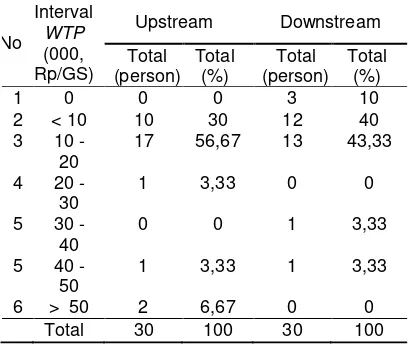
Table 1. Willingness to pay farmers distribution of rice farming for management and maintenance of irrigation at upstream and downstream areas in Special Region of Yogyakarta, 2015 Source: Primary data processed
Source: Primary data processed
Development for Human Welfare 2016
394 downstream) are willing to pay irrigation funding more than Rp20.000,- per growing season. It means that if applied irrigation funding more than Rp20.000,- it will burdensome farmers economy.
If the value of WTP both areas compared, the average value of WTP in upstream area is greater than downstream area. The upstream area has average value of WTP in amount of Rp17.500,-, and at downstream area only about Rp11.167,-. This value is derived by the total middle interval values of WTP divided by the total of respondents. From the value can be seen there are differences WTP value in both regions amount of Rp6.333,-.
The above data also shows that in downstream area amount 10% of farmers which have value of WTP amount of Rp0,-. It means that farmers do not willing to pay irrigation funding. Upon further interviewed exploration, the farmers claimed that water is already available in nature, then they opined that they do not need to pay cost for management and maintenance of irrigation. The presumption is classified on human attitudes that consider water resources as free in take or given from God which illustrated as paradoxical water pearl by Hartwick and Ollewiller (1997) in Arifah (2008) This attitude should to be educated for the sustainability of irrigation water resources.
If viewed by farmer willingness to be part of workers to manage and maintain the irrigation in both areas can be seen in the following table.
Table 2. Distribution of willing to
participate of farmers as workers to manage and maintain the irrigation, 2015
Source: Primary data processed
Based on the above table known that almost all farmers are willing to participate as worker to manage and maintain the irrigation. It means that without other or government participation farmers would still treat the irrigation for sustainability on his farming. According to result of interviewed, the management and maintenance of irrigation independently that using farmers as workforce has become a habit for a long time. The spirit of cooperation emerged because of the encouragement and farmers' awareness to manage and maintain the sustainable irrigation. To manage and maintain the irrigation usually instructed by farmers group management that known as P3A group, or by initiation of farmers with group the farmers claim that they do not need to participate as its worker. Other farmer claim that he will not participate because he is already too old, but he willing to pay irrigation funding higher than other farmers or to provide food while other farmers manage and maintenance irrigation.
The Factors that Influence the Willingness To Pay (WTP) for Management and Maintenance of Irrigation
395
Table 3. Factors that influence willingness to pay (WTP) farmers on rice farming irrigation at pstream and downstream in Yogyakarta
Source: Data processed consist of coefficients, the model summary, and analysis of variance
Note: * = Significant at α = 5%, ** = Significant at α = 10%
In comparison of value of f-count and f-table, known that value of f-table at α = 5% amount of 2.069, while the above data shows the value of f-count is greater than f-table that is equal to 3.348. The decision taken is to accept H0 and reject Ha. It means the willingness to pay is influenced simultaneously by age, level of education, family size, farming experience, wide land area, irrigation management services, irrigation water quality, ownership of land farm, and location. Partially, WTP is influenced significantly by family size, wide land area, irrigation water quality, irrigation management services, and location.
Based on the distribution of the t-table at α= 5% is known t-table amount of 2,007, while the value t-count of four variables above have a value higher than t-table. The variables are family size, wide land area, irrigation water quality, and location. Furthermore, there is one variable that has a value significantly below α= 10%, it is irrigation management services. Based on the distribution t-table at α = 10% is known amount of 1.675, while the t-count value of irrigation management service variable has a value higher than t-table that is equal to 1.973. Then, the decision taken is to accept H0 and reject Ha. It means as partially WTP
is influenced significantly by family size, wide land area, irrigation water quality, irrigation management services, and location.
Location has a coefficient amount of 10.662,694 with the direction of positive relationships. Location is a dummy variable, in this case the upstream area indicated by the value 1 and the downstream area value 0. Analysis result shows the value of WTP in upstream area is higher than the downstream area with a difference amount of Rp10.662,694,-. This indicates that each region has a different WTP each other.
The wide land area has a coefficient amount of 2,586 with the direction of positive relationships. It means that if the wider land area amount of the unit, the value of willingness to pay will increase amount of Rp2.586,-. Based on these data it is known to increase the value of WTP, the wide land areas have to be improved.
Family size has a coefficient amount of 2001,727 with the direction of positive relationships. It means if the family size is increased amount of the unit then will increase the value of willingness to pay amount of Rp2.001,727,-. In the case, family size can causes positive and negative impact. The positive impact
No Model Coefficient t-count Sig
1 Constant 3769,858 0,212 0,833
2 Age -262,699 -1,099 0,277
3 Level of education 582,838 1,129 0,264
4 Family size 2001,727 2,019 0,049**
5 Farming experience 224,434 1,544 0,129
6 Wide land area 2,586 2,372 0,022**
7 Irrigation management
services 1260,186 1,973 0,054*
8 Irrigation water quality -2953,998 -2,112 0,040**
9 Ownership of land farm -3301,242 -851 0,399
10 Location 10662,694 2.712 0,009**
R = 0,613 R-Sq = 0,376 R-Sq (adj)= 0,264 Analysis of Variance df = 59
Development for Human Welfare 2016
396 happen if the family size is consist of productive people then the source of income or farmers’ economic conditions will increasing better, so the cost for farming will become more bigger. In negative side, if the family size is consist of non productive people, then it will be burden that complicate farmers economy. Therefore, in this study possibly the family size is consist of productive people which they help farming expense to increase sustainability farmers farming.
The irrigation water quality has a coefficient amount of -2953,998 the negative relationship. It means that if a quality of irrigation water in worse per unit indicator then WTP will increase amount of Rp2.953,998. This happen because the quality of irrigation water can affect to the farm process, so that if the water quality is getting worse, the famers hope to improve the quality, by increasing the cost to repair the water quality.
Irrigation management services have a coefficient amount of 1260,186 with positive relationship. It means the better irrigation management services amount of the unit indicator, then the WTP contributions will increase amount of Rp1.260,186. Therefore, increasing irrigation management services will increase WTP value.
Then from the above data can be made a multiple linear regression model by response variable the value of willingness to pay. The model equations are structured as below:
WTP = 3769,858 – 262,699 Age + 582,838 level of education + 2001,727 family size + 224,438 farming experience + 2,586 wide land area + 1260,186 irrigation management service - 2953,998 quality of irrigation water – 3301,22 ownership of land farm dummy + 10662,694 location dummy.
The regression coefficient served to explain the effect of each factor. The data shows the determination coefficient amount of 0,264. This value indicates the value is explained by the ninth WTP
variables (Age, level of education, family size, farming experience, wide land area, irrigation management services, quality of irrigation water, ownership of land farm and location) amount of 26,4%, while the remaining 73,6% is explained by other factors which not included on the model.
CONCLUSION
Based on the results of the discussion above conclusions are derived as bellow.
1. The average willingness to pay (WTP) at upstream area amount of Rp17.500,- and in downstream area Rp11 167,- or mostly ranging on Rp10.00-20.000 by the WTP interval. 2. WTP is influenced by the location, wide
land area, family size, irrigation management services, and irrigation water quality.
Based on the above conclusions, therefore suggested that the establishment of irrigation funding should pay attention to the factors that influence WTP, especially to wide land area, family size, irrigation management services, and the irrigation water quality.
ACKNOWLEDGMENT
I gratefully acknowledge the heartiest to Mr Triyono, SP., MP who help this study (Data, references, costs, time and moral support) and also to Mr Dr. Aris Slamet Widodo, SP., MSc, he provided guidance and assistance in the midst of his busy activity.
REFERENCES
Alhassan, M.; J.Loomis; M.Frasieer; S.Davies; A.Andales. 2013. Estimating farmers willingness to pay for improved irrigation: An economic study of Bontanga Irrigation Scheme in Norther Ghana. Journal of Agricultural Science. V (4): E-ISSN 1916-9760.
Arifah, Fitria Nur. 2008. Analisis Willingness To Pay Petani Terhadap
Peningkatan Pelayanan Irigasi
Melalui Rehabilitasi Jaringan Irigasi
(Studi kasus: Daerah Irigasi
397
Kecamatan Rancabungur,
Kabuapten Bogor, Jawa Barat). Intitut Pertanian Bogor, Bogor.
Badan Perencanaan Pembangunan Nasional. 2013. Proyeksi Penduduk Indonesia 2010-2035. Badan Pusat Statistik, Jakarta.
Cho, S.H.; S.T.Yen; J.M.Bowker; D.H.Newman. 2008. Modeling
willingness to pay for land
conservation easements: Treatment of zero and protest bids and application and policy implications. Journal of Agricultural and Applied Economics. XL (1): 267-285.
Hersey, D.R.1993. Evaluation of irrigation water quality. University of California Press. LV (4):228-232.
Misra, K.S.; C.L. Huang.; S.L. Ott. 1991. Consumer willingness to pay for pestiside-free fresh produce. Western Agricultural Association. XVI (2): 218-227.
Norwood, F.B.; R.L.Luter; R.E.Massey. 2005. Asymetric willingness to pay distributions for livestock manure. Western Agricultural Economic Association. XXX (3): 431-448. Republik Indonesia. 1974.
Undang-undang Republik Indonesia No 11 Tahun 1974 tentang pengairan. Menteri Sekretaris Negara, Jakarta. Republik Indonesia. 2006. Peraturan
Pemerintah Republik Indonesia No
20 Tahun 2006 (Online).
http://luk.staff.ugm.ac.id diakses 19 Juni 2015.
Suparmoko, M.; D.Sudirman; Y.Setyarko; H.S.Wibowo. 2014. Valuasi ekonomi neraca sumberdaya alam hlm. 35-54. Dalam Valuasi Ekonomi Sumberdaya
Alam & Lingkungan. BPFE,
Yogyakarta.
Supranto. 2001. Analisis regresi ganda: Statistik teori dan aplikasi. Erlangga; Jakarta.
Syaukat, Y. & A. A. N. Siwi. 2009. Estimating The Economic Value of Irrigation Water on Rice Farming System in Vander Wijceirrigation Areas, District of Seman, Yogyakarta. Jurnal Ilmu Pertanian Indonesia XIV (3):201-210.
Tresnadi, Hidir. 2000. Valuasi komoditas lingkungan berdasarkan contingent valuation method. Jurnal Teknologi Lingkungan. I (1): 38-53.
United States Environmental Protection Agency, 2012. Irrigation (Online). www.epa.gov.html diakses 31 Januari 2015.
Weldesilassie, A.B.; O.Frӧr; E.Boelee; S.Dabbert. 2009. The economic value improved wasterwater irrigation a contingent valuation study in Addis Ababa Ethiopia. Western Agriculltural Economics Association. XXXIV (3): 428-249.
Whitehead,, J.C. 2006. Improving Willingness to pay for quality
improvements through joint
Development for Human Welfare 2016
398
DISCUSSION FROM PARALLEL SESSION
PAPER TITLE Valuation Irrigation Rice Farming at Upstream and Downstream Area in Special Region of Yogyakarta AUTHOR Habibullah, Triyono, Aris Slamet W
DISCUSSION
QUESTION
- The study aims to WTP farmer for management and maintenance of irrigation. This paper hasn’t been clear enough in stating the measurement whether is Rp/m3 or else?
- What is the reasoning behind argumentation that family size able to influence WTP? Is quality of irrigation water variable’s impact really based on certain theories?
ANSWER
- The measurement of WTP is Rp/ Growing season
- The quality of irrigation water variable’s impact negative to WTP. Family size is negative impact, if the family members are not productive. Low education and unemployment.
SUGGESTION
- Please explain some reasons in more detailed why such as family size effect the WTP
399
RICE FARMER’S PERCEP
TION AND ITS EFFECT TOWARD
INTENTION TO ADOPT ORGANIC FARMING
Ashari*, Juwaidah Sharifuddin, Zainal Abidin Mohammed, Rika Terano Department of Agribusiness and Bioresource Economics,
Universiti Putra Malaysia, Serdang Selangor 43400 *corresponding author: [email protected]
ABSTRACT
Although the organic farming has a good prospect in future, the rate of its adoption is still slow. Based on literature studies reveal that perception toward innovation characteristics has a significant contribution toward adoption. The main objective of
current study is to examine the farmer’s perception namely perceived of usefulness (PU), perceived risk (PR), environmental awareness (EN), and also attitude (AT) and their effect on the behavioral intention. This study involves 600 rice farmers as respondents in Sragen District, Central Java. The respondent is grouped into two categories namely semi organic and conventional farmer and the data were obtained through a structured questionnaire. The results show that in case of semi organic farmer, all of variables have positive effect on intention exceptional for PR. Each of variables is significant at 0.01 levels but for EN is not significant. The coefficient determination (R2=0.485) implies that 48.5% of the variance in intention is explained
by the variation of four variables. Meanwhile, in term of conventional farmers indicate the similar result in sign of direction. But, all of variables are significant at 0.01 level with R2=0.596. The overall test (F-test) exhibits that set of independent variables
jointly significant toward behavioral intention at 0.01 levels. As conclusion, it is obviously that the perceptions and attitude have significant effect toward intention.
Therefore, the effort should be undertaken to raise a positive farmer’s perception.
Farmer also needs a support from several parties to encourage them for engaging in organic farming practice.
Keywords: organic farming, farmer’s perception, adoption process, behavior intention
INTRODUCTION
The year 1992 became an historic event in the Southeast Asia region, because such year was signed of the ASEAN Free Trade Agreement (AFTA) in the ASEAN Summit in Singapore. The aim of AFTA was to create a single market and a world production base through the elimination of tariff and non-tariff constraints with the underlying goal of enhancing competitiveness with ASEAN countries. There are three pillars of the AFTA as agreed by the ASEAN leaders and they are interlinked with each other namely ASEAN Economic Community (AEC), ASEAN Political-Security Community and ASEAN Socio-Cultural Community (Anonymous, 2016).
Further, in 2003 in Bali, ASEAN leaders agreed to establish the ASEAN Economic Community (AEC) in 2020.
Four years later, the aim was reaffirmed at a meeting in 2007 with an accelerated timeframe of 2015. Eventually, the AEC have implemented on December 31, 2015 with an underlying agenda of economic integration of ASEAN countries to eliminate or minimize the obstacles in economic activity across the region, in trade, goods and services, and investment.
400 practicing enable to raise organic product demand in ASEAN countries. Besides, the growth of organic market in developed countries also provides an opportunity for Indonesia to gain the advantage.
Although organic food has a good prospect in the future; but farmer’s interest in practicing organic farming is relatively low which is indicated by slow adoption rate. The question is, why the farmers are “reluctant” to adopt organic farming that constitute as an innovation? Rogers (2003) proposed that farmer’s perception toward innovation characteristic/attributes is very critical in adoption. Thus in this context farmer’s perception on organic farming is essential. It means that if they perceive that an organic farming has many advantages, the adoption process will be easier and vice versa.
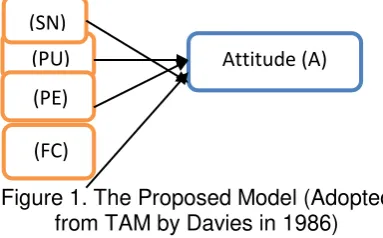
Further, according to Rogers (2003) the adoption is about a decision-making process. Therefore, farmers go through a stage or some stages of being aware or knowledgeable of organic farming related technology, to forming positive or negative perception toward organic farming. He mentioned there are five characteristics of innovations those are: relative advantage, compatibility, complexity, trialability, and observability. Individuals’ perceptions on such characteristics will determine the rate of adoption. Meanwhile, Davis (1989) who proposed the theory of Technology Acceptance Model (TAM) has formulated simpler characteristics of technology, namely perceived usefulness (PU) and perceived ease of use (PEU). PU affects to behavioral intention for adoption a certain technology directly or through the attitude as mediator. In addition, the results of case study by Wang and Liu (2016) demonstrated that attitude (both cognitive and affective) also positively influence on behavioral intention.
In particular, organic farming is closely related to environmentally friendly lifestyle. Lampkin and Padel (1994) stated that organic farming was perceived as part of the solution to environmental degradation. Meanwhile, Anderson (1995) claimed that environment concern and health problem emerged by conventional practice has contributed a significant role
in forming the sustainable agriculture movement. Maurer (1997) in Khalidi et al (2007) found environmental rationale were important for conversion and the improved social acceptance of organic farming. Thus, for farmers who are more awareness on environmental concern will have a higher intention to engage in organic farming.
Further, the adoption of technology process usually encounters an uncertainty. Thus, the perception of risk against technology also influences the adoption behavior especially for small farmers. Berry (1984) stated that small farmer more susceptible incurred the risk. The higher of farmers’ perception on the risk will reduce their perception toward technology’s advantages (Gefen et al in Horst et al 2006). According to Padel (2001) the low risk of technology is one of the characteristics that should be fulfilled by an innovation in order to be adopted easily.
In order to comprehend the process of adoption on organic farming, it requires seeking the factors affecting the adoption process. By assessing these factors will be fruitful to formulate the strategy in accelerating the adoption rate among farmers. The purpose of study is: (1) to explore the perception and attitude of farmers toward organic farmer; and (2) to examine the effect of perception and attitude on behavioral intention to adopt organic farming.
METHOD
Research Location and Sampling Procedure
401 therefore, the selected respondent exclude the organic farmers; instead the semi organic and conventional farmer. Sampling Technique
The selection of respondents is undertaken by multistage sampling method. In the first step, of 8 sub-districts as main producer area of rice are selected randomly to obtain 5 sub-districts. Based on selected sub-district, and then select randomly 2 villages for each of sub-district. After the villages identified, afterwards generate sampling frame by listing all of the farmers both semi organic and conventional farmer in selected village. To determine the respondents, the systematic random sampling is employed. In each of village, as many as 30 semi-organic and 30 conventional farmers are selected as respondent. Therefore, the total respondent is 600 farmers consist of 300 semi organic and 300 conventional farmers. Data collection process carried out by face-to-face interviews using a structured questionnaire
Data Analysis
Data were analyzed descriptively using mean in term of perceived usefulness, environmental concern, perceived risk, attitude, and behavioral intention. To measure the extent of perceived and attitude level employed the Likert Scale with a range of 1 (strongly disagree) to 7 (strongly agree). The higher mean score implies the higher perception of the variable in question. All of these variables are latent/construct; hence, each construct will be described by some measurement variables. Meanwhile, inferential statistical test is performed to determine the relationship between perceived and attitude (as independent variables) to behavioral intention (dependent) using multiple linear regressions with ordinary least squares (OLS).
Model specification was formulated in the multiple linear regressions and independent variables will supposed to be: β1 > 0, β2 < 0, β3 > 0, β4 < 0. These mean that the perceived usefulness, environmental concern, and attitude are expected to affect positively toward behavioral intention. Conversely, the perceived of risk will influence negatively on behavioral intention.
Significance Test
To examine the goodness of model, the significance test will be employed. There are two types of such significant test, namely F Test dan t test. The F test is used to determine whether a significant relationship exists between the dependent variable and the set of all the independent variables. The F test is referred to as the test for overall significance. The hypotheses will be tested is:
H0: b1 = b2 = . . . = bp = 0
Ha: One or more of the parameters is not equal to zero
402 Meanwhile, the t test is used to determine whether each of the individual independent variables is significant. A separate t test is conducted for each of the independent variables in the model. The hypotheses of t test are:
Ho : βi =0 Ha : βi ≠ 0
The t test rule states that reject H0 if p-value < a or if t < -ta/2 or t > ta/2 where ta/2 is based on a t distribution with n - p - 1 degrees of freedom. If the test results
is rejected H0, implies the variables tested have significantly effect on the dependent variable or statistically significant. In contrast, if the test results accept H0 means that independent variables do not affect on the dependent variable (Gujarati, 2002).
In addition, to investigate the multi-collinearity problem could be done by looking at the value of Variance Inflation Factor (VIF). In statistical term, the VIF quantifies the severity of multicollinearity
Table 1. Perceived Usefulness toward Organic Farming among Semi and Conventional Farmers
Code Measurement Semi Conventional
mean SD mean SD
PU1 Practicing organic farming
would improve land fertility 6.31 0.536837 5.963333 0.700207
PU2 Practicing organic farming would increase the productivity
5.91 0.629726 5.336667 1.137674
PU3 Practicing organic farming would enhance the effectiveness on paddy cultivation so reducing cost production
5.946667 0.641765 5.37 1.232137
PU4 Practicing organic farming would make easier in preparation of land (tillage)
6.3 0.569574 5.903333 0.659879
PU5 I would find organic farming useful in term increasing income
5.94 0.61454 5.25 1.196777
PU6 Practicing organic farming gives me greater control over my work in paddy field
5.693333 0.703043 5.09 1.273042
PU7 The price of selling organic rice is very good for me to start practicing organic farming
5.946667 0.852199 5.13 1.421208
PU8 The advantages of organic farming will outweigh the disadvantages
5.716667 0.691363 5.053333 1.320214
PU9 Over all, practicing organic
farming will be advantageous 6.046667 0.582196 5.306667 1.250801
403 in an OLS regression analysis. Juanda (2009) revealed that in the regression equation model, if VIF value was less than 10 indicated there was no multicollinearity in the model.
RESULT AND DISCUSSION
Farmer’s Perception and Attitudes on Organic Farming
Perceived Usefulness
Perceived of usefulness is defined as “the degree to which a person believes that using a particular system would enhance his or her productivity” (Davis,
1989). The farmer’s perception toward the usefulness of organic farming (PU) is presented in Table 1. Since PU as a latent variable, there are 9 measurement variables of PU in both semi organic and conventional farmer. Based on Table 1 shows that the highest score for semi organic farmer is attained by point 1 (PU1) namely organic farming will improve soil
fertility, followed by PU4= easier for preparation of land (tillage) and PU9 = generally will be advantageous.
This result is consonant with the study of Sukristiyonubuwo et al (2011) that revealed the farmer’s reason to convert paddy farming systems from conventional into organic primarily to improve land fertility and facilitate the land preparation.
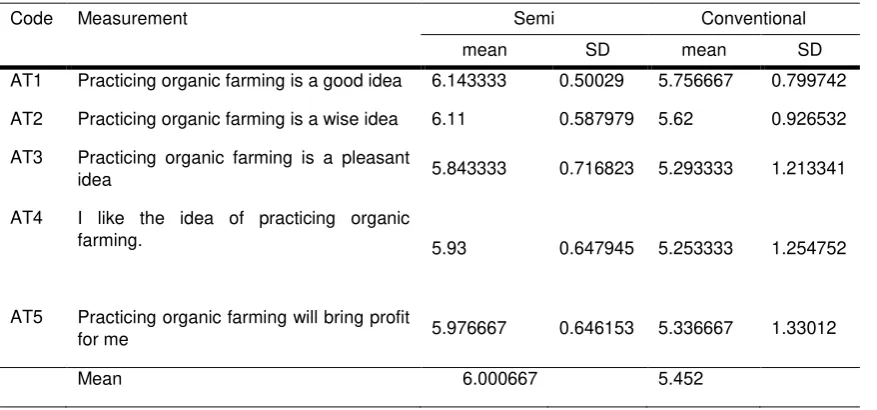
Attitude toward organic farming practices Attitude is defined as “the degree to which a person has a favorable or unfavorable evaluation or appraisal of the behavior in question” (Azjen, 1991). The attitude of farmers toward organic farming practice is presented in Table 2. In general, the attitude score in both farmer’s type toward organic farming is enough high. Further, there is a similarity between semi and conventional farmer in term of rank of attitude. Farmer place AT1
Table 2. The Attitude toward Organic Farming among Semi and Conventional Farmers
Code Measurement Semi Conventional
mean SD mean SD
AT1 Practicing organic farming is a good idea 6.143333 0.50029 5.756667 0.799742
AT2 Practicing organic farming is a wise idea 6.11 0.587979 5.62 0.926532
AT3 Practicing organic farming is a pleasant
idea 5.843333 0.716823 5.293333 1.213341
AT4 I like the idea of practicing organic
farming. 5.93 0.647945 5.253333 1.254752
AT5 Practicing organic farming will bring profit
for me 5.976667 0.646153 5.336667 1.33012
404 (practicing organic farming is good idea) as the first rank followed by PU2 (organic farming practice as wise idea). They also deem that the organic farming will bring profit for them as the third order. The mean of total measurement score indicates the score of semi organic farmer still is higher than conventional farmer i.e., 6.000667 vs. 5.452.
Environmental concern
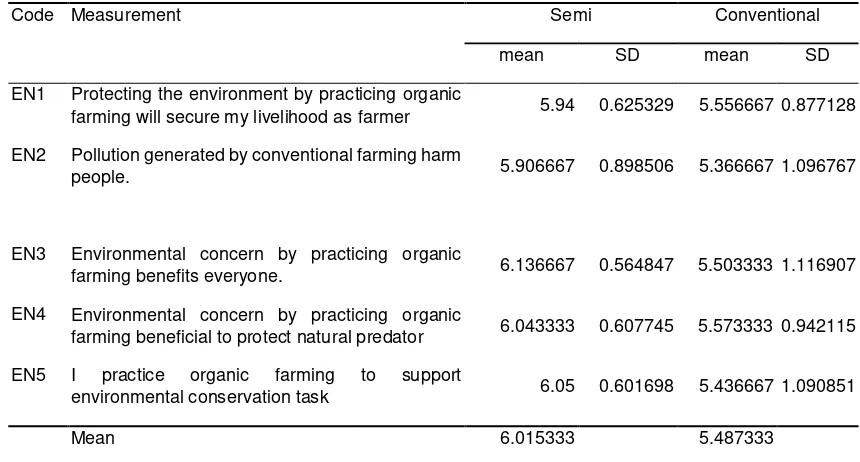
Environmental concern is “altruism toward other human being, to incorporate both self interest, or egoism, and concern with other species or the biosphere itself” (Stern et al 1993). In term of organic farming the aspect of environmental awareness is central issue. The more awareness the higher appreciation toward organic farming practices. Table 3 shows the highest rank for semi organic is EN3 and followed by EN5 and EN4. Semi organic farmer places organic farming benefit everyone, support environmental conservation and protect natural predator as the three best reasons. Meanwhile, conventional farmer proposes EN4, EN1 and EN3 respectively in term their environmental concern expression. There is similarity in EN 3 and EN4 but conventional farmer has own opinion that practicing organic farming will secure their livelihood as farmer (EN1) as a key factor.
Perceived risk toward organic farming practice
Perceived risk is “the one’s perception of the uncertainty ad adverse
consequence of desired outcome” (Fu et
al 2006). Farmers' perceptions related to the risks that could be emerged if they practice organic farming presented in Table 4. It is indicated that the semi-organic farmers are most concerned about the risk for PR1 which will reduce revenue, followed by PR3 (the risk of production) and then the PR4 (marketing risks). Meanwhile for conventional farmers the highest score is points PR2 that is uncomfortable (anxiety), followed by PR1 (the possibility of reduced income) and PR3 (production risk). Table 4 also indicates the differences in the pattern of perception compared to the previous construct. In term of perceived risk, all of measurements variables score demonstrate that the conventional farmer is always greater than the semi organic farmer. The mean score for all items also approve that perceived risk risk is higher for conventional farmers (2.5200 vs. 3.3200). The study of Prihtanti (2014) in Sragen and Karanganyar also revealed that the level of risk perceived by conventional farmers is greater than
Table 3. Environmental Awareness toward Organic Farming
Code Measurement Semi Conventional
mean SD mean SD
EN1 Protecting the environment by practicing organic
farming will secure my livelihood as farmer 5.94 0.625329 5.556667 0.877128
EN2 Pollution generated by conventional farming harm
people. 5.906667 0.898506 5.366667 1.096767
EN3 Environmental concern by practicing organic
farming benefits everyone. 6.136667 0.564847 5.503333 1.116907
EN4 Environmental concern by practicing organic
farming beneficial to protect natural predator 6.043333 0.607745 5.573333 0.942115
EN5 I practice organic farming to support
environmental conservation task 6.05 0.601698 5.436667 1.090851
405 farmers who have practiced organic farming system.
Behavioral intention to adopt organic farming
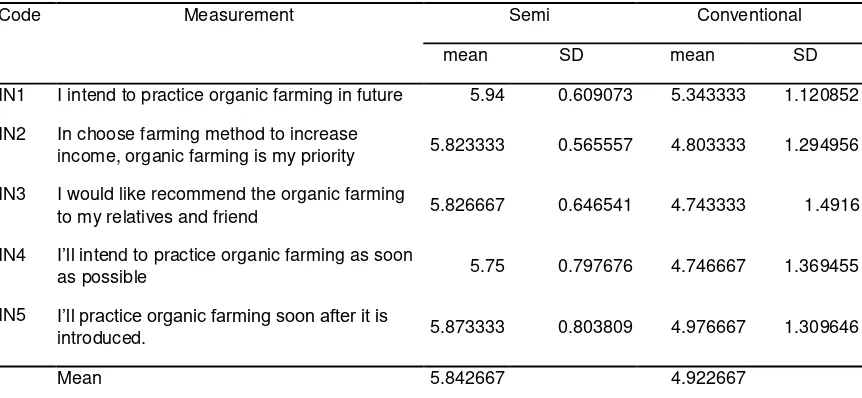
Ajzen (1991) argued that Behavioral Intention (BI) reflects how hard a person is willing to try, and how motivated he or she is, to perform the behavior. Table 5 shows the intention of both farmer types to adopt organic farming. For semi organic farmers, it appears that the highest score is the point 1 (in1) that they intend to practice pure organic farming in the future, followed by point 5 (IN5) namely intend to practice
after being introduced. While, the conventional farmers also showed similar behavior intention by choosing points 1 and 5 (IN1 and IN 5) as the first and second rank. In aggregate average mean for the intention of the adoption of organic farming, the score for growers of organic semi is higher than conventional farmers (5.8426 vs. 4.9227). It shows that the intention of adoption in semi-organic farmers is more likely to practice organic farming.
The Effect of Perception and Attitudes toward Behavioral Intention
The result of data analysis presented in Table 6 and 7. Such tables indicate the effect of perception and attitude toward behavioral intention in semi organic farmer and conventional farmer’s cases respectively. Based on Table 6 indicates that PU, EN and AT influence positively toward behavioral intention for organic farming adoption. Meanwhile, PR affect negatively toward intention to adopt organic farming. The coefficient regression show that the
increased 1 % of PU, EN, and AT will raise the intention to adopt organic farming amounted to 0.254%, 0.306%, 0.454% respectively. In contrary, the increase of PR 1% will reduce the intention of 0.063%.
Table 4. Perceived of risk toward organic farming
Code Measurement Semi Conventional
mean SD mean SD
PR1 Practice of organic farming may cause my
income decline. 2.626667 1.136483 3.36 1.57862
PR2 I will feel uneasy if I practice organic farming
method. 2.503333 1.013284 3.393333 1.579114
PR3 I do not think it is good to practice the organic
farming because of risk production. 2.613333 1.092918 3.343333 1.413784
PR4 I do not think it is good to practice the organic
farming because of risk marketing concern. 2.58 1.023274 3.333333 1.50436
PR5 It is riskier to practice the organic farming than
conventional. 2.45 0.869879 3.323333 1.44421
PR6 The organic farming will fail to fulfill my
satisfaction. 2.38 0.719253 3.186667 1.377733
PR7 I think it is not safe to practice organic farming technology because it just experimental stage and has not been implemented yet massively by agricultural expert and other farmers
2.486667 0.875047 3.3 1.491335
406 In case of conventional farmer, there is similarity with semi organic farmer (Table 7). It seemed that the PU, EN and AT influence positively toward behavioral intention to adopt organic farming. Likewise, the PR affect negatively toward behavioral intention. However, in term of the magnitude of response there are quite differences. The increased 1 % of PU, EN, and AT cause the increased of intention to adopt organic farming amounted to 0.319%, 0.231%, 0.326% respectively. Meanwhile, the increased of PR 1% will affect on reducing 0.186% of behavioral intention.
Study in other field, for instance Yi et al (2006) is also attest the positive and significant effect of perceived usefulness on the intention to accept certain technology. Similarly, the study of Fagan et al (2008) and Suki & Suki (2011) revealed a positive relationship and significant between PU and adoption intention to use computers and 3G technology, respectively. Meanwhile, study of attitude toward intention conducted Sheeran and Tylor (1999) revealed that attitude-behavioral intention correlation was 0.45. In addition Godin and Kok (1996) reported a mean attitude-intention correlation of 0.46. it is obviously, there is positive correlation between attitude and behavioral intention.
Table 6 shows that R2 = 48.3 % which indicates that 48.3 % variation of the dependent variable (behavioral intention) of semi organic farmer explained by the independent variable (PU, EN, AT and PR). In other word, 51.7 % intention to adopt organic farming is explained by other factors that are not included into the model. Meanwhile, Table 7 indicate that R2= 59.6% that implies 59.6 % variation of the dependent variable of conventional farmer explained by independent variables.
Further, regarding to the sign of coefficient value, it is obviously that all of the coefficient variables are appropriate with the hypotheses’ proposal. The simultaneous effect of independent variables toward dependent variable can be investigated by the F-statistic probability value. In case of semi organic farmer, probabilistic of F- statistic obtained at 0.000 which is less than the significance level used at 1 %. It means that at least one independent variable affects the dependent variable significantly. In addition, for conventional farmers indicate the similarity case related to F-statistic value.
Table 5. Behavioral Intention toward Organic Farming
Code Measurement Semi Conventional
mean SD mean SD
IN1 I intend to practice organic farming in future 5.94 0.609073 5.343333 1.120852
IN2 In choose farming method to increase
income, organic farming is my priority 5.823333 0.565557 4.803333 1.294956
IN3 I would like recommend the organic farming
to my relatives and friend 5.826667 0.646541 4.743333 1.4916
IN4 I’ll intend to practice organic farming as soon
as possible 5.75 0.797676 4.746667 1.369455
IN5 I’ll practice organic farming soon after it is
introduced. 5.873333 0.803809 4.976667 1.309646
407
Table 6. Results of Analysis the Factors Affecting Behavioral Intention of Semi Organic Farmers
Variables Coefficient t-statistic Probability VIF
C VIF = Variance Inflation Factor
Table 7. Results of Analysis the Factors Affecting Behavioral Intention of Conventional Farmers
Variable Coefficient t-statistic Probability VIF
C VIF = Variance Inflation Factor
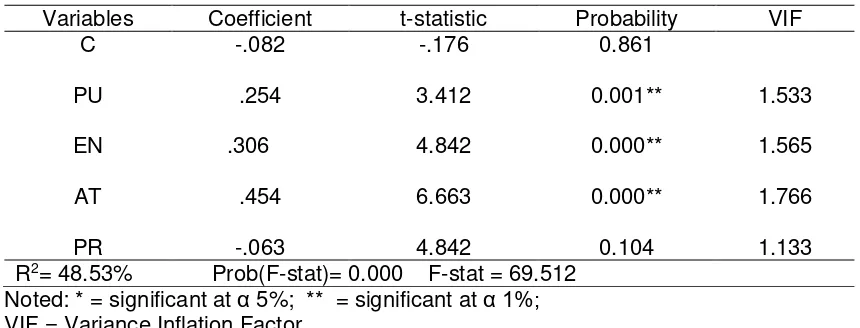
To determine whether the independence variables have significant effect toward the dependent variable individually can be detected by the t- statistic probability value of each independent variable. Table 6 demonstrates that the factor which affects the intention to adopt organic farming is PU, EN, and AT with the probability t statistic value 0.001, 0.000, and 0.000 respectively. These variables significantly affect to intention at level α of 1%. Meanwhile, the PR variable has t statistic value 0.104 or do not significantly affect in intention at level α of 5%. In case of conventional farmer indicate all of independent variables individually affect the intention at level α 1%
Based on statistical analysis (Table 6 and 7), therefore, the equation model of factors affecting the intention to adopt
organic farming in research location could be written as follows:
BIsemi = -0.82 + 0.254 PU + 0.306 EN + negative direction), however in general the sign of coefficient regression resulted the same direction. The positive affect is exhibited by PU, EN, and AT; whereas PR is negative. All of variables are consonant with hypothesis arrangement.
408 multicollinearity problem in the model could be detected by variance inflation factor (VIF) value. The rule of thumb states that if VIF value is less than 10, it indicate there is no multi-co linearity. The results of data analysis in both semi organic and conventional farmer indicate that the VIF values of all independent variables are below 5. In other word, it is obviously that there is no multicolinearity in the model.
In general, referred to analysis result (Table 6 and 7) exhibits that model used in this study is a good enough. It could be indicated by statistic criteria testing and econometric parameter. The statistical criteria are demonstrated by the value of R-squared, F-statistic, and t-statistics. Meanwhile, one of the econometric criteria can be examined by looking at the results of multicolinearity test. However, it is likely the conventional farmer model is slightly better than semi organic based on statistical criteria.
CONCLUSION
The perception of the usefulness (PU), environmental concern (EN) and attitude (AT) has a positive and significant effect on the intention to adopt organic farming in both semi organic and conventional farmer. The positive affect of three variables (constructs) against the intention of adoption demonstrates these constructs play significant role in decision process to adopt or reject the organic farming practice. The implication is; to encourage adoption process, the government should be able to convince the farmers that organic farming can provide benefit or advantages to practice. The significant role of environmental concern implies the need of program to raise the awareness of sustainability agricultural development. It requires a better support from government i.e., education and training for farmers in other to be more skilled and also shaping a good attitude toward organic farming practice.
Meanwhile, the perceived risk (PR) has negative effect on the intention of adoption although there is different
significance between semi organic and conventional farmer. It seemed that the conventional farmer is more sensitive over risk. However, the crucial point obtained is the lower of the risk will increase the chances of farmer to adopt organic farming. It implies that to encourage adoption process the government should facilitate the programs that can minimize the risk of production and the price. The efforts could be undertaken through education or extension of Good Agricultural Practice (GAP) and provide assistance in creating the market opportunities to acquire viable price.
REFERENCES
Ajzen, I. 1991. The theory of planned behavior. Organizational Behavior and Human Decision Process 50: 179-211.
Anderson, M. 1995. The life cycle of alternative agriculture research. American Journal of Alternative Agriculture 10 (1): 3-9.
Anonymus. 2016. AEC 2015: benefits and challenges for Indonesia.
https://tax.thomson- reuters.com/blog/onesource/aec- 2015-benefits-and-challenges-for-indonesia/ threat to Indonesia. Retrieval: 08-03-2016.
Barry, P.J. 1984. Risk Management in Agriculture. Ames, Iowa: Iowa State University Press.
Davis, F.D. 1989. Perceived usefulness, perceived ease of use and user acceptance of information technology. MIS Quarterly 13(3): 319-339.
Fagan, M.H., S. Neill, and B.R. Wooldridge. 2008. Exploring the intention to use computer: an empirical investigation of the role of intrinsic motivation, extrinsic motivation and perceived ease of use. Journal Computer Science, Spring 2008, pp 31-37.
409 study of taxpayer institution. Information & Management 43:109-126.
Godin, G. and G. Kok. 1996. The theory of planned behavior: A review of its applications to health-related behaviors. American Journal of Health Promotion 11: 87-89.
Gujarati, D. 2002. Basic Econometrics. Singapore: McGraw Hill.
Horst, M., M. Kuttscreuter, J.M. Gutteling. 2006. Perceived usefulness, personal experience, risk perception and trust determinants of adoption of e-government service in the Netherland. Computer in Human Behavior 23: 1838-1852.
Juanda, B. 2009. Ekonometrika Pemo-delan dan Pendugaan (Econometric modeling and estimation). Bogor: IPB Press.
Khalidi, M., R. Grey, S. Weeen, and E. Sewyer. 2007. Assessing the barriers to conversion to organic farming: an institutional analysis. Department of Agricultural Economics, University of Saskatchewan. Final Report. Lampkin, N., and Padel, S. 2004. The
economic of organic farming: an international perspective (Oxford, CAB International).
Padel S. 2001. Conversion to organic farming: a typical example of the diffusion of an innovation? Sociologia Ruralis 41(1): 40-61. Prihtanti, T.M. 2014. Analisis risiko
berbagai usaha pengusahaan lahan pada usahatani padi organik dan konvensional. AGRIC 26 (1&2): 29-36.
Rogers, EM. 2003. Diffusion of innovations (5th ed.). New York: Free Press.
Stern, P.C., Dietz, T., and Kalof L. 1993. Value orientation, gender, and
environmental concern.
Environmental and Behavior 25 (3): 322-348.
Sheeran, P. and S. Tylor. 1999. Predicting intention to use condom: A meta– analysis and comparison of the theories of reasoned action and planned behavior. Journal of Applied Psychology 29: 1624-1675. Sukristiyonubuwono R, H. Wiwik, A. Sofyan, H.P. Benito, and De Neve S. 2011. Change from conventional to organic rice farming system: biophysical and socioeconomic reason. International Research Journal of Agricultural Science and Soil Science 1(5): 172-182.
Suki, N.M., and N.M. Suki. 2011. Exploring the relationship between perceived usefulness, perceived ease of use, perceived enjoyment, attitude and subscriber’s intention toward using 3G mobile service. Journal of Information Technology Management 12(1): 1-7.
Wang, W.H. and Liu, Y.J. 2016. Attitude, behavioral intention and usagae: an empirical study of Taiwan railway’s internet ticketing system. Department of Shipping and Transportation Management. National Taiwan Ocen University.
www.swdi.org/swdsi.2009/-papers/9c04.pdf [download: 08-03-2016]
Yi, M.Y., D.J. Jackson, J.S. Park, and J.C. Probst. 2006. Understanding
Information Technology
410
Discussion from Parallel Session
PAPER TITTLE Rice Farmer’s Perception and Its Effect Toward Intention to Adopt Organic Farming
AUTHOR Ashari, Juwaidah S, Zainal Abidin M, Rika Terano DISCUSSION
QUESTION 1. I appreciate the author for reading more journals to be refused
2. All variable are defined appropriately ANSWER
SUGGESTION 1. Adding the factor analysis on the paper will be more valuable
2. Native check for English will be better 3. The best paper
411
FACTORS INFLUENCING THE ATTITUDES OF VEGETABLE
FARMERS TOWARD THE USE OF INFORMATION AND
COMMUNICATION TECHNOLOGY (ICT) IN PENINSULAR
MALAYSIA
Nor Haslina Nor Rizan, Amin Mahir Abdullah, Norsida Man, and Nolila Mohd Nawi Department of Agribusiness and Bioresource Economics, Faculty of Agriculture,
University Putra Malaysia *corresponding author:
ABSTRACT
The development of ICT, gadgets and mobile applications has expanded exponentially so much so, nobody in the country from children to elderly leave home without a gadget. This development is also being observed among farm producers. It is posited that farmers used ICT for both personal use as well as in their production as ICT will improve production and procurement of farm supplies efficiency. This research attempts to explore the types of ICT that Malaysian vegetable farmers used and factors that are influencing them to use ICT in their farm production. The study used the Technology Acceptance Model framework to analyze factors affecting ICT use. Face to face interviews were conducted on 360 respondents which were sampled by proportionate stratified sampling. A standard questionnaire was used to collect all relevant data needed for analysis. Descriptive factor and regression analyses were employed to the data gathered to obtain the required results and objectives. The respondents comprised 86.2 % male; Age from 17 to 78 years with a mean of 47 years old; most are educated until secondary schools. Four factors, namely Perceive Usefulness, Perceived Ease of Use, Subjective Norm, and Facilitating Condition, were found to be positively influencing the attitude of Malaysian vegetable farmers toward ICT usage. To enhance ICT usage among vegetable farmers, farmers training and extension should be intensified. ICT info-structure should be extended to rural areas to facilitate ICT use.
Keywords: TAM, factor analysis, regression, Malaysia
INTRODUCTION
Technology has remained an important driver of change for centuries. Last two decades have witnessed numerous significant innovation and development in the area of information and communication technology (ICT). This development in the area of ICT has triggered a lot of changes in agricultural sector as well. Majority of public in Malaysia nowadays own ICT tools. This is based on the recent statistics from the Malaysian Communications and Multimedia Commission (MCMC) shown that there are more than 13 million mobile phone subscribers in the country, with the penetration rate now surpassing the 50 percent mark while more than 84 million SMS were sent every day (Llyod, 2005). According to a report by the local newspaper, Utusan Melayu (2008), there are 500,000 of Malaysian blogs were
created while more than half million people in Malaysia have access to internet at their home in 2006. This fact shows that millions of Malaysian people able to possess their own ICT tools (Hassan et al. 2008). This development is also being observed among farm producers. It is posited that farmers used ICT for both personal use as well as in their production as ICT will improve production and procurement of farm supplies efficiency.
412 Malaysia is one of the countries that has high demand for ICT business but instead of this, level of ICT practice among farmers in developing country like Malaysia is still at average level. According to Farmers Organization Authority Malaysia (2004), the ICT practice provides input or data regarding current technology, seed, and the price of agriculture products to farmer and breeder. Moreover according to Obie china (2004), agricultural farmers have the opportunity to access information through ICT and have the opportunity to create networks with development agencies and other farmers, thus increase their chances to strengthen their agriculture business. According of that, this research attempts to explore the
Technology Acceptance Model (TAM) This study considers technology acceptance model (TAM) as base and few more factors have been added to investigate attitude of vegetables farmers toward the use ICT. TAM is a user’s intention based model. It has been developed to explain a theoretical base for many empirical studies on users acceptance of computer technology in past. The factors, Perceived usefulness (PU), Perceived Ease of Use (PE), Subjective Norm (SN) and Facilitating Condition (FC) predict attitude (A) of users towards the ICT.
Figure 1. The Proposed Model (Adopted from TAM by Davies in 1986)
Data and Analysis
A total of 360 farmers were involved in the survey as samples from Perak, Pahang, Kelantan, Terengganu, Johor, Melaka, Negeri Sembilan and Selangor in Peninsular Malaysia were chosen. By using proportionate stratified random sampling method, the vegetable farmers were stratified according to the types of group and randomly selected from the list obtained from Department of Agriculture (DOA) database in order to have a representative of the vegetable farmers population. Face - to – face interviews were carried out using a semi – structured administrated questionnaire. A survey, was concluded in July till September 2015. Descriptive, factor and regression analyses were employed to the data gathered to obtain the required results. The regression analysis was conducted to test the proposed hypotheses and identify how different factors affect the attitude (A) of vegetable farmers to accept the ICT as the dependent variable.
RESULT AND DISCUSSION
Demographics profile
In this study, among these participants, 86.2 % (313) were male. Age of the respondents ranged from 17 to 78 years with a mean of 47 years old. In terms of highest education received, 20.9
% of the respondents have
degree/diploma/ certificates education, while 33.9% have SPM certificate, 22.1 % have UPSR/ PMR, and 8.8 % have no
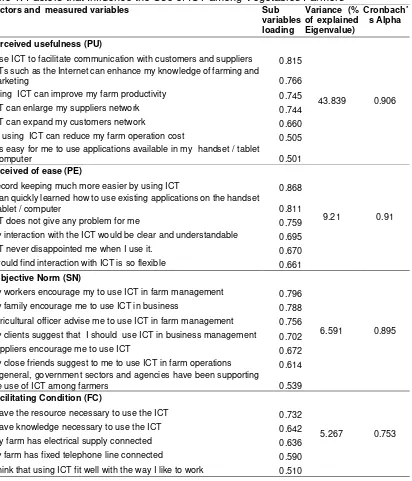
413 factor analysis and reliabilities for various constructs are given in table 1. Factor analysis yielded four factors based on the minimum Eigen value one. The sum of squared loading based on extracted four factors including PU, PE, SN and FC. The factors produced a cumulative value of 64.907% in explaining the total variance of data. The appropriated of the factor analysis was tested by two important factors i.e Kaiser-Meyer-Olkin (KMO) and
Bartlett’s test of sphericity. The KMO overall measure of sampling adequacy was 0.933 which is within the recommended level and statistically significant at p < 0.05. The Bertlett’s test of sphericity was 5701.454 and statistically significant at p< 0,05 which is the indication of good correlation among questions in the questionnaire analysis.
Table 1. Factors that Influence the Use of ICT among Vegetables Farmers Factors and measured variables Sub
variables loading
Variance (% of explained Eigenvalue)
Cronbach’
s Alpha
Perceived usefulness (PU)
43.839 0.906 I use ICT to facilitate communication with customers and suppliers 0.815
ICTs such as the Internet can enhance my knowledge of farming and
marketing 0.766
Using ICT can improve my farm productivity 0.745
ICT can enlarge my suppliers network 0.744 ICT can expand my customers network 0.660 By using ICT can reduce my farm operation cost 0.505 It is easy for me to use applications available in my handset / tablet
/ computer 0.501
Peceived of ease (PE)
9.21 0.91 Record keeping much more easier by using ICT 0.868
I can quickly learned how to use existing applications on the handset
/ tablet / computer 0.811
ICT does not give any problem for me 0.759 My interaction with the ICT would be clear and understandable 0.695
ICT never disappointed me when I use it. 0.670 I would find interaction with ICT is so flexible 0.661 Subjective Norm (SN)
6.591 0.895 My workers encourage my to use ICT in farm management 0.796
My family encourage me to use ICT in business 0.788 Agricultural officer advise me to use ICT in farm management 0.756 My clients suggest that I should use ICT in business management 0.702
Suppliers encourage me to use ICT 0.672
My close friends suggest to me to use ICT in farm operations 0.614 In general, government sectors and agencies have been supporting
the use of ICT among farmers 0.539
Facilitating Condition (FC)
5.267 0.753 I have the resource necessary to use the ICT 0.732
I have knowledge necessary to use the ICT 0.642
My farm has electrical supply connected 0.636 My farm has fixed telephone line connected 0.590 I think that using ICT fit well with the way I like to work 0.510
The model summary of the regression analysis is given in table 2.
414 identify how different factors affect the attitude (A) of vegetables farmers to accept ICT as dependent variable. The coefficient of determination is 38.9 % which shows that the variation explained in dependent variable due to independent variables.
The reports ANOVA where a significant F statistic justifies the appropriateness of the proposed model.
Predictors: PU, PE, SN , FC.
Dependent Variable: A
The value of standard error in our proposed model is 0.784 which is substantially less that the standard deviations of the dependent variable,
which further justifies that the use of proposed model is appropriate.
The relative order of preference of predictive factors of farmers intention toward use ICT based on the beta values (given intable 3) can be summarized as follows: The PEU (β=0.533, PU (β=0.242), SN (β=0.152) and FC (β=0.144). All beta values are positive indicating the positive relationships between predictors and attitudes.
These factors are statistically significant at 5% level of significance as the p value corresponding to all these factors are less than 0.05. Hence, H1, H2, H3 and H4 of no significant correlations between the factors and attitude failed to reject.
Table 2. Model Summary
R R square Adjusted R Square Std. Error of the estimate
0.623 0.389 0.381 0.78388
Table 3: Results of Regression Analysis
Model Unstandardized Coefficients
Standardized Coefficients
T Sig.
B Std. Error Beta
(Constant) -0.004 0.042 -.094 0.925 PU 0.240 0.042 0.242 5.662 0.000 PEU 0.535 0.043 0.533 12.493 0.000 SN 0.150 0.042 0.152 3.557 0.000 FC 0.144 0.043 0.144 3.379 0.001
CONCLUSION
This study investigated the factor those effects the acceptance of use ICT among vegetable farmers in Peninsular Malaysia. Four factors, namely Perceive Usefulness, Perceived Ease of Use, Subjective Norm, and Facilitating Condition, were found to positively influencing the attitude of Malaysian vegetable farmers towards the use of ICT in vegetable production. The level of ICT practice among farmers in developing country like Malaysia is still at average level. In order to increase ICT usage and encourage farmers to use it, it is suggested that concerned parties should provide the farmers with ICT training and
skills courses. Since mobile phone and smart phones are gaining popularity and mostly used ICT tools, the responsible agencies or departments should provide them with agriculture information through mobile applications such as through SMS, Whatsapp and other applications.
REFERENCES
Aafaqi, Bushra, Muhamad Jantan, and T Ramayah. 2007. Validity of the Technology Acceptance Model (TAM): A sensemaking perspective. Ijms 14 (1): 99–120.
415 the technology acceptance model for mobile tracking on patient progress applications. Journal of Computer Science 9 (6): 763–70. doi:10.3844/jcssp.2013.763.770. Azman, Azmariana, Jeffrey Lawrence
D’Silva, Bahaman Abu Samah, Norsida Man, and Hayrol Azril Mohamed Shaffril. 2013. Relationship between attitude, knowledge, and support towards the acceptance of sustainable agriculture among contract farmers in Malaysia. Asian Social Science 9
(2): 99–105.
doi:10.5539/ass.v9n2p99.
Chang, Jui-ling, Pang-tien Lieu, Jung-hui Liang, Hsiang-te Liu, and Seng-lee Wong. 2011. Factors influencing technology acceptance decisions.
African Journal of Business
Management 5: 2901–9.
doi:10.5897/AJBM10.1398.
Chuttur, Mohammad. 2009. Overview of the technology acceptance model: origins, developments and future directions. Sprouts: Working Papers on Information Systems 9
(2009): 1–23.
doi:10.1021/jf001443p.
Ejiofor, Toochukwu. 2009. Application of Information and Communication Technology (ICT) in agricultural production in Aguata Agricultural Zone of Anambra State: Constraints and enhancement measures.
Journal of Home Economics
Research 10-11: 125–34.
Hashim, Junaidah. 2007. Information Communication Technology (ICT) adoption among SME owners in Malaysia. International Journal of Business and Information 2 (2): And Communication Technology (ICT) among agri–based entrepreneurs in Malaysia. World
Conference on Agricultural
Information and It, 753–62.
Indjikian, Rouben, and Donald S. Siegel. 2005. The Impact of investment in IT on economic performance: implications for developing countries. World Development 33
(5): 681–700.
doi:10.1016/j.worlddev.2005.01.00 4.
Indrati, Aviarini, Edi Minaji, Sugiharti Binastuti, and Philipus Dwi Roharjo. 2001. Comparation of Model Unified Theory of Acceptance and Use
Technology (UTAUT) And
Technology Acceptance Model (TAM) for internet adoption of credit union staff. In The First International Credit Union Conference on Social
Microfinance and Community
Development, 1–6.
Understanding student teachers ’ behavioural intention to use technology :Technology
Acceptance Model (TAM) Validation and Testing. International Journal of Instruction 6: 89–104.
Lule, Isaiah. 2012. Application of Technology Acceptance Model (TAM) in M-Banking Adoption in Kenya. International Journal of Computing and ICT Research 6: 31–43.
Oladele, O I, and O P Fawole. 2007. Farmers perception of the relevance of agriculture technologies in
South-Western Nigeria.” Journal of Human
416 21-3-191-194-2007-1498-Oladele-O-I-Tt.pdf+farmers+percepti.
Park, Sung Youl. 2009. An analysis of the Technology Acceptance Model in understanding university students’ behavioral intention to use e-learning. Educational Technology &
Society 12 (3): 150–62.
doi:10.1007/s00340-009-3513-0. Saleh Alharbi, Steve Drew. 2014. Using
the Technology Acceptance Model
in understanding academics’
behavioural intention to use learning
management systems.”
International Journal of Advanced
Computer Science and
Applications(IJACSA) 5 (1): 143– 55. http://ijacsa.thesai.org/.
417
DISCUSSION FROM PARALLEL SESSION
PAPER TITLE
Factors Influencing The Attitudes of Vegetable Farmers toward The Use of Information and Communication Technology (ICT) in Peninsular Malaysia
AUTHOR Nor Haslina Nor R., Amin Mahir Abdullah, Norsida Man, Nolila Mohd Nawi
DISCUSSION
QUESTION
- What is the use of ICT on farm management? I wonder if the use of ICT is in ... activity ... farm management
- Why don’t use social media : FB, Twitter, Whatsapp, etc?
ANSWER
SUGGESTION