ýPLAYS,
Ari
ft
04
Y
" UNºM PS"
I=-.
RELATIONSHIPS BETWEEN OUT OF BALANCE AND
NUSALIGNMENT AND THEIR VIBRATION CHARACTERISTICS
Chua Chee Siang
TA 355 C559 2004
Bachelor of Engineering with Honours
(Mechanical
Engineering
and Manufacturing
Systems)
2004
BORANG PENYERAHAN TESIS
Judul: Relationships Between Out of Balance and Misalignment and Their Vibration Characteristics SESI PENGAJIAN : 2003/2004
Saya CHUA CHEE SIANG mengaku membenarkan tesis ini disimpan di Pusat Khidmat Maklumat Akademik, Universiti Malaysia Sarawak dengan syarat-syarat kegunaan seperti berikut:
1. Hakmilik kertas projek adalah di bawah nama penulis melainkan penulisan sebagai projek bersama dan dibiayai oleh Universiti Malaysia Sarawak, hakmiliknya adalah kepunyaan Universiti Malaysia Sarawak. 2. Naskhah salinan di dalam bentuk kertas atau mikro hanya boleh dibuat dengan kebenaran bertulis daripada
Universiti Malaysia Sarawak atau penulis.
3. Pusat Khidmat Maklumat Akademik, Universiti Malaysia Sarawak dibenarkan membuat salinan untuk pengajian mereka.
4. Kertas projek hanya boleh diterbitkan dengan kebenaran penulis atau Universiti Malaysia Sarawak. Bayaran royalti adalah mengikut kadar yang dipersetujui kelak.
5. * Saya meabeaarkaft/tidak membenarkan Perpustakaan membuat salinan kertas projek ini sebagai bahan pertukaran di antara institusi pengajian tinggi.
6. ** Sila tandakan () di mana kotak yang berkenaan SULIT
v
(Mengandungi maklumat yang berdarjah keselamatan atau kepentingan Malaysia seperti yang termaktub di dalam AKTA RAHSIA RASMI 1972).
TERHAD (Mengandungi maklumat TERHAD yang telah ditentukan oleh organisasi/badan di mana penyelidikan dijalankan).
TIDAK TERHAD
Disahkan oleh
(TANDATANGAN PENULIS) Alamat tetap: 193A, Lorong 1,
Jalan Semaba, Batu Lima 93250 Kuching, Sarawak. Tarikh: 29/03/2. Catatan ' *t
Wf
Dr Ha How UngTarikh:
i A-Plk zab`F
Potong yang tidak berkenaan.Jika Kertas Projek ini SULIT atau TERHAD, sila Iampirkan surat daripada pihak berkuasa/organisasi berkenaan dengan menyertakan sekali tempoh kertas projek. Ini perlu dikelaskan sebagai SULIT atau TERHAD.
APPROVAL SHEET
This thesis entitled
"Relationships Between Out of Balance and Misalignment
and Their Vibration Characteristics"
was prepared and presented by Chua CheeSiang as a partial fulfillment of the requirement for the degree of Bachelor of Engineering
with Honours (Mechanical Engineering and Manufacturing System) was hereby read and
approved by:
Date:1
' I" /t / (- cf Dr Ha How Ung ! " ,.Supervisor
Faculty of Engineering
Universiti Malaysia Sarawak
-In("-314ý_n
Pusat Khidmat
Maklumat
Akadendt
UNIVERSITI MALAYSIA SARAWAK 94300 Kota Sr. maraban
P. KNIDMAT MAKLUMATAKADEMK U NIMAS
11111
1000125803imiuiiuiri
RELATIONSHIPS BETWEEN OUT OF BALANCE AND
MISALIGNMENT AND THEIR VIBRATION CHARACTERISTICS
CHUA CHEE SIANG
This project is submitted in partial fulfillment of
the requirements for the degree of Bachelor of Engineering with Honours (Mechanical Engineering and Manufacturing System)
i 'i Lrr-,.. ; Faculty of Engineering
UNIVERSITI MALAYSIA SARAWAK
Dedicated to my beloved family
ACKNOWLEDGEMENTS
The researcher would like to take this opportunity to express his sincere acknowledgement
and appreciation to several individuals and parties that provided helps and guidance
throughout the duration of the project.
Sincere gratitude and appreciation to the project supervisors, Associate Professor Dr. Sinin
Hamdan and Dr. Ha How Ung, who had helped in experiment's hardware preparation and had
providing a lot of guidance and opinion in conducting the experiment and writing this report.
Also, to Mr. Stanley, who kindly gave a lot of cooperation in setting up the rotor kit test rig.
In addition, the researcher would like to specifically thanks to the all Lecturer, Laboratory
Assistants, and other technical staff of Faculty of Engineering for their assistance in carrying
out laboratory works and testing during projects duration. Last but not least, not forgetting
everyone who had involved directly or indirectly to make this project success, I would like to
thank them very much for their help.
ABSTRACT
Majority of the machinery in industries nowadays consists of rotating or moving
components. Any fault in this rotary component may lead to adverse vibration and thus the
smooth running of the system. However, each type of machinery fault exhibits a
characteristic vibration signature which is uniquely its own. The signal is the sum total of the
design, manufacture, application, and wear of each of its components. Unbalance normally
generates 1x rotating speed (RPM) dominant vibration in vibration spectrum, due to the cyclic
excitation force that encounter each time the machine makes a full revolution. On the other
hand, 2x RPM dominant vibration will normally presented in vibration spectrum for misalignment problem, where each of the two shaft causing a cyclic excitation forces. Phase relationship between inboard and outboard bearing across coupling, will be the easiest way to differentiate the above 2 mechanical defect, as misalignment normally will also generate high vibration at 1x RPM.
AB STRAK
Kebanyakan mesin yang digunakan di dalam industri hari ini mengandungi komponen
yang berpusing dan bergerak. Sebarang kerosakan di dalam komponen berpusing ini
mungkin menyebabkan getaran, seterusnya mengakibatkan sistem tidak dapat berfungsi
dengan lancar. Walaubagaimanapun, setiap jenis kerosakan pada komponen berpusing ini
mempunyai sifat getaran yang unit. Signal ini merupakan hasil daripada kesalahan
rekabentuk, proses pembuatan, cara penggunaan, dan hakisan yang dialami oleh komponen
tersebut. Ketidakseimbangan biasanya menyebabkan 1xRPM dalam spectrum getaran,
disebabakan daya yang dialami setiap kali mesin membuat satu putaran lengkap. Sebaliknya, 2xRPM getaran akan muncul di dalam spectrum getaran sekiranya ketidaktepatan garispusat
aci merupakan masalah yang terbesar. Hubungan fasa di antara dua bearing sokongan,
merupakan cara yand terbaik untuk membezakan di antara dua masalah tersebut,
memandangkan ketidaktepatan garispusat aci kadangkala juga akan mengakibatkan getaran
tinggi di 1xRPM.
£}IIS: 1I li! xidnlat Njai': "ý'ism' "ýýýaRýr`lT4d'iC
UN1VERSITi MALAYSIA SAkAWAS
! ' y'ºVý
,:, i;.;, ilwi'wý
94ät
TABLE OF CONTENTS
Description
Confirmation Letter of Project Report Submission Approval Sheet Title Page Dedication Acknowledgements
Abstract
Abstrak
Table of Contents
List of Figures
List of Tables
List of Appendixes
CHAPTER 1
INTRODUCTION
1.1
Background Of Vibration Monitoring
1.2
Objective of Work
1.3
Definition of Terms
1.3.1
Definition of Vibration
1.3.2
Definition of Unbalance
1.3.3
Definition of Misalignment
Page
1 11 III iv V V1-1R 1R-X R1 X111
4
4
4
4
5
V1CHAPTER 2
LITERATURE REVIEW
2.1
Review of Fundamental Vibration Theory
2.2
Vibration Spectrum
6
8
2.2.1
Time Domain Analysis
9
2.2.2
Frequency Domain Analysis
11
2.3
Selection of Measurement Parameter :
Displacement, Velocity or Acceleration
2.4
Important of Phase in Vibration Monitoring
2.5
Typical Spectra and Phase Behaviors for Unbalance
and Misalignment
2.6
Severity of Machinery Vibration
2.6.1
Velocity RMS
2.7
Vibration Transducers
2.8
Rigid and Flexible Rotors
2.9
Rotor Mode Shapes
CHAPTER 3
METHODOLOGY
3.1
Introduction
3.2
Bently Nevada Rotor Kit
12
15
16
17
20
22
23
27
31
31
3.2.1
Rotor Kit Components
33
3.2.1.1
Rotor and Base Assembly
33
3.2.1.2
Motor and Motor Speed Control
34
3.2.1.3
Proximity Probes and Proximitor
Assembly
34
3.2.1.4
Auxiliary Components
34
3.2.2
Setting Up The Rotor Kit
35
3.2.2.1
Rotation Direction
35
3.2.2.2
Probes
35
3.2.2.3
Aligning the Mass
36
3.2.3
Rotor Kit Setup for Unbalance and Misalignment
37
3.2.3.1
Mass Unbalance
3.2.3.2
Misalignment
3.2.4
Safety Precaution.
3.3
ADRE for Windows
3.4
Data Collector 2526
3.5 Experimental Procedure
CHAPTER 4
RESULTS AND DISCUSSION
4.1
Experimental Data of Various Rotating Speed.
37
38
38
39
40
40
42
4.1.1
Discussion
45
4.2
Experimental Data of Various Unbalance Weight.
47
4.2.1
Discussion
52
4.3
Experimental Data of Unbalance Weight at Various Angle.
54
4.3.1
Discussion
56
4.4
Experimental Data of Misalignment Condition.
57
4.4.1
Discussion
63
CHAPTER 5
CONCLUSION AND RECOMMENDATION
5.1
Conclusion
5.2
Recommendation
65
67
BIBLIOGRAPHY
69
APPENDIXES
71
LIST OF FIGURES
Description
Page
Figure 2.1 : Fast Fourier Transform 9
Figure 2.2 : Velocity and Displacement Spectrum 12
Figure 2.3 Sensitivity of Parameter to Failure 13
Figure 2.4 : Sinusoidal Wave Form 21
Figure 2.5 : Combination of Vibration Sources 22
Figure 2.6 : Rigid and Flexible Rotor 25
Figure 2.7 Measurement of Displacement on a Center Mounted Disk 28
Figure 2.8 : Rotation of Rotor
(a) Below and (b) Above its Shaft Critical Speed.
30
Figure 3.1 : Bently Nevada Rotor Kit
Figure 3.2
Rotation Direction of Rotor Kit
Figure 3.3 : Mounting of Proximity Probe
33
35
36
Figure 3.4 : Aligning the Mass of the Flywheel.
37
Figure 4.1 : Orbit Plot for Inboard Bearing@1500 RPM.
47
Figure 4.2 : Orbit Plot for Outboard Bearing@1500 RPM.
47
Figure 4.3 : Bode Plot for Inboard Bearing@1500 RPM.
48
Figure 4.4 : Bode Plot for Outboard Bearing@1500 RPM.
48
Figure 4.5 : Vibration Spectrum for Inboard Bearing@1500 RPM.
49
Figure 4.6 : Vibration Spectrum for Outboard Bearing@1500 RPM.
49
Figure 4.7 : Reference Orbit Plot for Inboard Bearing@1800 RPM.
58
Figure 4.8 : Reference Orbit Plot for Outboard Bearing@1800 RPM.
58
Figure 4.9 : Orbit Plot for Inboard Bearing@1800 RPM
when in misalignment condition. 59
Figure 4.10: Orbit Plot for Outboard Bearing@1800 RPM
when in misalignment condition.
59
Figure 4.11: Reference Inboard Bearing Spectrum@ 1800RPM
60
Figure 4.12: Reference Outboard Bearing Spectrum@ 1800RPM
60
Figure 4.13: Misaligned Inboard Bearing Spectrum@ 1800RPM
61
Figure 4.14: Misaligned Outboard Bearing Spectrum@ 1800RPM.
61
Figure 4.15: Inboard Bearing Vibration Spectrum@ 1800RPM
62
Figure 4.16: Outboard Bearing Vibration Spectrum@ 1800RPM
62
LIST OF TABLES
Description
Page
Table 2.1 : Vibration Severity Criteria
Table 4.1
Inboard Bearing Vibration Displacement Parameter
for Various Speed.
Table 4.2 : Outboard Bearing Vibration Displacement Parameter
for Various Speed.
Table 4.3
Vibration Velocity at Various Speed.
Table 4.4 : Inboard Bearing Vibration Displacement Parameter
for Various Unbalance Weight.
Table 4.5
Outboard Bearing Vibration Displacement Parameter
for Various Unbalance Weight.
Table 4.6 : Vibration Velocity for Various Unbalance Weight.
Table 4.7
Inboard Bearing Vibration Displacement Parameter
for Various Phase Angle.
Table 4.8 : Outboard Bearing Vibration Displacement Parameter
for Various Phase Angle.
Table 4.9 : Vibration Velocity for Various Phase Angle.
19
43
44
44
50
50
51
53
54
54
xiLIST OF APPENDIXES
Description
Page
Appendix A
Bode Plot and Spectrum for Experiment 1.
71
Appendix B : Bode Plot and Spectrum for Experiment 2.
73
Appendix C : Bode Plot and Spectrum for Experiment 3.
76
Appendix D
General Vibration Severity Chart.
79
Appendix E
Comparison of Vibration Displacement, velocity and
Acceleration Severity
81
Appendix F
Vibration Diagnostic Chart
82
Appendix G : Application of FFT in Time Response Calculations
87
Appendix H : Application of DFT and FFT algorithms
89
CHAPTER 1
INTRODUCTION
1.1
Background Of Vibration Monitoring
In today's fast changing marketplaces, many industrial plants are seeking
methods and techniques to optimize the operating efficiency of their existing plants, by extending equipment life, and reducing operation and maintenance expenses, in order to remain competitiveness.
Suitable maintenance practice is necessary to ensure the continued, safe and
profitable operation of industrial
machinery and plant, that higher plant availability
and reliability are achieved in the most cost effective manner [Shrieve
and Hill, 1998].
Generally, maintenance activities may be categorized as either reaction based, time based, or condition based. Reaction-based maintenance normally takes the form of continuous operation until a failure occurs. Then, a correction action will be taken to repair the damage and return the machinery train to operation as soon as possible. This type of maintenance practice is also called Breakdown Maintenance. Time-based
maintenance, is concerned with interrupting production on machinery at regular
intervals for maintenance. This is done to reduce the number of unplanned stop that
can arise from breakdown maintenance strategy. This type of maintenance practice is
also called Preventive Maintenance. Condition based maintenance, on the other hand
is based upon reasonable knowledge of the mechanical condition of machinery, which
evaluates equipment condition to determine maintenance needs.
In order for the condition-based maintenance to be success, a condition-
monitoring program is therefore needed. Condition monitoring of machinery can
provide actual condition for a machine without the needs of dismantle, shutting down
or even direct contact to the equipment. It also can identify machine train problems before they become serious. This indirectly provides the opportunity of organizing
avoidance strategies to minimize lost time and unexpected costs, thus greatly
improving manufacturing efficiency.
For any condition monitoring programs, vibration analysis is one of the
dominant techniques used. The simple reason is that all machines vibrate, even
machinery which is in good operating condition will vibrates at certain degree. Vibrations normally arise from the cyclic excitation forces, which are present within a machine. These forces are sometimes built into the design of the equipment, or can be due to real changes in the dynamic properties of the individual machine elements. These excitation forces may be transmitted to adjacent components or the adjoining machine structure, thus causing parts of the equipment remote from the source to vibrate accordingly to varying degrees [Mathew, 1985].
Since each type of mechanical defect has its own unique vibration characteristic, any change in vibration is a signal showing that the mechanical health
of a particular machine is changing. Keeping this in mind and applying a systematic
method of monitoring vibration on a piece of equipment at set intervals, any increase in vibration level recorded over time provides an early warning of impending trouble. Once this change in vibration level exceeds preset tolerances, corrective action should be initiated to prevent a costly breakdown failure [Larry Bowler].
For rotating machinery, the excitation forces that cause vibration are usually
generated through the rotating motion of the machine parts. Because these forces
change in direction or amplitude according to the rotational speed (RPM) of the
machine components, it follows that most vibration problem will have frequency that
are directly related to the rotational speed [Gardiner, 1998]. For this reason, unit of velocity (in/sec or mm/sec) was recognized as the most accurate means of monitoring the overall health of a piece of machinery. Because any change in the amplitude or the frequency of a generated vibration signal will produce a change in the measured velocity value.
Therefore, combination of trend and vibration spectrum can be used to analyze the failure mode associated with shafts, bearings, gears, couplings, motors and many other machine components.
1.2
Objective of Work
The aim of this project is to study the relationship between two common
machinery faults, which is out of balance and misalignment. Experiment and studies
will be carry out to determine the effects of out of balance and misalignment on the vibration characteristics of rotating machinery.
1.3 Definition of Terms
1.3.1 Definition of Vibration
Vibration is defined by Webster's New World Dictionary as "to swing back and forth; to oscillate". In the vibration industry, vibration means the pulsating motion of a machine or a machine part from its original place of rest. Vibration is the response of a system to some internal or external stimulus or force applied to the system. In vibration monitoring, 3 important parameters are normally being encounter, which are the Amplitude (Severity), Frequency (How many times per minute or seconds) and phase (How it is vibrating).
1.3.2 Definition of Unbalance
Unbalance is a common feature of all rotational elements. It is a side
effect caused by the imperfection of material (e. g. heterogeneity) and the
manufacturing process, as well as the effect of wear by use (e. g. erosion).
Generally, each unbalance of mass in rotary motion is the source of rotational
forces and moments of inertial forces which, being transferred through the bearings to the body of the machine, evoke vibrations in the whole system. There are several types of unbalance, which is static unbalance, moment unbalance, quasistatic unbalance and dynamic unbalance [Cempel, 1991].
1.3.3 Definition of Misalignment
The power unit of machinery and its working part (e. g. Steam turbine and pump) form in general separate components that is joined by a coupling at the shaft end. This joint is often not aligned and can distinguish a fault called
misalignment. There are three types of shaft misalignment, which is radial,
angular and oblique misalignment. This misalignment is normally the source
of double rotary frequency (2 X RPM) vibration. The amplitude of these
vibrations is directly proportional to the radial displacement and the angular
displacement, and varies with the obliquity parameter [Cempel, 19911.
CHAPTER 2
LITERATURE REVIEW
2.1
Review of Fundamental Vibration Theory
From the "Handbook of Condition Monitoring" edited by Alan Davies, D. W Gardiner had made a review of the fundamental of vibration theory. Vibration means the motion of a machine, or machine part, back and forth from its position of rest. The motion of the weight from its position of rest, to the upper limit of travel, then to the lower limit of travel, and returns to its original position represent one cycle or period of motion.
Three important characteristics that are important to define a vibration are :
amplitude, frequency and phase. Amplitude describes how much a machine of system
vibrates. Vibration amplitude can be measured in 3 main engineering units:
a)
Displacement
Total distance travelled by the vibration part from one limit to another,
normally referred as the "Peak to Peak" displacement.
b)
Velocity
The speed required for a vibration part to move, for a certain distance. Vibration speed is constantly changing, since during a cycle of motion the highest velocity is selected for measurement.
c) Acceleration
The measurement of "rate of change of velocity", normally expressed in g's peak, where ig is the acceleration produced by the force of gravity at the surface of the earth.
Vibration frequency describes the number of complete cycles that occur in a
specified period of time. In other words, vibration frequency is the inverse of the
period of the vibration, where
Frequency = 1/Period
The vibration frequency is normally measured in Hz (Hertz) or CPM (Cycle per Minute).
Phase is another important parameter required to describes vibration
characteristic. Phase is defined as "The angle between the instantaneous position of a
vibrating part and a fixed reference position". In short, phase measurement can
provide information regarding the relative motion between two or more machinery parts [Gardiner, 19981.
2.2
Vibration Spectrum
From the Training Manual "Advanced Vibration Diagnostic and Reduction Techniques" published by Technical Associates of Charlotte Inc, James E. Berry had discussed about what is a vibration spectrum.
A vibration spectrum is a graph that plots the amplitude (mils, in/sec or g's) versus the vibration frequency (CPM or Hz). In other words, it is the presentation of
vibration data in frequency waveform. Normally, vibration event are recorded by
using an oscilloscope or a real time analyzer, where the signals are in the form of time domain.
Displaying and using the time domain is a very precise method which display
the actual machine motion and to analyze the various vibration parameters. However,
analyzing the time waveform itself can be very cumbersome and labor intensive when
frequency needs to be determined. To simplify this process, vibration instruments are normally able to develop what is known as Fast Fourier Transform (FFT).
An FFT is the computer (microprocessor) transformation from time domain
data (amplitude versus time) into frequency domain data (amplitude versus
frequency). This FFT calculation technique was developed by Baron Jean Baptiste
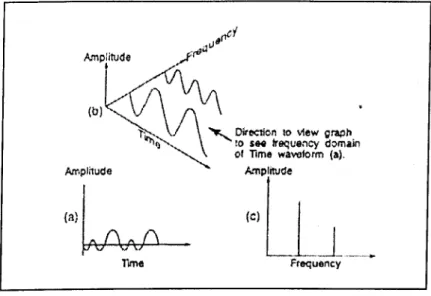
Fourier. The process of FFT is illustrated in figure 2.1.
Amplitude
()
`tom Direction to slew graph o see frequency domain of Time waveform (a).
Amplitude ý Amplitude (a) I 1 4 %111 n w a --n----Time Frequency
Figure 2.1 : Fast Fourier Transform
From the figure, a total time waveform is captured in the time domain first (a). This time domain waveform is then separated into its separate sine waveforms and displayed in three-
dimensional coordinates of amplitude, time and frequency (b). From the combined
waveform, the frequency of each sine wave is determined and the sine waves are placed in the respective position along the frequency axis. A view looking along each individual waveform is shown allowing the analyst to see the frequency domain of amplitude versus frequency (c). Details mathematic equations of FFT are shown in Appendix G and H.