ANALYSIS OF MARKETING MIX AND SALES PERFORMANCE OF “INDUSTRI
HILIR TEH WALINI” PRODUCT
Analisis Bauran Pemasaran dan Performa Penjualan Produk “Industri Hilir Teh Walini”
Dwi Oktaviyanti1, Masyhuri1, Jangkung Handoyo Mulyo1 1Faculty of Agriculture Universitas Gadjah Mada
ABSTRACT
This research as a case study in “Industri Hilir Teh Walini” aimed to: (1) describe the marketing mix strategy, (2) examine the inluence of marketing mix strategy on sales, (3) know the sales performance of products, (4) forecast the future demand of primary products, and (5) explore the strengths, weaknesses, opportunities, and threats (SWOT). Descriptive explanation, multiple linear regression analysis, one way analysis of variance, moving average forecasting, and SWOT analysis were conducted. This research showed that in the product mix as a component of marketing mix, this business unit offers tea products in various packaging and lavoring. The price determination conducted based on cost, market competition, and standards in certain lines. The promotion mix used are Above and Below The Line communication strategy. The place mix conducted by distributing products through selective distribution channel and direct channel. Promotion cost and lavor variants variables of the marketing mix were proven to have positive signiicant inluence on the sales. Based on the one way analysis of variance, grouped tea product sales of tea bag, loose and instant tea, and ready to drink tea were signiicantly different. Forecast of black tea bag, lemon lavored black tea bag, and green tea bag sales volume in 2014 which give the best sales performance tend to be luctuated. The SWOT analysis showed that this business unit’s position is in quadrant 1 which supports the SO (Strengths-Opportunities) strategy.
Keywords: marketing mix, sales, forecast, SWOT
INTISARI
Penelitian ini sebagai sebuah studi kasus di “Industri Hilir Walini” bertujuan untuk: (1) mendeskripsikan strategi bauran pemasaran, (2) menguji pengaruh strategi bauran pemasaran terhadap penjualan, (3) mengatahui performa penjualan produk, (4) meramalkan permintaan mendatang dari produk-produk utama, dan (5) menyelidiki kekuatan, kelemahan, peluang, dan ancaman (SWOT). Penjelasan deskriptif, analisis linear berganda, analisis varian satu arah, peramalan rerata bergerak, dan analisis SWOT dilakukan dalam penelitian ini. Penelitian ini menunjukkan bahwa dalam bauran produk sebagai salah satu komponen dari bauran pemasaran, unit bisnis ini menawarkan produk-produk teh dalam kemasan dan rasa yang bervariasi. Harga ditentukan berdasar biaya, kompetisi pasar, dan standar pada lini-lini tertentu. Bauran promosi yang digunakan adalah strategi komunikasi Media Lini Atas dan Lini Bawah. Bauran tempat dilakukan dengan distribusi melalui jalur distribusi selektif dan distribusi langsung. Variabel biaya promosi dan varian rasa sebagai komponen bauran pemasaran terbukti secara signiikan berpengaruh positif terhadap penjualan. Berdasar analisis varian satu arah, penjualan kelompok produk teh celup, teh seduh dan instan, dan teh siap minum secara signiikan berbeda. Peramalan penjualan teh celup hitam, teh celup hitam rasa lemon, dan teh celup hijau yang memberikan performa penjualan terbaik cenderung berluktuasi. Analisis SWOT menunjukkan bahwa posisi unit bisnis ini berada pada kuadran 1 yang mendukung strategi KP (Kekuatan-Peluang).
Kata kunci: bauran pemasaran, penjualan, peramalan, SWOT
INTRODUCTION
Tea is one of Indonesian plantation commodities which has a great role in Indonesian food processing industry, especially in the beverage industry. Tea is well known to be served as a cup of brewed tea, a drink made by pouring boiling water onto tea leaves. Since then tea is favored by many people and becoming an unseparated part of their life. The advantages of great opportunity in
the national market are taken by many businessmen in the tea processing industry to keep developing their business.
business unit owned by “PT Perkebunan Nusantara VIII Persero”. The existence of “IndustriHilirTeh (IHT) Walini” started in 1996. Since the year 2009, products of “IndustriHilirTehWalini” began to penetrate the modern trade market in Indonesia.The products are grouped into three types of products based on the processing and value adding activities. There are tea bag products, loose and instant tea products, and ready to drink tea products.
The marketing strategy conducted by any irm always based on the state of the external and internal irm which includes strength, weakness, opportunity, and threat. This also known as the SWOT analysis. This analysis determines which kind of marketing strategy best applied by the irm and then the result of the marketing strategy can be seen from the sales as a representation of the product’s performance in providing proit to the irm.
Theoritical Framework
Deinition of Market and Marketing
Market is a set of actual and potential buyers of a product (Kotler and Armstrong, 2008). According to American Marketing Association (AMA) in Kotler and Keller (2009), marketing is an organizational function and a set of processes for creating, communicating, and delivering value to customers and for managing customer relationship in ways that benefit the organization and its stakeholders.
Marketing Analysis
Managing the marketing function begins with a thorough analysis of the situation of the company. Marketers must conduct a SWOT analysis to assess strengths (S), weakness (W), opportunities (O), and threats (T) of the company The goal is to match the strength of the company with existing opportunities that exist in the environment and to eliminate or overcome weaknesses and minimize threats(Kotler and Armstrong, 2008).
Marketing Mix
According to Kotler and Armstrong (2008), marketing mix is a set of controllable tactical marketing tools that the company combined to produce the response desired in the target market. The marketing mix can be grouped into four groups of variables called the “four Ps”: Product, Price, Place, and Promotion.
a. Product Mix
The term product refers to a physical commodity or anything offered by an organization to provide customer satisfaction(Bell and Vincze, 1988).A firm’s product mix has four important dimensions: width, length, depth, and consistency. The width of product mix pertains to the number of different pfoduct lines that the irm sells. The length of product mix pertains to the number of total products or items in its product lines. The depth of product mix pertains to the total number of variations for each product. The variations include size, lavor, formulation, and any other distinguishing characteristic. The consistency of product mix pertains to how close is a product line to another product lines in terms of use, distribution lines, or other terms (Kotler and Armstrong, 2008). Every product generally can have three major elements: attributes, beneits, and a support system(McDaniel and Darden, 1987).
b. Price Mix
Price refers to the perceived value which is exchanged for something else. Price is typically the value of money exchanged for good or service. The price determination depends primarily on the demand for the good or service and the cost to the seller for that good or service. Other factors such as distribution and promotion strategies, perceived quality, and stage of the product life cycle can also inluence price(McDaniel and Darden, 1987).
c. Promotional Mix
d. Place Mix
The place determines the place where, when, and by whom goods and services can be offered for the target market. Goods and services are delivered to consumers through distribution channels (Irawan, 1997). For this purpose, irms may use different kind of distribution channels to be applied. The existing distribution channels can be divided into direct distribution channel and indirect distribution channel.Indirect distribution channel has some options includes(Gitosudarmo, 2012):
1. Exclusive distribution channel, a distribution channel using one single distributor.
2. Selective distribution channel, a distribution channel using some dealers or distributors. 3. Intensive distribution channel, a distribution
channel using as many as possible distributors in order to reach consumers that spread in a wide area.
Trend and Sales Forecasting
The time series data can be used to draw a trend line. Forecast is essentially an estimate of the occurrence of an event or events in the future. The analysis based on periodic data is called periodic data analysis (time series analysis) which is dynamic (Supranto, 1993).A sales forecast estimates the future sales. Uncertainty limits the accuracy of this estimation. (Bell and Vincze, 1988).
RESEARCH METHODS
To achieve its objectives, this research uses a descriptive method. Descriptive method can be interpreted as a problem-solving procedure which is examined by describing or depicting the state of the subject or object of the research at the present time based on the facts. This method is not limited to the collection of data but also includes the analysis and interpretation of the data (Nawawi, 2012).
Both primary and secondary data were collected and analyzed. Primary data obtained through direct observation and interviews to obtain information about the strategies applied in marketing mix and an overview of the state of internal and external business units. The secondary data obtained from the business unit related to the research includes regular monthly reports on sales, number of products lavor variants, pricing levels, promotion cost, and the number of marketers.
Hypothesis
a. The marketing mix strategy applied (product, price, promotion, place) is expected to have a signiicant inluence on the product sales. b. Each of the three grouped product variants (tea
bag, loose tea, and ready to drink tea products) is expected to give different monthly sales performance.
c. It is expected that the future demand of the primary products tend to be luctuated.
d. It is expected that the state of “Industri Hilir Teh Walini” is in the irst quadrant of position evaluation matrix.
Data Analysis Method
Descriptive
To know the marketing mix strategy conducted by the business unit, the researcher gives a descriptive explanation about the marketing mix strategy conducted by the business unit.
Multiple LinearRegression
In this method, the technique of Ordinary Least Square (OLS) to estimate a multiple linear regression and its inference procedures are used. The use of OLS requires the fulillment of several assumptions (called the classical assumptions: Gauss-Markov). If these assumptions are met, the parameters obtained by OLS will be the Best Linear Unbiased Estimator (BLUE) (Arieianto, 2012). Therefore, the normality test and the classical assumption test are conducted before the econometric regression analysis is performed.
The multiple regression analysis is used in the equation model:
Y = β0 + β 1LnX1 + β 2LnX 2 + β 3LnX 3 + D + u
Note:
Y Variable = sales value (Rp/month)
β 1 to β 4 Parameters= regression coefficient or slope
β0Parameter = constant or intercept X1 Variable = promotion cost (Rp/month) X2 Variable = number of marketers X3 Variable = number of lavor variants D Variable = price level (dummy)
One Way Analysis of Variance
According to Suharyadi and Purwanto (2004), an analysis of variance (ANOVA) is used to study the comparison among some population mean simultaneously. This analysis requires normal distribution and homogenous variance for every population, the same standard deviation for every population, and samples from the population are randomly taken and independent.
The One Way Anova Test is conducted with the hypothesis:
In order to know speciically which population has different mean, a further test is needed using the Tukey HSD test.
Hypothesis:
In the method of moving average, average calculation is done by moving forward to estimate sales volume which will come later. From the calculation of the moving average can then be calculated estimate of the center period to obtain a neat monthly estimate. To be more precise in its application, the index number need to be calculated again by inding the average of the index numbers of each quarter. By applying the index numbers and their seasonal moving average, calculation of the future sales estimation can be obtained (Gitosudarmo, 2012).
Note:
= Moving Average
= number of period(s) in the moving average
= demand in period i = period
SWOT Analysis
However, before the SWOT analysis concluded it is necessary to test the validity and reliability of the questionnaire as the instrument (Jogiyanto, 2008). The matrix of external and internal factor evaluation (EFE and IFE Matrix) are made based on the scoring of both external and internal factors of the business environment (David, 2006).
a. Position Evaluation and SWOT Matrix Position evaluation matrix is a depiction of organization position which consists of four quadrants to indicate whether the aggressive strategy, diversiication, defensive, or turn-around strategy best applied to a particular organization (Rangkuti, 1998).
b. SWOT Matrix
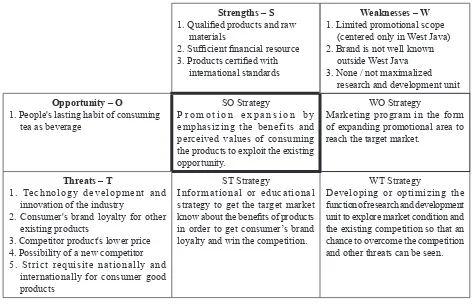
The SWOT matrix is atoolwhich commonly used to match the important things that help managers develop four types of strategies: SO (strengths-opportunities), WO (weaknesses-opportunities), ST (strengths-threats), and WT (weaknesses-threats).
RESULTS AND DISCUSSION
Marketing Mix
Product Mix Strategy
The width of this business unit’s product mix is measured based on the number of product line that this business unit offers to the potential consumers. “IndustriHilirTehWalini” has only one product line which is product of tea as beverage consumption. The length of the product mix refers to how many item owned by the product line. In this case, the product line owned by “IndustriHilirTehWalini” consists of three major product items. There are tea bag products, loose tea products, and ready to drink tea products. The depth of product mix can be measured from the variations of lavor and packaging size. In this case, the product has seven kinds of packaging and ifteen lavor variants.
cinnamon, earl grey, vanilla lavored black tea, instant milktea, and instant lemon tea (“Industri Hilir Teh Walini”, 2014):
In the packaging, products packed in various form of packaging. The diversity of packaging aims to provide packaging options that suit the needs of consumers. The variants of packaging are (“Industri Hilir Teh Walini”, 2014):
a. Tea bag in box packaging contains of 25 tea bags
b. Tea bag in paper sachet packaging contains of 1 tea bag
c. Loose tea in box packaging contains of 100 and 200 grams of loose tea
d. Loose tea in paper pack packaging contains of 10, 50, and 100 grams of loose tea
e. Loose tea in composite can packaging contains of 30, 60, and 100 grams of loose tea
f. Ready to drink tea in PET bottle of 300 and 500 ml
g. Instant tea in box packaging contains 5 sachets of instant tea
In the guarantee of the products, as a beverage which guarantee its quality and safety, products of “TehWalini” are certified with the national and international standards. These certiications areISO 9000, ISO 9001:2000, ISO 22000, Hazard Analysis Critical Control Point (HACCP), National Agency of Drug and Food Control (“Badan POM”), Indonesian Ulema Council (“LPPOM MUI”), UTZ Certiied, and 2 Starred Certiication of Food Safety(“Industri Hilir Teh Walini”, 2014).
Price Mix Strategy
In this case, price is the amount of money that must be paid by the consumers to get the product. In March 2013, there was a raise of price due to the raise of production cost for most products. However, the pricing strategy is conducted by “Industri Hilir Teh Walini” through some approaches. There are cost approach, market competition approach, and standards in certain lines.
a. Cost Approach
The cost-based pricing is a price determination based on the considerations of the production, distribution, and selling costs plus the rate of return or the margin expected from the willingness of the business unit to take some efforts and risks while
delivering its products to the consumers in order to get some proit. Production costs considered here is the cost of production (“Industri Hilir Teh Walini”, 2014).
b. Market Competition Approach
Competition-based pricing is a price determination based on the consideration of products competition in the market. In this consideration, the price of tea products expected to be at a reasonable level that is competitive with the market leader products and other similar products (“Industri Hilir Teh Walini”, 2014).
c. Standards in Certain Lines
Determining price standard at certain lines is intended to keep the price at its reasonable limit for the consumers at the inal level of distribution lines. In this case, the price of the products at the level of distributors, agents, retailers, and consumers have been established or agreed by the marketer parties in the distribution lines.The standardof price is set with the consideration of the cost approach, market competition, and share beneits in an agreement among these marketing parties (“Industri Hilir Teh Walini”, 2014).
Promotional Mix Strategy
Promotional activities undertaken by the “Industri Hilir Teh Walini” aims to increase consumer awareness of the importance and beneits of a good quality tea consumption so there would be a positive inluence on the increase of sales. Therefore, there is an educational part in its promotional activities. The marketing communication strategy conducted as the promotion strategy is divided into two: AboveThe Line (ATL) and Below The Line (BTL) strategies (“Industri Hilir Teh Walini”, 2014).
a. Above The Line
b. Below The Line
In the promotional mix, Below The Line strategy consists of personal selling, sales promotion, and public relations. In the marketing strategy, the term Below The Line (BTL) strategy aims to touch the target market in a small number. Below The Line strategy is conducted by any activity which gives the target market an opportunity to see, touch, interact, and purchase the products. These activities include the participation of “Industri Hilir Teh Walini” in events, promos, and samplingof products to consumers in strategic places (“Industri Hilir Teh Walini”, 2014).
Place Mix Strategy
In its distribution strategy, this business unit applies direct distribution channels and selective indirect distribution channels.
a. Distributor Channel
In the distribution of products to enter the Point of Sales in some regions, this business unit cooperates with some distributors. Sometimes the distributors have sub-distributors in some regions to facilitate the distribution processin delivering products to the consumers through modern retails, traditional retails, and other industries. Distributors which cooperate with “Industri Hilir Teh Walini” at this time are “PUSKOPKAR (Pusat Koperasi Karyawan)” of “PT. Perkebunan Nusantara VIII” and “PT. Prima Adhisarana Indonesia” (“Industri Hilir Teh Walini”, 2014).
b. Direct Channel
Selling activities are also done directly from and by “Industri Hilir Teh Walini”. Direct sale is
conducted by selling products directly to modern retailers, traditional retailers, industries, special outlets, and communities by the Spreading Team.In addition, the distribution is also conducted directly through six Cafés and” Teras Walini” owned by “Industri Hilir Teh Walini”.
Inluence of Marketing Mix on Product Sales
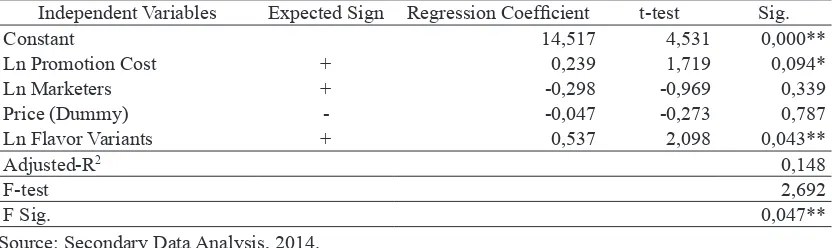
Regression analysis is conducted to determine the effect given by the application of the marketing mix strategy towards the level of product sales. In this case, the promotion mix is represented by the promotion cost variable. The place mix is represented by the number of marketers variable involved in distribution activity, which can be internal or external parties. The price mix is represented in dummy variable to differentiate the condition before and after the price raise in March 2013. The product mix is represented by the number of innovated lavor variants variable of the tea products.
The regression model indicates that the four variables of marketing mix simultaneously affect the sales. The determination coeficient shows that 14,8% variety of sales as the dependent variable can be explained by the four variables of marketing mix. The rest of 85,2% can be explained by other factors out of the model. In this model, only the promotion cost and lavor variants variables have positive signiicant inluence on sales.
Regression coefficient of promotion cost variable is 0,239. This indicates that the promotion cost variable has a positive inluence on sales value. It means, any increase in the promotion cost of 1 percent will increase 0,239 percent of the sales Table 1. Output of Regression Analysis of Factors (Applied Marketing Mix Strategy) Affecting Tea Sales
Value (January 2011– April 2014)
Independent Variables Expected Sign Regression Coeficient t-test Sig.
Constant 14,517 4,531 0,000**
Ln Promotion Cost + 0,239 1,719 0,094*
Ln Marketers + -0,298 -0,969 0,339
Price (Dummy) - -0,047 -0,273 0,787
Ln Flavor Variants + 0,537 2,098 0,043**
Adjusted-R2 0,148
F-test 2,692
F Sig. 0,047**
Source: Secondary Data Analysis, 2014. Note:
value. In this case, the more a business unit spend its expenses for its promotions activity, the more products can be sold. It indicates that this business unit spend money for the promotions activities not in vain because it is proven statistically that the promotion cost variable has a positive and signiicant impact to the products sales.
Regression coefficients of flavor variants variable is 0,537. This also indicates that the lavor variants variable has a positive inluence on sales value. It means, any increase in the lavor variants of 1 percent will increase the sales value of 0,537 percent. It is closely related to the product offer. The more this business offers lavor variants of its tea products, the more of its products are sold. A new lavor variant can attract consumers to try consuming the product. In case the consumers like the product, they will continue consuming the product.
Sales Performance of Products
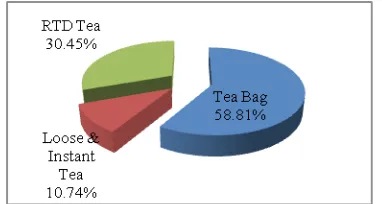
Sales Performance of Grouped Products
Various products of “Teh Walini” in the packaging, serving, and lavoring generally can be grouped into three goups: tea bag, loose and instant tea, and ready to drink products. During the year 2011 to 2013, each group of products has a quite signiicant difference of sales performance in contributing to the overall product sales which can be seen in igure 1.
Figure 1. Grouped Tea Product Sales Value Chart Source: Secondary Data Analysis, 2014
Figure 1 shows that the best sales performance in contributing towards the overall sales value is given by the sales of tea bag products which contributes by 58,81%. This indicates that the tea bag products are more popular than other products among the consumers. Statistically, the difference contribution value of product sales can be proved with a mean difference test (One Way Analysis of Variance).
Overall Analysis of Variance
The result of One Way Analysis of Variance shown in table 2 proves that the means of the monthly sales of tea bag, loose tea, and ready to drink tea products are signiicantly different.
Table 2. Output of Analysis of Variance
F Statistic Sig.
115,656 0,000
Source: Secondary Data Analysis, 2014. Note:
Different means if Sig. < α
Post Hoc Test
The result of post hoc test (Tukey HSD Test) shows that every product comparison gives a signiicant sales performance difference.
Table 3. Output of Tukey HSD Test of Aggregated Product Sales (2011-2014)
Multiple Comparisons Mean
Difference Sig. Tea Bag Loose Tea 1,841 0,000**
RTD 0,836 0,000**
Loose Tea Tea Bag -1,841 0,000**
RTD -1,005 0,000**
RTD Tea Bag -0,836 0,000**
Loose Tea 1,005 0,000**
Source: Secondary Data Analysis, 2014. Note:
** signiicant at the 95% conidence level (α=0,05) * signiicant at the 90% conidence level (α=0,1) ns not signiicant
Based on the packaging, the tea bag products can be divided into three major groups. There are Double Chamber Tea Bag packed in a box consists of 25 tea bags, Single Chamber Tea Bag packed in paper sachet (paper envelope) consists of one tea
bag, and other Single Chamber Tea Bag packed in plastic sachet consists of one or more tea bags. Figure 2 shows that sales of Double Chamber Tea Bag of 83,66% gives the best sales performance. This product is sold and distributed widely in many modern or traditional retailers so its availability is more than other products and can be easily reached by consumers.
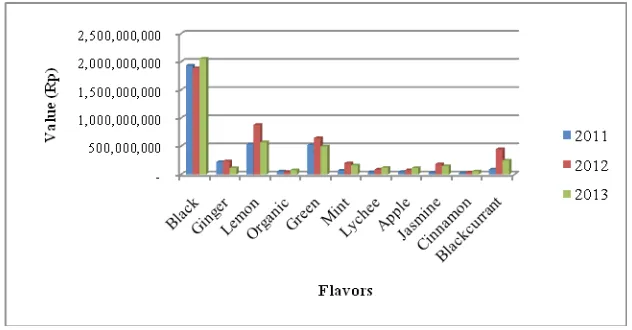
There are eleven lavor variants of Double Chamber Tea Bag product. Their sales performance can be seen in igure 3. Thisigure shows that the black tea, lemon lavored black tea, and green tea give the highest sales volume.
Forecast of Primary Products
The result of sales forecast volume in May to December 2014 shows that the monthly sales of black tea bag, green tea bag, and lemon lavored black tea bag tend to luctuate. The sales of black tea bag product which has the best sales performance
tend to be decreased in the end of year 2014. The sales of green tea bag product tend to decrease in September and then will be increasing in October and the following months in the end of 2014. The sales of lemon lavored black tea bag product tend to increase in the end of year 2014.
Business Environment
Matrix of Internal Factor Evaluation indicates that qualiied products and raw materials becomes the major strength of this business unit. On the other hand, a consideration that the brand is not well known outside West Java becomes the major weakness.
Matrix of External Factor Evaluation shows that people’s lasting habit of consuming tea as beverage becomes the major opportunity of this business unit. It indicates that there are actually a large number of people can potentially be the consumers of tea products offered by this business Figure 3. Double Chamber Tea Bag Sales Volume (2011-2013)
Source: Secondary Data Analysis, 2014
unit. Competitor product’s lower price becomes the major threat because most consumers tend to choose a more economic or cheaper product.
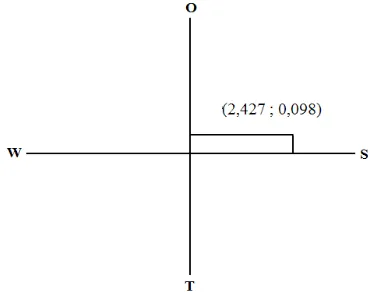
Figure 5. Position Evaluation Matrix of Business Unit Source: Primary Data Analysis, 2014
Figure 5 shows the position evaluation matrix of “Industri Hilir teh Walini” based on the scoring of internal and external factors.The position of “Industri Hilir Teh Walini” is in quadrant 1 which is a very favorable condition. In this condition,
this business unit has a great opportunity and a very good strength from its internal business environment. It results in a potential power in exploiting the opportunity. In this condition, the irst quadrant which supports the agressive strategy of the SO (Strengths-Opportunities)strategy is very considerable to be applied. Strategies suggested for this business unit are shown in igure 6.
Based on the position evaluation matrix which put this business unit in the irst quadrant, the SO (Strengths-Opportunities) strategy is very recommended. The SO strategy is a strategy of using strengths owned by the business unit to exploit available opportunities of the potential target market. In this case, the actions of SO strategy which supports the promotion expansion by emphasizing the beneits and perceived values of consuming the products to exploit the existing opportunity is very recommended.
CONCLUSIONS
1. The marketing mix strategy conducted by the business unit includes the product mix strategy, Table 4. Matrix of Internal Factor Evaluation (IFE Matrix)
Internal Factors Weight Rating Weighted Score
Strengths
Qualiied products and raw materials 0,347 4,000 1,387
Suficient inancial resource 0,347 3,500 1,214
Products certiied with international standards 0,306 3,500 1,072
Total 3,673
Weaknesses
Limited promotional scope (centered only in West Java) 0,339 1,250 0,424
Brand is not well known outside West Java 0,339 1,000 0,339
None / not maximalized research and development unit 0,321 1,500 0,482
Total 1,246
Source: Primary Data Analysis, 2014
Table 5. Matrix of External Factor Evaluation (EFE Matrix)
External Factors Weight Rating Weighted Score
Opportunity
People's lasting habit of consuming tea as beverage 1,000 3,000 3,000
Total 3,000
Threats
Technology development and innovation of the industry 0,195 2,500 0,488 Consumer's brand loyalty for other existing products 0,188 3,000 0,563
Competitor product's lower price 0,206 3,000 0,617
Possibility of a new competitor 0,206 2,750 0,566
Strict requisite nationally and internationally for consumer
good products 0,206 3,250 0,668
Total 2,902
price mix strategy, promotion mix strategy, and place mix strategy. In the product mix strategy, this business unit offers high quality of tea products in various packaging and lavoring which are certiied with national and international standards. The price determination is conducted based on cost approach, market competition approach, and standards in certain lines. The promotion mix strategy used are Above The Line and Below The Line communication strategy. The place mix strategy is conducted by distributing the products through selective distribution channel and direct channel. 2. Promotion cost and lavor variants variables of
the marketing mix strategy are proven to have positive signiicant inluence on the business unit’s sales value. It means any increase of these variable results in the increase of the sales value.
3. Grouped tea product sales of tea bag, loose and instant tea, and ready to drink tea are signiicantly different. Tea bag products give the best sales performance, followed by ready to drink products. Loose and instant tea products give the smallest sales value.
4. Forecast of black tea bag, lemon lavored black tea bag, and green tea bag sales volume in 2014 which give the best sales performance tend to be luctuated.
5. This business unit’s position is in quadrant 1 which is a very favorable condition. Thus, the SO (Strengths-Opportunities) strategy is very considerable to be applied.
REFERENCES
Arieianto, M.D. 2012. Ekonometrika: Esensi dan Aplikasi dengan Menggunakan EVIEWS. Erlangga, Jakarta.
David, F.R. 2006. Strategic Management: Concepts and Cases (Manajemen Strategis: Konsep, alihbahasa: Ichsan Setiyo Budi). Edisi ke-10 Jilid 1. Salemba Empat, Jakarta.
Gitosudarmo, I. 2012. Manajemen Pemasaran. BPFE, Yogyakarta.
Irawan. 1997. Pengantar Ekonomi Perusahaan. BPFE, Yogyakarta.
Industri Hilir Teh Walini. 2014.
Jefikins, F. 1993. Advertising. Fifth Edition. Made Simple Books, Oxford.
Strengths – S
1. Qualiied products and raw materials
2. Suficient inancial resource 3. Products certiied with
international standards
Weaknesses – W
1. Limited promotional scope (centered only in West Java) 2. Brand is not well known
outside West Java 3. None / not maximalized
research and development unit
Opportunity – O
1. People's lasting habit of consuming tea as beverage
SO Strategy
P r o m o t i o n e x p a n s i o n b y emphasizing the benefits and perceived values of consuming the products to exploit the existing opportunity.
WO Strategy
Marketing program in the form of expanding promotional area to reach the target market.
Threats – T
1 . Te c h n o l o g y d e v e l o p m e n t a n d innovation of the industry
2. Consumer's brand loyalty for other existing products
3. Competitor product's lower price 4. Possibility of a new competitor 5. Strict requisite nationally and
internationally for consumer good products
ST Strategy
Informational or educational strategy to get the target market know about the beneits of products in order to get consumer’s brand loyalty and win the competition.
WT Strategy
Developing or optimizing the function of research and development unit to explore market condition and the existing competition so that an chance to overcome the competition and other threats can be seen.
Jogiyanto. 2008. Pedoman Survei Kuesioner: Mengembangkan Kuesioner, Mengatasi Bias, dan Meningkatkan Respon. BPFE, Yogyakarta.
Kotler, P. and K.L. Keller 2009. Marketing Management (Manajemen Pemasaran, alihbahasa: Bob Sabran). Edisi ke-13 Jilid 1. Erlangga, Jakarta.
Kotler, P. and G. Armstrong 2008. Principles of Marketing (Prinsip-prinsip Pemasaran, alihbahasa: Bob Sabran). Edisi ke-12 Jilid 1. Erlangga, Jakarta.
McDaniel, C. and W.R. Darden. 1987. Marketing. Allyn and Bacon Inc., Boston.
Nawawi, H. 2012. Metode Penelitian Bidang Sosial. Gadjah Mada University Press, Yogyakarta. Rangkuti, F. 1998. Analisis SWOT: Teknik
Membedah Kasus Bisnis. Gramedia Pustaka Utama, Jakarta.
Suharyadi dan Purwanto. 2004. Statistika: Untuk Ekonomi dan Keuangan Modern. Salemba Empat, Jakarta.