84
The Impact of Marketing Mix Elements towards Purchase Intention of
Kids Shampoo Product X in Indonesia
Bram Imantaka Kusuma
International Business Management Program, Petra Christian University Jl. Siwalankerto 121-131, Surabaya
E-mail: [email protected]
ABSTRACT
Within the slow-growing baby and child hair care category, it is found that toddlers and kids shampoo is the main growth driver of the category. Responding to that, Company A launched kids
shampoo Product X in 2016. This research aims to know the effectiveness of Product X’s marketing
mix (including intrinsic product attribute, brand name, packaging, price, place, advertising, and sales promotion) in inducing purchase intention and whether the performance of those elements has met
customers’ expectation for an ideal kids shampoo.
The data were gathered through simple random sampling with questionnaire. Then, the data were processed using Multiple Linear Regression Analysis and Gap Analysis. It is found that all seven marketing mix elements impact purchase intention simultaneously. However, only intrinsic product attribute, brand name, place, and sales promotion impact purchase intention individually. Furthermore, customers’ perception on Product X’s intrinsic product attribute, place, and sales
promotion is lower than their expectation. Meanwhile, customers’ perception on Product X’s brand
name surpasses their expectation.
Keywords: Marketing Mix, Purchase Intention, Kids Shampoo, Gap Analysis
ABSTRAK
Dalam kategori perawatan rambut bayi dan anak-anak yang bertumbuh secara lambat, diketahui bahwa shampoo balita dan anak-anak merupakan penggerak pertumbuhan utama kategori ini. Menanggapi keadaan tersebut, Perusahaan A meluncurkan shampoo anak Produk X di tahun 2016. Riset ini bertujuan mengetahui efektivitas bauran pemasaran Produk X (meliputi atribut intrinsik produk, nama merek, kemasan, harga, tempat, iklan, dan promosi penjualan) dalam memengaruhi minat beli pelanggan serta mengetahui apakah kinerja bauran pemasaran Produk X tersebut sudah memenuhi harapan pelanggan untuk shampoo anak ideal.
Data untuk riset ini dikumpulkan melalui metode simple random sampling menggunakan kuesioner. Data kemudian dianalisis menggunakan Analisis Regresi Linear Berganda dan Analisis Kesenjangan. Hasil riset menunjukkan bahwa semua elemen bauran pemasaran secara simultan mempengaruhi minat beli Produk X. Namun, hanya atribut intrinsik produk, nama merek, tempat, dan promosi penjualan yang secara parsial mempengaruhi minat beli Produk X. Dapat diketahui pula bahwa kinerja atribut intrinsik produk, tempat, dan penjualan dari Produk X di bawah harapan pelanggan. Sementara itu, kinerja nama merek Produk X melebihi harapan mereka.
Kata Kunci: Bauran Pemasaran, Minat Beli, Shampoo Anak, Analisis Kesenjangan
INTRODUCTION
Baby and child care industry in Indonesia has grown significantly. The sales almost doubled from IDR 1,326.2 trillion in 2010 to IDR 2,615.3 trillion in 2015. It is mainly driven by the number of customers (i.e. parents) and the money spent per customer. High birth rate in Indonesia means more parents become potential customers, and the rising disposable income
makes parents willing to buy more expensive products for their babies (Euromonitor International, 2016).
85 while the overall industry will grow at a CAGR of 7.6% (Euromonitor International, 2016).
With this slower growth prospects compared to other categories, providers of baby and child hair care products should know the main growth driver in the category. It will help them make business decision wisely. It is found that toddlers and kids shampoo is the growing product in terms of household penetration. While the penetration of toddler and kids’ shampoo grew from 65.5% to 67.1% in 2015, the penetration of baby shampoo declined from 80.0% to 72.9% (Kantar Worldpanel, 2016). It shows that toddlers and kids shampoo holds a potential as the growth driver of the baby and child hair care category.
Aligned with the trend, Company A, a well-known multinational company, decided to launch Product X in Q4 of 2016. The main target market is mothers with girls aged 3-7 years old. Product X is Company A’s only product aimed for kids until above 5 years old, since Company A has mainly focused on younger babies (Company A, 2016).
As Product X is new, Company A has to shape the offerings by setting the right product and pricing strategy, deliver the values through various distribution channels, and communicate the values through the integrated marketing communications (Kotler & Keller, 2016). All those aspects are covered in the
“marketing mix” concept, which was introduced by
McCarthy in 1964 (in Chai, 2009, p.2). Conceptually, marketing mix is a group of marketing stimuli aiming
to fulfill customers’ needs and connect with the
customers. It is controllable, so marketers must find the right mix to induce consumer purchase intention (Kotler & Armstrong, 2014).
Two variables of marketing mix actually have big categorization within. The first one is product. According to Kotler and Armstrong (2014), product includes attribute, brand name, packaging, labeling, and product support. Meanwhile, Olson and Jacoby (1972, in Wang and Yu, 2016, p. 2964) explain that product can be evaluated based on intrinsic and extrinsic attributes. Intrinsic attribute refers to the main physical product attribute, like fragrance; while extrinsic attribute is the supplementary attribute, such as packaging and brand. Combining both theories, the researcher uses three dimensions for product, namely intrinsic product attribute, brand name, and packaging. Labeling is included in packaging, while product support is not relevant with Product X.
The second variable is promotion. According to Kotler and Keller (2016), there are eight promotional tools, namely advertising, sales promotion, events and experiences, public relations and publicity, online and social media marketing, mobile marketing, direct and database marketing, and personal selling. However, a company will not use all eight. Every company has to decide on the best promotion mix according to its budget (Kotler & Keller, 2016). In this case, until April 2017, Company A nationally supports Product X using
advertising and sales promotion as the promotion tools.
For advertising, Company A puts Product X’s
commercial video on television, YouTube, and Facebook; while it uses price discount, digital photo contest, and point-of-purchase display as the sales promotion (Company A, 2016).
To this date, researches on the impact of marketing mix to purchase intention have been generally done in two ways. First, all the marketing mix variables become independent variables like in the research of Susanto, Natalia, and Siaputra (2016). They find that product, price, place, and promotion simultaneously affect purchase intention of budget hotel room rent. However, only product, price, and promotion individually affects purchase intention. Second, some detailed elements of marketing mix are used as the independent variables like in the research of Bachriansyah (2011). It is found that product quality, advertising, and price simultaneously and individually affect purchase intention of Nokia phone. In this research, all the possible detailed elements of marketing mix variables are used. The researcher wants to know if intrinsic product attribute, brand name, packaging, price, place, advertising, and sales promotion impact purchase intention – simultaneously as marketing mix and individually.
After knowing the significant factors, the
researcher is keen to know if Company A’s
performance perceived by the customers on those
factors have met customers’ expectation of ideal kids
shampoo. It is a modification of the gap model of Parasuraman, Zeithaml, and Berry (1985, in Blesic, Ivkov-Dzigurski, Stankov, Krovic, & Bradic, 2011, p.6). Consumer gap exists due to the discrepancy
between consumers’ expectation and perceived
product performance. In this case, expectation means the expected ideal product of the category. As Product X is new in its category, it will be insightful for
Company A to identify the aspects of Product X’s
marketing mix that need improvement to be the ideal product in the category. By being the ideal product,
many more people would likely become Product X’s
consumers, making it the market leader in Indonesia. In conclusion, there are three research objectives. First, the researcher wants to know if intrinsic product attribute, brand name, packaging, price, place, advertising, and sales promotion impact purchase intention simultaneously. Second, the researcher wants to know if those seven independent variables impact purchase intention individually. Lastly, the researcher wants to know if there is a gap between consumers’ expectation and perceived performance on the significant factors.
LITERATURE REVIEW
86 Marketing Mix
Marketing mix is “a set of marketing tools that
work together to satisfy customer needs and build
customer relationships” (Kotler & Armstrong, 2014, p. 27). This concept was introduced in 1964 by McCarthy to help put marketing strategy into action (in Chai, 2009, p.2). Furthermore, McCarthy (1964) suggests that marketing mix consists of 4Ps; product, price, place, and promotion (in Kotler & Keller, 2016, p.47). The significance of this 4Ps marketing mix has been tested in studies such as in Coviello, Brodie, and Munro (2000). They find that 4Ps marketing mix is relevant for organizations to build relationships with customers and to challenge bigger corporations. Not only that, it allows marketers to allocate resources accordingly (Low & Tan, 1995 in Chai, 2009, p.2). Intrinsic Product Attribute
Intrinsic product attribute is a product’s physical aspects that give benefits to the customers (Kotler & Armstrong, 2014). Meanwhile, Wang and Yu (2016) suggest that intrinsic product attribute is aspects used
to measure product’s functionality and performance.
From the two definitions, it is concluded that intrinsic product attribute refers to aspects leading customers to experience the benefit sought from a product.
Lonial and Zaim (2000) find twelve significant product attributes for adult shampoo, but only four are relevant to Product X as kids shampoo based on the value proposed. Those four attributes are provide brightness, soften hair, provide fragrance, and vitamins (Company A, 2016).
Brand Name
Brand is name, term, design, symbol, and any
other features that identify one seller’s product as
distinct from that of competitors (American Marketing Association, 2015). In product decisions, marketers are faced with an option to use the parent brand name for all its products (Kotler & Keller, 2016). In the case of Company A, all its baby products are branded under the same brand (Company A, 2015). When a common brand name is used, marketers should ensure that the brand name is memorable, well-known, and creates positive brand image (Aaker, 1996; Wang & Yu, 2016). In the end, a good brand name should lead to a
higher customers’ intention to purchase the product (Shrum, Lowrey, Luna, Lerman, & Liu, 2012). Packaging
Packaging is the outer part that wraps the product and helps the product function (Kotler & Keller, 2016; Kotler & Armstrong, 2014). For evaluating the main packaging to consumers, Smith (2006, in Ahmad, Mohib, & Lakhan, 2012, p.5) proposes six indicators, namely form, size, color, material, graphics, and flavor. However, only five are used since flavor is irrelevant to Product X.
Price
Price is the value given up by the customers to experience product benefits (Kotler & Armstrong, 2014). Customers perceive price differently from one another, based on their individual situation (Prabowo, 2016). Furthermore, according to Bachriansyah (2011) and Wardani (2015), customers also perceive price based on their relative evaluation of competitors’ price.
In conclusion, price has three characteristics. It is a value to get products’ benefit, it is perceived as affordable relatively to each customer, and it can be
perceived based on competitors’ price. Those
characteristics will be the indicators of price in this research, the same as in Bachriansyah (2011) and Wardani (2015).
Place/Distribution
Place means distribution channel, or how the
company makes “a product or service available for use or consumption by the consumer” (Kotler & Armstrong, 2014, p. 363). The objective of distribution strategy is to grab more attention from the customers with its easy-to-get image (Tjiptono and Chandra, 2005 in Fadhilah, 2013, p.41). They also stress that the final outcome is consumer’s buying intention.
According to Swastha (2003, in Fadhilah, 2013, p.61), there are three indicators for customers to evaluate distribution effectiveness for manufactured products. Those indicators are number of stores, reachability of the stores, and stock level.
Advertising
Advertising is a paid form of mass promotion of product by a company aimed to communicate both functional and emotional values of products to the customers (Kotler & Keller, 2016; de Chernatony, 2010, in Buil, de Chernatony, & Martinez, 2013, p. 117). In this context, Company A uses commercial video on television, Facebook, and Youtube as the advertising of Product X (Company A, 2016).
Siddiqui (2014) proposes six indicators to
evaluate customers’ perception of advertising in the
form of commercial video, namely product quality, product availability information, content credibility, advertising repetition, advertising appeals, and endorser. Those indicators will also be used in this research – except endorser, as it is irrelevant with Product X (Company A, 2016).
Sales Promotion
Sales promotion is short-term incentive tool to attract purchases (Kotler & Keller, 2016). According to Alvarez and Casielles (2005), it is a special offer to induce direct behavior. In other words, sales promotion
affects customers’ direct purchase intention due to its short-term nature (Alvarez & Casielles, 2005).
87 awards, free trials, product warranties, tie-in promotions, cross promotions, and point-of purchase display. In addition, according Darke and Chung (2005), temporary price discount is also a sales promotion tool. Relating back to Product X, Company A uses price discount, contest, and point-of purchase display as its sales promotion (Company A, 2016). Purchase Intention
Purchase intention is consumers’ desire to
purchase a product (Kotler & Keller, 2016). The scholars point out that purchase intention is formed when the customers choose the preferred brand in the category based on their evaluation on the marketing mix. Intention itself is defined as a person’s motivation to show an effort to do something (Eagly & Chaiken, 1993, in Spears & Singh, 2004, p.56). This effort can be shown in how someone wants to find more information about the products (Purba, 2012). In conclusion, purchase intention is a consumer’s desire to purchase his/her preferred product in the category, shown in how he/she is motivated to exert some effort to turn that intention into a real action. From that definition, three indicators are used to measure purchase intention, which are desire, preference, and effort.
Purchase intention is highly influential towards actual purchase behavior (Ajzen, 1991 in Soenyoto, 2015, p.102). Every purchase behavior is preceded by intention to buy, which is a result of customers’
evaluation on a product’s marketing mix (Pramono,
2012). In other words, purchase intention is the most preferred outcome for companies to analyze whether their marketing mix – which is under their control – is effective or not (Kotler & Keller, 2016).
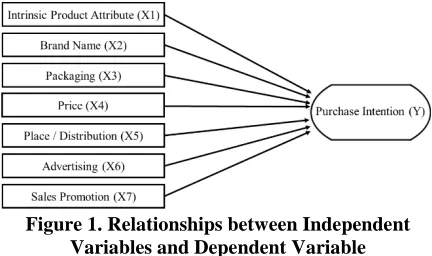
Figure 1. Relationships between Independent Variables and Dependent Variable
There are eight relationships between variables that need to be examined. The first one is the relationship between marketing mix and purchase intention. According to Kotler and Keller (2016), marketing mix is an external stimuli affecting
customers’ purchase intention. Customer evaluates a product’s marketing mix, and that evaluation becomes the base of his/her interest in buying the product. Empirically, Susanto, Natalia, and Siaputra (2016) find that marketing mix variables simultaneously affect purchase intention of a budget hotel room.
The second one is the relationship between intrinsic product attribute and purchase intention. When a customer perceives the intrinsic product attribute as beneficial for them, they will be interested to buy it (Wang & Yu, 2016). For example, in the research by Kolopita and Soegoto (2015), it is found that when a customer perceives that a car has a good attribute such as quality, he/she would be more intended to buy the product.
The third one is the relationship between brand name and purchase intention. A brand that is easy to
remember affects customers’ choice since they feel
more aware of and related with the brand (Adamu & Bambale, 2016). When a customer thinks that the brand is renowned, they perceive the brand has a good reputation, thus their purchase intention increases (Shrum, Lowrey, Luna, Lerman, & Liu, 2012). Lastly, a brand name represents a certain brand image the customers have in their mind. A positive brand image will make customers want to buy the product since they believe it has a good quality (Kotler & Armstrong, 2014).
The fourth one is the relationship between packaging and purchase intention. Packaging should serve both functional and visual purposes in attracting buyers to the product (Farooq, Habib, & Aslam, 2015). For example, when customers like the visual of the packaging as the first thing they see from the product, their buying intention will increase (Deliya & Parmar, 2012). It has been proven in a research by Larissa (2016). She found that when a customer judges the packaging of a cup noodle as good based on its design, color, shape, size, and material; the customers will want to buy the product more.
The fifth one is the relationship between price and purchase intention. When a customer perceives a price as right for them, their interest in buying the product will grow (Kotler and Armstrong, 2008 in Prabowo, 2016, p.41). It has been proven empirically, such as in the research by Kolopita and Soegoto (2015). They find that when a customer perceives that the price of a car matches his/her ability, matches the benefit gained, and is competitive in the market, their intention to buy the product will increase.
The sixth one is the relationship between place/distribution and purchase intention. When a company strategizes its distribution effectively to grab more attention through easy-to-get image, people will be more interested in buying the product (Tjiptono and Chandra, 2005 in Fadhilah, 2013, p.41). It has been proven in a research by Kawuriyan (2009) in laptop industry. He finds that when a company makes its distribution effective so customers can get its product
easily, customers’ buying intention increases.
88 having good value, making the customers want to buy it. It has also been found empirically that advertising
effectiveness affects customers’ purchase intention,
such as in the research of Siddiqui (2014) for a packaged milk product. For example, featuring product quality information in advertisement is important in increasing purchase intention.
The eight one is the relationship between sales promotion and purchase intention. From the definition, it is clear that sales promotion attracts consumer’s intention to buy immediately (Kotler & Keller, 2016). Furthermore, Rizwan, Irshad, Ali, Nadir, and Ejaz (2013) find in their research that sales promotion induces purchase intention of a product that a customer does not initially intend to buy. For example, price
discount can increase customers’ purchase intention of
a product, because they find it cheaper to get it. After knowing the relationship of variables, the following nine hypotheses are developed:
H1: Intrinsic product attribute, packaging, brand name, price, place, advertising, and sales promotion impact purchase intention simultaneously. H2: Intrinsic product attribute impacts purchase
intention.
H3: Brand name impacts purchase intention. H4: Packaging impacts purchase intention. H5: Price impacts purchase intention. H6: Place impacts purchase intention. H7: Advertising impacts purchase intention. H8: Sales promotion impacts purchase intention. H9: There is a difference between consumers’
expectation of the ideal condition and perceived performance for the significant factors.
RESEARCH DESIGN
In this chapter, the researcher will explain the research design, starting from foundations of the research, description of variables, description of data, and methods of data analysis.
This research is done with the assumption that the researcher is a positivist. A positivist is someone with an objectivistic ontological view – where truth is external to the researcher. A positivist also has the traits
of a ‘resources’ researcher, where the researcher observe and analyze the facts to answer the research questions (Saunders, Lewis, & Thornhill, 2009; Bryman, 2012).
As a positivist, the researcher will conduct a quantitative research. It involves the collection of quantifiable data and statistical treatment to test the hypotheses (Creswell, 2003). He suggests that quantitative research can be done through experiment or survey. In this research, survey is used where
information about people’s knowledge, attitude, and
behavior is collected (Sekaran & Bougie, 2016). Furthermore, according to Sekaran and Bougie (2016), there are three types of data collection method
for survey, namely interview, questionnaire, and observation. The researcher uses self-administered questionnaire method with a prepared set of questions the respondents answer by themselves (Sekaran & Bougie, 2016).
Description of Variables
There are two types of variables in this research namely independent variable (intrinsic product attribute, brand name, packaging, price, place, advertising, and sales promotion) and dependent variable (purchase intention). The operationalization of each variable is listed below, with E referring to expectation and P for performance.
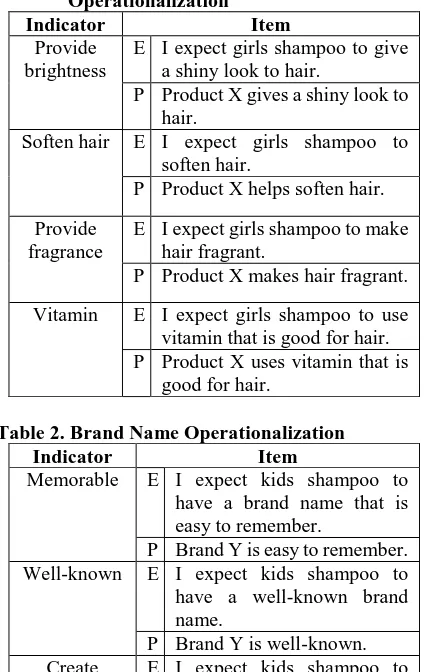
Table 1. Intrinsic Product Attribute Operationalization
Indicator Item Provide
brightness
E I expect girls shampoo to give a shiny look to hair.
P Product X gives a shiny look to hair.
Soften hair E I expect girls shampoo to soften hair.
P Product X helps soften hair. Provide
fragrance
E I expect girls shampoo to make hair fragrant.
P Product X makes hair fragrant. Vitamin E I expect girls shampoo to use
vitamin that is good for hair. P Product X uses vitamin that is
good for hair.
Table 2. Brand Name Operationalization Indicator Item
Memorable E I expect kids shampoo to have a brand name that is easy to remember.
P Brand Y is easy to remember. Well-known E I expect kids shampoo to have a well-known brand name.
P Brand Y is well-known. Create
positive brand image
E I expect kids shampoo to have a brand name that has a positive brand image. P Brand Y has a positive brand
image.
Table 3. Packaging Operationalization Indicator Item
Form E I expect kids shampoo’s bottle to have a shape that makes it easy to use.
89 Size E I expect kids shampoo to have
several bottle sizes that fit my needs.
P Product X’s bottle sizes fit my needs.
Color E I expect kids shampoo’s bottle color to be attractive.
P Product X’s bottle color is attractive.
Material E I expect kids shampoo’s bottle to be made of high-quality material.
P Product X’s bottle is made of high-quality material.
Graphics E I expect kids shampoo’s bottle
label to provide product’s
complete description.
P Product X’s bottle label provides complete description of product.
Table 4. Price Operationalization Indicator Item Worthiness
compared to benefits
E I expect kids shampoo’s price to be worth the same as the
E I expect kids shampoo’s price to be competitive.
P Product X’s price is
competitive. Table 5. Place Operationalization
Indicator Item Number
of stores
E I expect kids shampoo to be sold in many stores.
P Product X can be found in a lot of stock in-store.
P Product X’s stock in stores is a lot in general.
Table 6. Advertising Effectiveness Operationalization
Indicator Item Product
quality
E I expect kids shampoo’s
advertising to feature product quality information
shows that it can be easily got in stores.
Content credibility
E I expect kids shampoo to have a credible advertising message.
advertising more than once a day.
Advertising appeals
E I expect kids shampoo’s
advertising to be attractive. P Product X’s advertising is
attractive.
Table 7. Sales Promotion Operationalization
Tool Item
Table 8. Purchase Intention Operationalization Indicator Item
Preference I prefer Product X as the shampoo for my girl.
Interest I am interested in buying Product X. Effort I am willing to look for information
about Product X.
90 Table 9. However, the researcher cannot find the number of population due to the unavailability of data. Table 9. Population Criteria
Criteria Reason Have ever bought
Product X
To ensure respondent can answer questions on price and place
Have ever used Product X for her daughter
To ensure respondent can answer questions on intrinsic product attribute
Have ever watched
Product X’s
advertisement
To ensure respondent can answer questions on advertisement
Know Product X’s
sales promotion tools (discount, contest, and in-store display)
To ensure respondent can answer questions on sales promotion
The next step is to determine the sample frame,
which is the “listing of all units in the population from which the sample will be selected” (Bryman, 2012, p. 187). It is usually in the form of database (Bryman, 2012). In this research, since the number of population is difficult to know, the list of people in the population is also not available.
Third, the researcher should determine the sampling procedure. The researcher uses simple random sampling technique. Sample will be taken based on people who join the digital photo contest since the researcher has access to the data of the participants. Nevertheless, as explained before, there will be some screening questions to ensure that they fulfill all the population criteria. This method is categorized as simple random sampling since all units that meet the population criteria can be chosen as sample (Sekaran & Bougie, 2016).
Then, it is important to determine the sample size. Many aspects need to be considered; namely confidence, margin of error, population size, and statistical techniques (Saunders, Lewis, & Thornhill, 2009). Here, since the population size is unknown, determining the sample size is based on the statistical technique. For examining multiple correlations, Green (1991) states that the formula is:
n > 50 + 8m
where n is sample size and m is number of independent variables. Since this research has seven independent variables, the sample size should be bigger than 106.
Furthermore, each question in the questionnaire can be classified based on its type of data and data scaling methods. For the screening questions, they are all nominal data using dichotomous rating scale method. For the main questions, they are all interval data using 5-point Likert scale.
The analytical methods used in this research are piloting, validity and reliability test, as well as multiple linear regression analysis and gap analysis using paired sample t-test. Multiple linear regression analysis will be used to know the simultaneous and individual effect, while gap analysis using paired sample t-test will be
used to know if there is difference between customers’
expectation and perceived performance for the significant factors. The significance level for relevant tests is 5%, an acceptable level for social research (Bryman, 2012).
Piloting is preliminary test of the questionnaire for improving its quality before distributed to the respondents (Saunders, Lewis, & Thornhill, 2009). The researcher first asked marketing experts to review the questionnaire before the pilot study, as suggested by Saunders, Lewis, and Thornhill (2009). From the review and the piloting, some questions on packaging, place, and purchase intention were improved.
After gathering the data from the final questionnaire, it is important to check the validity and reliability to ensure the variables have accurate and consistent measurement items (Sekaran & Bougie, 2016). The test procedure for validity and reliability is in Table 10 below.
Table 10. Validity and Reliability Tests Test Decision Criteria
Validity The item on the instrument is valid if the r-value of the item in the Corrected Item-Total Correlation
column of the output of Cronbach’s
Alpha test is higher than the benchmark r-value. The benchmark r-value is gained from the r-table for the degree of freedom (df) = n-2, where n is sample size.
Reliability The element has reliable indicators
if the Cronbach’s Alpha ≥ 0.7.
Source: Adopted from Ghozali (2013); Sekaran & Bougie (2016)
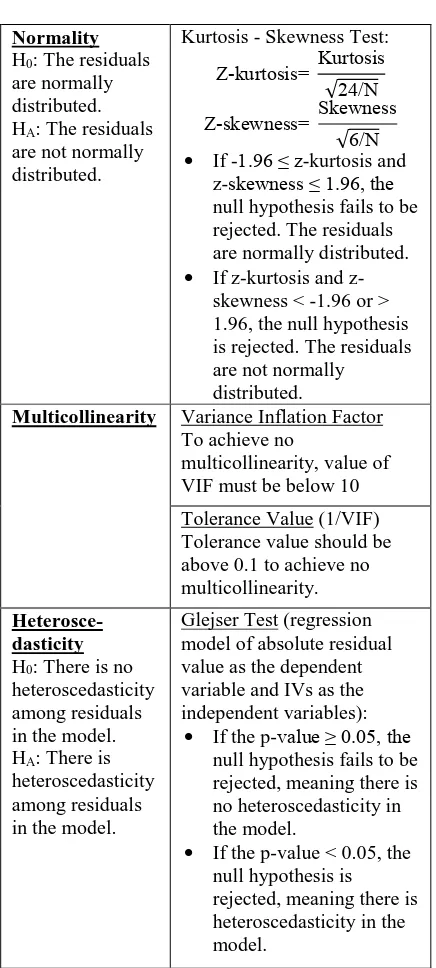
After passing the validity and reliability tests, the researcher should do classical assumption testing for the data before going to the multiple linear regression analysis. There are four classical assumptions tests for regression analysis; namely normality, autocorrelation, multicollinearity, and heteroscedasticity. However, in this research, autocorrelation is not needed since it aims to test whether a correlation between the residual on period t and t-1 exists (Ghozali, 2013), while the data of this research are not time-series data.
91
Kurtosis - Skewness Test:
Z-kurtosis= Kurtosis null hypothesis fails to be rejected. The residuals are normally distributed. If kurtosis and
z-skewness < -1.96 or > 1.96, the null hypothesis is rejected. The residuals are not normally distributed.
Multicollinearity Variance Inflation Factor To achieve no
multicollinearity, value of VIF must be below 10 Tolerance Value (1/VIF) Tolerance value should be above 0.1 to achieve no multicollinearity. model of absolute residual value as the dependent variable and IVs as the independent variables):
If the p-value ≥ 0.05, the null hypothesis fails to be rejected, meaning there is no heteroscedasticity in the model.
If the p-value < 0.05, the null hypothesis is rejected, meaning there is heteroscedasticity in the model.
Source: Adopted from Cooper and Schindler (2014); Ghozali (2013); Lind, Marchal, and Wathen (2014)
After passing the classical assumptions tests, the data can be processed for multiple linear regression analysis. It is the analysis of knowing the impact of two or more independent variables on a dependent variable (Saunders, Lewis, & Thornhill, 2009). The accuracy of regression model is judged from the goodness of fit, which is seen from the Adjusted R-square as well as the result of F-test and t-test (Ghozali, 2013). The explanation is in Table 12.
Table 12. Goodness of Fit for Regression Analysis Test Decision Criteria
Adjusted
The value will always be between 0 and 1. The higher the number, the better.
F-Test
null hypothesis fails to be rejected, meaning the independent variables do not impact the dependent variable simultaneously. null hypothesis fails to be rejected, meaning the particular independent variable does not impact the dependent variable.
Source: Adopted from Ghozali (2013); Lind, Marchal, and Wathen (2014)
After knowing the significant factors, the researcher can do gap analysis for testing the difference between expectation and performance. Paired sample t-test is used. It is a test to check if there is significant difference in the mean of two related samples (Ghozali, 2013). The criteria is listed in Table 13.
Table 13. Criteria for Paired Sample t-test Hypotheses Decision Criteria
H0: �i = 0 HA: �i ≠ 0
If the p-value ≥ 0.05, there is no significant difference between the two samples. If the p-value < 0.05, there is
a significant difference between the two samples. Source: Adopted from Ghozali (2013)
92 The research questionnaire was distributed through the Internet. Out of 440 people reached, 126 people give responses, and only 109 pass all the screening questions. It surpasses the minimum sample size of 107. They were then processed further.
First, validity and reliability test are done. For the validity test, all items in all variables have corrected item-total correlation above the benchmark r-value of 0.1882 (with 0.05 significance for degree of freedom of 107) (Ghozali, 2013). Thus, all variables have accurate measurement indicators. For the reliability, all
variables have Cronbach’s Alpha above 0.7, meaning
all variables have consistent measurement indicators (Ghozali, 2013).
The next step is the classical assumptions test. First, for normality, the researcher uses Kurtosis-Skewness test. It is found that the value of Z-kurtosis is -0.607, while the value of Z-skewness is -0.627. Both values are bigger than -1.96 and below 1.96. The null hypothesis fails to be rejected, meaning the residuals are normally distributed. Second, for multicollinearity, it is found that all independent variables have VIF below 10 and tolerance value above 0.1, meaning that there is no multicollinearity between independent variables. Lastly, for heteroscedasticity, the researcher uses Glejser test. It is found that all independent variables have significance above 0.05. The null hypothesis fails to be rejected, meaning there is no heteroscedasticity among residuals in the model.
After passing the classical assumptions test, the multiple linear regression analysis can be done. The goodness of fit will be judged based on the adjusted R-square and the result of F-test and t-test.
Table 14. Model Summary
Model R R Square
Adjusted R Square
Std. Error of the Estimate
1 .838 .703 .682 .25687709
First, from the adjusted R-square, it is seen that 68.2% of the variance in purchase intention of Product X is explained by intrinsic product attribute, brand name, packaging, price, place, advertising, and sales promotion. The rest 31.8% is explained by other factors not covered in this research.
Table 15. ANOVA Table
Model
Sum of Squares df
Mean
Square F Sig. 1
Regre-ssion 15.741 7 2.249 34.1 .000
Resi-dual 6.665 101 .066 Total 22.406 108
Next, based on the F-test result, it is seen that the significance value is 0.000, which is below 0.05. It means the null hypothesis is rejected and the alternate
hypothesis is accepted. Intrinsic product attribute, brand name, packaging, price, place, advertising, and sales promotion simultaneously impact purchase intention. This result is in accordance with the research result of Susanto, Natalia, and Siaputra (2016) where marketing mix variables simultaneously affect purchase intention of a budget hotel room. It is based on the logic by Kotler and Keller (2016) that
customers’ evaluation of a product’s marketing mix
determines whether they are interested to buy it. Here,
customers’ perception of Product X’s marketing mix variables affect their buying intention. If the customers
think that the performance of Product X’s marketing
mix variables is good, they will be more interested to buy the product.
Table 16. Coefficient Matrix of Independent Variables
Model
Unstandardized Coefficients
t Sig. B
Std. Error
1 (Constant) -.266 .310 -.857 .394 IPAAVG .363 .074 4.905 .000
BNAVG .159 .065 2.428 .017
PAVG .069 .072 .947 .346
PRAVG -.062 .059 -1.043 .299
PLAVG .138 .049 2.805 .006
AAVG .057 .067 .856 .394
SPAVG .312 .064 4.895 .000
Table 16 summarizes the result of t-test, which will be discussed one by one. For intrinsic product attribute, the significance is below 0.05 and the coefficient is 0.363, meaning that intrinsic product attribute positively affects purchase intention. This result is in accordance with Kolopita and Soegoto (2015) where intrinsic product attribute of a car significantly impacts customers’ purchase intention. For Product X, intrinsic product attribute is a significant factor of purchase intention because the attributes provided are the attributes sought by Indonesian mothers. Agency I (2016) finds that Indonesian mothers are very concerned with the
cosmetic function of kids’ personal care, such as whether it makes their child smell good (Agency I, 2016). Product X’s proposition of making hair shiny,
soft, and fragrant is aligned with Indonesian mothers’
concern (Company A, 2016). Therefore, when customers perceive the attributes positively, their purchase intention will increase.
93 accordance with the research result of Mirabi, Akbariyeh, and Tahmasebifard (2015) where brand name impacts the purchase intention of tile in Tehran. In the case of Product X, its brand is a renowned brand (Company A, 2015). Most Indonesian mothers perceive it as the best expert of baby care with premium quality (Agency M, 2015). This brand name is proven to be a powerful asset to use on a product for kids above 5 years old (Company A, 2016). The more positively
the customers perceive Product X’s brand, the more
they want to buy Product X.
For packaging, the significance is above 0.05, meaning that packaging does not affect purchase intention. This result is in accordance with the research result of Mirabi, Akbariyeh, and Tahmasebifard (2015) where packaging does not impact the purchase intention of tile in Tehran. In the case of Product X, packaging does not affect purchase intention, as the
research on overall Product X’s brand by Agency M (2015) suggests. It finds that packaging is not essential in affecting in-store purchase intention of overall
Product X’s brand. When consumers shop for the brand, they tend to consider the promotions and product availability. Therefore, for Product X, which is a part of its brand, the same condition happens. When consumers are browsing Product X in-store, they do not evaluate the packaging, but rather on its availability and in-store promotions.
For price, the significance is above 0.05, meaning that price does not affect purchase intention. This result is in accordance with the research result of Andoko and Devina (2015) for a guest house nightly room rent in Surabaya. In terms of Product X, price does not affect purchase intention because of the nature of Indonesian baby and kids care category. When parents buy for their baby, they are willing to spend extra money for better products (Euromonitor International, 2016). Relating to Product X, as explained before, its brand is deemed premium in quality. This brand perception seems to also apply to Product X. The fact that Product X is indeed priced around 1.5 times of a similar product by another brand (Company A, 2017) does not affect consumers’ purchase intention. They are willing to spend more money for better products.
For place/distribution, it is seen that the significance is below 0.05 and the coefficient is 0.138, meaning that place positively affects purchase intention. This finding is in accordance with the research result of Kawuriyan (2009) in laptop industry. For Product X, this research result is aligned with the research result of Agency M (2015). It finds that in the baby and kids care industry, availability is critical in driving purchase intention in the stores. For example, another brand bought additional spots for placement in many accounts so their products dominated the baby care area. This superior availability perceived by consumers drove them to try this brand, as suggested by its increase in sales (Agency M, 2015). Therefore, place is indeed an important factor of purchase
intention in the baby and kids care industry. Relating it to Product X, which is a kids product, paying attention to the distribution is critical to influence customers’ purchase intention.
For advertising, it is seen that the significance is above 0.05, meaning that advertising does not affect purchase intention. This result is in accordance with the research result of Putri (2016) for a packaged coffee product in Yogyakarta. For Product X, advertising does not impact purchase intention because of the nature of integrated marketing communications in the baby and kids care category. According to a research by Agency M (2015), out of several marketing communication tools available, advertising is only effective in creating product awareness through its wide reach. It is not effective in driving purchase intention because the mothers are not engaged when watching advertising. There are other tools with the role of inducing purchase
intention, like contests. Thus, Product X’s advertisement only creates awareness. Customers’ evaluation on Product X’s advertising effectiveness
does not affect their purchase intention.
For sales promotion, it is seen that the significance is below 0.05 and the coefficient is 0.312, meaning that sales promotion positively affects purchase intention. The result of this research is in accordance with the research result of Rizwan, Irshad, Ali, Nadir, and Ejaz (2013) where it is found that sales promotion tools can increase the purchase intention in general. In Product X’s case, the research result is aligned with the findings of Agency M (2015). Baby and kids care category is very sales promotion driven. Brands compete through sales promotion, where for example one brand is very good at contests and another dominates in-store display. Therefore, for Product X as a kids care product, sales promotion is very influential to purchase intention. When customers view the sales promotional tools positively, their purchase intention will also increase because they feel at benefit from the incentive.
In conclusion, only four independent variables affect purchase intention, which are intrinsic product attribute, brand name, place, and sales promotion. Furthermore, when ranked based on its coefficient, it is seen that intrinsic product attribute is the most significant factor, followed by sales promotion, brand name, and lastly place.
After knowing the significant factors, the gap analysis using paired sample t-test can be done to know
if there is a gap between customers’ expectation (E)
and their perception of Product X’s performance (P). For this matter, H9 is broken down into:
H9a: There is a difference between consumers’ expectation of the ideal condition and perceived performance of intrinsic product attribute. H9b: There is a difference between consumers’
94 H9c: There is a difference between consumers’
expectation of the ideal condition and perceived performance of brand name.
H9d: There is a difference between consumers’ expectation of the ideal condition and perceived performance of place.
Table 17 summarizes the significance of the test. Table 17. Summary of Significance for the Gap
Analysis Independent Variable
Significance Mean E Mean P
Intrinsic Product Attribute
0.000 4.60 4.25
Sales Promotion
0.000 4.35 4.04
Brand Name 0.014 4.24 4.38
Place 0.000 4.34 3.89
First, for intrinsic product attribute, there is a significant difference between expectation and perceived performance. Generally, the performance (4.25) has not met the expectation (4.60). When looked per indicator as seen in Figure 2, Product X’s
performance is aligned with customers’ expectation in
terms of the priority. Company A focuses the most on the indicator that is most important to customers, where providing fragrance is the most important indicator and providing brightness is the least important one.
However, the customers believe that Product X’s
performance in all indicators of intrinsic product attribute has not met their expectations to be the ideal product in the category.
Figure 2. Score of Intrinsic Product Attribute Indicators
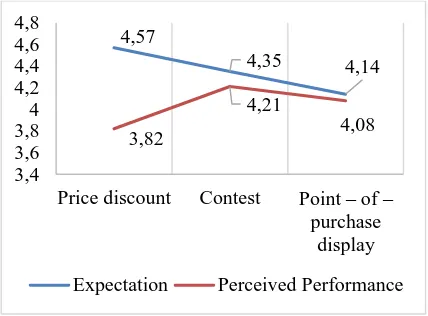
Second, for sales promotion, there is a significant difference between expectation and perceived performance. Generally, the performance (4.04) has not met the expectation (4.35). When looked per tool as seen in Figure 3, customers believe that the attractiveness of price discount tool is the most
important to them. However, customers’ perception on Product X’s price discount performance is the lowest.
It might happen because of some reasons, such as the discount value being low compared to a competing product (Company A, 2017). Next, customers believe that contest attractiveness is the second most important to them, while they perceive it as the best-performing sales promotion tool of Product X. Nevertheless,
customers believe that the performance of Product X’s
contest still has not met their expectation. It might be attributed to the fact that Company A uses a standard photo competition mechanism, which may be boring for the customers (Company A, 2016). Lastly,
customers believe that the performance of Product X’s
point-of-purchase display can still be improved to meet their expectation for an ideal kids shampoo. The slight gap means Company A could add more eye-catching point-of-purchase display (Company A, 2016).
Figure 3. Score of Sales Promotion Tools
Third, for brand name, there is a significant difference between expectation and perceived performance. Generally, the performance (4.38) has surpassed the expectation (4.24). When looked per indicator as seen in Figure 4, Product X’s brand name has surpassed the expectation of the ideal kids shampoo in being memorable and well-known, but not in creating a positive brand image. However, this indicator is actually the most important factor of brand name for the customers. This slight gap might be attributed to a recent health issue on another product
under Product X’s brand which might affect the overall brand image.
4,75
4,61 4,56
4,47
4,34 4,34 4,29
4,03 3,6
3,8 4 4,2 4,4 4,6 4,8 5
Provide fragrance
Vitamins Soften hair Provide brightness Expectation Perceived Performance
4,57
4,35 4,14
3,82
4,21
4,08 3,4
3,6 3,8 4 4,2 4,4 4,6 4,8
Price discount Contest Point –of – purchase
95 Figure 4. Score of Brand Name Indicators
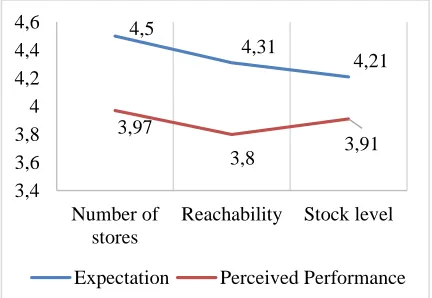
Lastly, for place, there is a significant difference between expectation and perceived performance. Generally, the performance (3.89) has not met the expectation (4.34). When looked per indicator as seen in Figure 5, customer believes that number of stores is
the most important aspect, and Product X’s
performance is also the best on this indicator. However, the gap is big, indicating that Product X is still far from expectation. Furthermore, customers believe that reachability is the second most important factor, but it is the least performing factor of Product X. The gap is also big in this indicator. The result of these two indicators makes sense considering the fact that until April 2017, Product X was not available in Alfamart (Company A, n.d.). Since Alfamart has a lot of stores with most of them in residential areas (Agency M, 2015), the unavailability of Product X
there affects customers’ perception of Product X’s
number of stores and reachability. Lastly, stock level is considered the least important factor of place. Nevertheless, there is also a big gap between expectation and performance, meaning Product X still
has not met customers’ expectation of stock level.
Figure 5. Score of Place Indicators
CONCLUSION
The background of the industry and the category leads to the rationale why Company A launched Product X. The researcher was keen to know about the
performance of Product X’s marketing mix elements.
Three research objectives were laid out and nine hypotheses were developed. 109 data were gathered and were then processed statistically using multiple linear regression analysis and gap analysis.
The adjusted R-square indicates that 68.2% of the variability in purchase intention is explained by intrinsic product attributes, brand name, packaging, price, place, advertising, and sales promotion. The F-test indicates that the marketing mix elements impact purchase intention simultaneously. H1 is accepted and the first research objective is achieved. The t-test indicates that only intrinsic product attribute, brand name, place, and sales promotion impact purchase intention individually. H2, H3, H6, and H8 are accepted; while H4, H5, and H7 are not. The second research objective has also been fulfilled. When put in order, intrinsic product attribute is the most significant factor, followed by sales promotion, brand name, and lastly place. For all four significant independent variables, the gap analysis using paired sample t-test suggests that there is a difference between customers’ expectation of the ideal condition and the perceived performance. Thus, H9a, H9b, H9c, and H9d are accepted. The third research objective has also been
fulfilled. Furthermore, customers’ expectation of the
ideal condition and perceived performance of the
significant variables are different. Customers’
expectation is higher than their perception of Product
X’s intrinsic product attribute, sales promotion, and place; while customers’ perception of Product X’s
brand name is generally higher than their expectation for an ideal kids shampoo.
During the process, the researcher realizes that there are some limitations. First, the researcher only chooses nationwide promotional tools as independent variables, so people from different areas who might have different perception on Product X can be reached. The researcher believes it would make the result more representative of the national condition. However, the adjusted R-square shows that only 68.2% of the variability in purchase intention is explained by the independent variables in the research, meaning there are more factors that affect the 31.8% of the variability. Actually, there are two promotional tools that were excluded because they are not available nationwide, which are event and experience (princess hairdo) and personal selling (sales promotion girl) (Company A, 2016). Those tools have been proven to affect purchase intention (Astuti, 2013; Villamor & Arguelles, 2014). Future researcher can add those tools and focus on people who know all promotional tools of Product X.
Second, the researcher distributes the questionnaire one by one to the mothers who join the 4,56
4,11 4,05
4,47
4,49
4,17
3,6 3,8 4 4,2 4,4 4,6
Create positive brand
image
Well-known Memorable
Expectation Perceived Performance
4,5
4,31
4,21
3,97
3,8 3,91
3,4 3,6 3,8 4 4,2 4,4 4,6
Number of stores
Reachability Stock level
96 digital photo competition of Product X, although the population criteria is only to know the competition. There might be more people who know the competition and pass all other criteria. Future researchers can collect the data more systematically. For example, they can ask the company’s digital agency to distribute the questionnaire through the Facebook fan page. The researcher proposes this idea because the competition back then was announced and done in the fan page, making it possible that many people there know the competition and pass other criteria. By doing so, more people can be reached in a less complicated way.
REFERENCES
Aaker, D. (1996). Building Strong Brands. New York: Free Press.
Adamu, U., & Bambale, E. (2016). The Effect of Brand Name on Consumer Purchase Intention in Kano Metropolis: A Conceptual Model. International Journal of Management and Commerce Innovations, 4(1), 58-63.
Agency I. (2016). Insight of Campaign to Indonesian Mothers. Jakarta.
Agency M. (2015). Brand Power Study - Baby Care Indonesia. Jakarta.
Ahmad, N., Mohib, B., & Lakhan, A. (2012). Effect of Product Packaging in Consumer Buying Decision. Journal of Business Strategies, 6(2), 1-10.
Alvarez, B., & Casielles, R. (2005). Consumer evaluations of sales promotion: the effect on brand choice. European Journal of Marketing, 39(1/2), 54-70.
American Marketing Association. (2015). Dictionary. Andoko, J., & Devina, P. (2015). Analisis Pengaruh Marketing Mix (Produk, Harga, Promosi, Lokasi) Terhadap Minat Beli Konsumen Pada Guest House Di Surabaya. Jurnal Hospitality dan Manajemen Jasa, 3(2), 55-69.
Astuti, P. (2013). Pengaruh Event Marketing Terhadap Keputusan Pembelian Produk Rokok Envio Mild : Survei Pada Konsumen Bisnis Mitra Usaha PT. Djarum di Kab. Bandung (Undergraduate thesis). Universitas Pendidikan Indonesia.
Bachriansyah, R.A. (2011). Analisis Pengaruh Kualitas Produk , Daya Tarik Iklan, Dan Persepsi Harga Terhadap Minat Beli Konsumen Pada Produk Ponsel Nokia (Studi Kasus Pada Masyarakat di Kota Semarang) (Undergraduate thesis). Universitas Diponegoro.
Blesic, I., Ivkov-Dzigurski, A., Stankov, U., Stamenkovic, I., & Bradic, M. (2011). Research Of Expected And Perceived Service Quality In Hotel Management. Journal of Tourism, 5-13.
Bryman, A. (2012). Social Research Methods (4th ed.). New York: Oxford University Press.
Buil, I., de Chernatony, L., & Martinez, E. (2013). Examining the role of advertising and sales promotions in brand equity creation. Journal of Business Research, 66, 115-122.
Chai, L.G. (2009, May). A Review of Marketing Mix: 4Ps or More? International Journal of Marketing Studies, 1(1), 2-15.
Company A. (2015). Product Knowledge.
Company A. (2016, September). Brief on Product X. Company A. (2017). Product X Update Report. Company A. (n.d.). Sales Cube.
Cooper, D., & Schindler, P. (2014). Business Research Methods (12th ed.). New York: McGraw-Hill. Coviello, N., Brodie, R., & Munro, H. (2000). An
Investigation of Marketing Practice by Firm Size. Journal of Business Venturing, 15, 523-545.
Creswell, J. (2003). Research design: Qualitative, quantitative and mixed methods approaches (2nd ed.). Thousand Oaks: SAGE Publications. Darke, P., & Chung, C. (2005). Effects of pricing and promotion on consumer perceptions: it depends on how you frame it. Journal of Retailing, 81(1), 35-47.
Deliya, M., & Parmar, B. (2012, June). Role of Packaging on Consumer Buying Behavior– Patan District. Global Journal of Management and Business Research, 12(10), 49-68. Euromonitor International. (2016). Baby and
Child-Specific Products in Indonesia. Passport. Fadhilah, A.P. (2013). Analisis Pengaruh Produk,
Harga, Promosi Dan Saluran Distribusi Terhadap Keputusan Pembelian Konsumen (Undergraduate thesis). Universitas Diponegoro.
Farooq, S., Habib, S., & Aslam, S. (2015, December). Influence Of Product Packaging On Consumer Purchase Intentions. International Journal of Economics, Commerce, and Management, 3(12), 538-547.
Ghozali, I. (2013). Aplikasi Analisis Multivariate dengan Program SPSS 23 (8th ed.). Semarang: Badan Penerbit Universitas Diponegoro. Green, S. (1991). How Many Subjects Does It Take To
Do A Regression Analysis. Multivariate Behavioral Research, 26(3), 499-510.
Kantar Worldpanel. (2016). AP Household Panel Data Q4, 2015.
Kawuriyan, R.R.S. (2009). Pengaruh Strategi Marketing Mix Terhadap Minat Pembelian
Konsumen (Studi Pada Netbook “Acer Aspire
One”) (Undergraduate thesis). Universitas
Sebelas Maret Surakarta.
97 Suzuki Ertiga Di Kota Manado. Jurnal EMBA, 3(2), 12-24.
Kotler, P., & Armstrong, G. (2014). Principles of Marketing (15th ed.). Upper Saddle River, New Jersey: Pearson Education.
Kotler, P., & Keller, K. (2016). Marketing Management (15th ed.). Essex: Pearson. Larissa, E.A. (2016). Pengaruh Atribut Kemasan
Terhadap Minat Beli Konsumen (Studi Empiris Pada Konsumen Mie ABC Cup Di Kota Surakarta) (Undergraduate thesis). Universitas Muhammadiyah Surakarta.
Lind, D., Marchal, W., & Wathen, S. (2014). Statistical Techniques in Business and Economics (15th ed.). Singapore: McGraw-Hill/Irwin.
Lonial, S., & Zaim, S. (2000). Investigating Of Product Attributes And Their Affect On Overall Satisfaction. International Joint Symposium on Business Administration: Challenges For Business Administrators In The New Millennium, (pp. 553-564).
Mirabi, V., Akbariyeh, H., & Tahmasebifard, H. (2015, January). A Study of Factors Affecting on Customers Purchase Intention Case Study: the Agencies of Bono Brand Tile in Tehran. Journal of Multidisciplinary Engineering Science and Technology, 2(1).
Prabowo, I.J.K.G. (2016). Pengaruh Citra Merek, Kualitas Produk, Persepsi Harga Dan Word Of Mouth Terhadap Minat Beli (Studi pada Mahasiswa Fakultas Ekonomi UNY pengguna iPhone) (Undergraduate Thesis). Universitas Negeri Yogyakarta.
Pramono, R. (2012). Analisis Pengaruh Harga Kompetitif, Desain Produk, Dan Layanan Purna Jual Terhadap Minat Beli Konsumen Sepeda Motor Yamaha (Studi Kasus Pada Masyarakat Kota Semarang) (Undergraduate thesis). Universitas Diponegoro.
Purba, J.S. (2012). Analisis Pengaruh Persepsi Nilai Konsumen Terhadap Minat Beli Produk Private Label Hypermarket Carrefour Di Kota Semarang (Undergraduate thesis). Universitas Diponegoro.
Putri, Y.A. (2016). Pengaruh Iklan Dan Harga Terhadap Minat Beli Produk Kopi Torabika Creamy Latte (Studi Kasus Pada Mahasiswa Fakultas Ekonomi, Prodi Manajemen Universitas Sanata Dharma Mrican Yogyakarta) (Undergraduate thesis). Universitas Sanata Dharma.
Rizwan, M., Irshad, Q., Ali, K., Nadir, M., & Ejaz, M. (2013). Impact Of Sales Promotional Tools On Purchase Intention. International Journal of Management Sciences and Business Research, 2(1), 36-49.
Saunders, M., Lewis, P., & Thornhill, A. (2009). Research Methods for Business Students (5th ed.). Essex: Pearson Education Limited.
Sekaran, U., & Bougie, R. (2016). Research Methods for Business: A Skill-Building Approach (7th ed.). West Sussex: Wiley.
Shrum, L., Lowrey, T., Luna, D., Lerman, D., & Liu, M. (2012). Sound symbolism effects across languages: Implications for global brand names. International Journal of Research in Marketing, 1-5.
Siddiqui, A. (2014). TV Ads Impact on Consumer Purchase Intention. International Conference on Marketing. Institute of Business Administration Karachi.
Soenyoto, F. (2015). The Impact of Brand Equity on Brand Preference and Purchase Intention in
Indonesia’s Bicycle Industry: A Case Study of
Polygon. iBuss Management, 3(2), 99-108. Spears, N., & Singh, S. (2004, September). Measuring
Attitude Toward the Brand and Purchase Intentions. Journal of Current Issues and Research in Advertising, 26(2), 53-66. Susanto, O., Natalia, M., & Siaputra, H. (2016).
Pengaruh Bauran Pemasaran (Produk, Harga, Lokasi, Dan Promosi) Terhadap Minat Beli Konsumen Pada Hotel Budget Di Kawasan Surabaya Pusat. Journal Hospitality dan Manajemen Jasa, 4(2), 93-108.
Villamor, A., & Arguelles, R. (2014). Personal Selling and Social Media: Investigating Their Consequences to Consumer Buying
Intention. International Conference on Business, Management & Corporate Social Responsibility, (pp. 41-44). Batam.
Wang, E., & Yu, J. (2016). Effect of product attribute beliefs of ready-to-drink coffee beverages on consumer-perceived value and repurchase intention. British Food Journal, 118(12), 2963-2980.