316
The Impact of Marketing Mix towards Customer Loyalty Mediated by
Customer Satisfaction of Blackberry Indonesia
Raymond Sukamto, Daniel B. Lumintan
International Business Management Program, Petra Christian University Jl. Siwalankerto 121-131, Surabaya
E-mail: [email protected], [email protected]
ABSTRACT
This research conducted to know the impact of Marketing Mix strategy toward customer loyalty mediated by customer satisfaction of Blackberry Indonesia. The data gathered using simple random sampling method and distribute questionnaires to 102 respondents who ever used or own Blackberry. The data then being analyzed by Path Analysis and Sobel Test The result shown that marketing mix simultaneously having significant impact toward customer loyalty mediated by customer satisfaction of Blackberry Indonesia. However, only one of marketing mix element which is product is not significant toward customer loyalty of Blackberry Indonesia.
Keywords: Customer loyalty, Customer Satisfaction, Marketing Mix.
ABSTRAK
Pelanggan yang dimediasi oleh kepuasan pelanggan Blackberry Indonesia. Data yang telah dikumpulkan menggunakan simple random sampling dan disebarkan menggunakan kuesioner ke 102 responden yang pernah menggunakan atau mempunyai Blackberry. Kemudian data di a nalisa menggunakan analisa jalur dan tes sobel. Hasil dari analisa tersebut menamplikan bahwa bauran permasaran secara simultan memberikan pengaruh yang signifikan terhadap loyalitas pelanggan yang dimediasi oleh kepuasan pelanggan. Namun, hanya satu elemen dari marketing mix dimana product tidak signifikan terhadap loyalitas pelanggan Blackberry Indonesia.
Kata Kunci: Loyalitas Pelanggan, Kepuasan Pelanggan, Bauran Pemasaran.
INTRODUCTION
In this globalization era, people are required to be more interconnected. From various ways to communicate, mobile phone is considered as one of the most convinient and practical gadget to communicate. Nowadays people are shifting their preferences of using feature phone to smartphone (Redwing-Asia, 2014).
In 2013 there are 278 million subscribers which make Indonesia become the 4th largest mobile market in the world. Indonesia imported US$2.6 billion worth of smartphones in 2013 (Redwing-Asia, 2014).
Due to this huge opportunity available in the market, many big players of smartphone producers come to Indonesia and challenge their fortune on this business field. This has made the rivalry among competitor become even tougher than before. Every smartphone producers that came to Indonesia struggling to grab the heart of smartphone users in Indonesia. Each of have different approach and targeting different segments in Indonesia.
In order to sell the product in the market, every company have their own unique marketing
strategy. The element of 4P’s, better known as
Marketing Mix consist of Product, Price, Place, and Promotion, have taken an important role to able the company to sell their product or to outstand in the market. For instance, Samsung as one of the leading smartphone brand in Indonesia with 32% market share as the end of 2013 (reuters, 2014), have a lot of promotion such as zero interest installment (Samsung, 2014). When samsung launch their product they also held a trade-ins event, the customer can trade their old smartphone with the new samsung smartphone.
For Blackberry, they play a lot in product variant to grab all segment in Indonesia, besides expensive smartphone such as Blackberry Z10 and Q10 which priced 7 to 8 million when it was launched. As a part of their marketing strategy they also create a cheaper smartphone exclusive only for Indonesia which sells for around 2 million rupiah such as Q5 and also Z3 (BBC, 2014; Oketekno, 2014).
317 The market share of Blackberry is collapsing in Indonesia from 43% in 2011 becoming only 3% in 2014.
According to Blackberry’s former country head
in Indonesia, Andy Chobam, Blackberry failed because
the head company refused to changed Blackberry’s
marketing material in Indonesia (The globe and mail, 2014).
Marketing mix is part of an effective marketing strategy if a company would like to market its products through 4 important elements which are Product, Price, Place, Promotion (Kotler & Keller, 2009). Those 4 elements in marketing mix could give a positive impact on customer satisfaction (Koontz, 2004). It is because by having a good marketing mix strategy a company could target their market, where the product should be distribute and what are the benefits of buying its products which all of them can meet the customer expectations and fulfill the customer needs and wants (Koontz, 2004).
Customer satisfaction is also one of the elements to gain customer loyalty (Vikas Kumar, Luciano Batista, & Roger Maull, 2011). Once the customer satisfied, they will repurchase the product (Mtab, 2015). After knowing that Blackberry already applied some of marketing mix strategy but they still failed in the market, the researcher conduct this research to know what factors from Blackberry’s marketing mix strategy that influential enough to help them to make their customer satisfied and loyal to repurchase their product in the future. This research is going to dig up more and bring up the real and valid conclusion. Thus Blackberry will know which attribute of marketing mix that they should emphasize more in order for them to be paid by the priceless loyalty of their customers.
LITERATURE REVIEW
In conducting the research, the writers need to know about the relationship among those variables, thus the researcher has to first understand the theories explaining the topic that is going to be researched and able to investigate and analyze the relationship among those variables. In this researh, the writers aim to investigate which variables of Marketing Mix (4p’s) that gives the most significant effect on customer satisfaction and also customer loyalty. Hence, the writers provide the summary of concepts and definition that related to Marketing Mix, customer satisfaction, and also customer loyalty.
Based on Kotler and Keller (2009), Marketing Mix are the marketing tools used by the company to influence the customer to buy their product in order to produces revenue. On the contrary, buyers will perceieve the Marketing Mix approach as benefits that offered by the seller for them. This research will use the concept of 4P based on Kotler and Keller (2009) which are Product, The customers buy the product because it can satisfied their needs (Kotler & Keller,
2009). Price, the amount of money that buyer have to sacrifice or pay in order to acquire the right and use of the product. Many consumers use price as an indicator of quality, higher-priced are perceived to possess high quality and vice versa (Kotler & Keller, 2009). Place, the seller must be able to figure out where their target customers usually shop for the product. By knowing where the place their customer conduct the purchasing act, they will be able to maximize their service to the customer and also minimize the cost of distribution and icrease revenue (Kotler & Keller, 2009). Promotion is creative strategy depends on how the message is being delivered. If the communication is delievered ineffective, the customers will not understand the meaning and will not interested to buy the product (Kotler & Keller, 2009).
Kotler and Keller (2009) also provide a more detailed explanation about customer satisfaction in their book of marketing management, they define customer satisfaction as “a person’s feelings of pleasure or disappointment that result from comparing a product;s perceived performance (or outcome) to expectations. Customers are having their own standard of expectation, and if the performance is not meet their standard, it will make the customer dissapointed, on the
other hand if it’s more than they expect, it will definetly make the customer satisfied (p. 128). According to Kotler and Keller (2009) customer satisfaction can be measured by measuring customer expection gap with management perception.
Kotler and Keller (2009) defines customer loyalty
as “a deeply held commitment to rebuy or repatronize
a preffered product or service in the future despite situational influences and marketing efforts having the
318 There are four hypotheses that intended to be examine in this research and they are as following, Marketing Mix has significant impact toward customer loyalty of Blackberry, Marketing Mix has significant impact toward customer satisfaction of Blackberry, Marketing Mix has significant impact toward customer loyalty mediated by customer satisfaction of Blackberry, Product, Price, Place, and Promotion individually has significant impact toward customer loyalty
RESEARCH METHOD
T
he goal of this research is to create the hypothesis testing as the researchers are going to explain more about the relationship between the 4P’s of Marketing Mix toward customer satisfaction as the mediating variables and customer loyalty of Blackberry Indonesia. The researchers will use explanatory studies according Cooper and Schindler (2014) because the researcher will make the hypotheses about the relationship between the independent variables, dependent variables and the mediating variables.The dependent variable of this research will be the customer loyalty of Blackberry in Indonesia as the impact of the independent variables. The researchers are going to use several indicators to measure customer loyalty base on the theory from Kotler and Keller (2009). Here are the indicators to measure the loyalty of Blackberry Indonesia customer The customer’s intention to keep buying the product in the future, the
customer’s intention to spread positive word-of-mouth about the product to other people, the customer’s intention to offer ideas to the company to take part in developing the product.
This research will also have the independent variable which is the 4P’s Marketing Mix. The researchers are going to use several indicators from Kotler and Keller (2009) to measure each of Marketing Mix variables as shown in the bottom like Product Variety, quality, design, features, reputation, packaging, size, service, warranties, returns. Variance of price, discount, allowance trade, credit terms, payment period, Distribution channels, market coverage, product variaties in one store, accessible by the target customer, adequate inventory, transport, attractive program, attractive advertisement, informative sales, sponsorship, informative E-marketing.
Based on the previous explanation, this research are also having the mediating variable. The researchers are going to analyze the impact of the independent variables toward the dependent variable through the mediating variables which is customer satisfaction. There are several indicators to measure customer satisfaction that has been explained in the previous chapter under the section of 2.1.2. Here are the indicators of customer satisfaction, The customer’s
intention to repurchase the product,The customer’s intention to purchase the product instead of other competitor brand, The customer’s intention to purchase the product because the offered price equal with the offered quality
There are 3 sources of data according to Cooper and Schindler (2014) which are primary, secondary and tertiary sources. The researchers are going to gather the data only from primary sources and secondary sources. Primary sources means that there is no interpretation from the raw data and it is represent original opinion. However, secondary sources means that there is an interpretation from the primary data with the supporting sources from journals, encyclopedias, textbook, handbook and newspaper. First, the researchers will spread the questionnaires for the respondents that own and ever used Blackberry and the result will become the primary data. Second, this research are contains of some relevant theories and smartphone industry analysis. Thus, the researchers also need to have the secondary sources which takes some sources of data from relevant articles, website, books and journals.
According to Donald R. Cooper and Pamela S. Schindler (2014) there are 4 types of data which are nominal, ordinal, interval and ratio. The nominal data basically just like a screening questions which are mutually exclusive and collectively exhaustive and it usually can be categorize as 2 or more categories. For example, when the research want to measure gender, it would be male or female. The ordinal data is for measure the preferences of the respondents, there will be an option that have a greater or less value. For example, the respondents will be asked to give the rank of 1 to 5 for their favorite ice cream brand, the result will show us the most preferable ice cream brand and the rest of their other preferable ice cream brand. The interval data is for measure the equality of the distance. For instance, the distance of 1km to 4km is just equal with 2km to 5km. Finally, the ratio data is actually similar to interval data. However, the difference is that in the ratio data there is natural origin, it is use for measure the weight, height and another physical dimensions. The researchers will make statements the questionnaires based on the indicators of measuring the variables. The researchers will use 5-point likert scale and asked the respondents to give the score of each statements based on their own agreement. Finally, the researchers will sum up all of the scores given by the respondents and it will become the result of each variables.
319 heteroscedasticity of residuals, and normality of the
residual’s variance.
Validity and reliability tes is conducted to avoid bias and distortion on the data. Therefore validity and realiability test first must be conducted before analysing the data.
Cooper and Schindler (2014) defines Validity as
“Is the extent to which a test measures what we actually wish to measure”. In conducting validity test we have
to compare the value of r-value with the r-table (Ghozali, 2011). The data from the questionnaire will be proccesed by SPSS, if the r-value measured higher compared to r-table it means that the indicators are valid.
On the other hand, Cooper and Schindler (2014) defines reliability test as “has to do with the accuracy
and precision of a measurement procedure”. Reliability
test is conducted to know whether the data of the research is free of random, bias, and error data. In this research, researcher conducts the reliability test based on internal consistency which can be measured through
cronbach’s alpha. According to Ghozali (2011), when the output of Cronbach’s Alpha is higher than 0.6, then
the data can be said as reliable.
Normality test is conducted in order to examine whether the residual variables in the regression model is having normal distribution or not (Ghozali, 2011). The statistical analysis of normality test can be conducted through Kolmogorov-Smirnov test by using SPSS. In order for the residual to be normally distributed, the value of Asymp. Sig. (2-tailed) value
must be bigger than α (0.05) which mean accept H0
where residuals are normally distributed
Autocorrelation test conducted to examine whether there is a correlation between the residual of a certain period (period t) with the residual from the previous period (period t-1) (Ghozali, 2011). If the correlation between the residuals exist, it means the autocorrelation exists. The residual of one observation conducted from individual or group tends to affect tends to affect the residual from the same individual or group in the following period. In order to check the existence of autocorrelation, the researcher are going to use Durbin-Watson test in SPSS. The test is free from autocorrelation if du < d < 4-du.
Multicollinearity test is conducted to know whether there is an existence of inter correlation between independent variable (Ghozali, 2011). A good regression model must be free from collinearity or interdependent between independent variable. According to Ghozali (2011), multicollinearity can be found by analysing the tolerance value and variance inflation factor (VIF). The condition where independent variable free from multicollinearity is
when VIF ≤ 10 and Tolerance ≥ 0.10.
Heteroscedasticity test is conducted to know whether the regression model has constant variance of the residual in one observation to another or not. A good regression model must be the one called
homoscedasticity because the variance of the residuals is constant from one observation to another (Ghozali, 2011). In this research the researcher are going to use Park test. Park test is conducted by comparing P-value or parameter coefficients of all independent variables. If the P-value is more than significance level of 0.05 it means that homocedasticity is occur or there is no heteroscedasticity. On the other hand if the P-value is lower than 0.05 is means that heteroscedasticity is occur
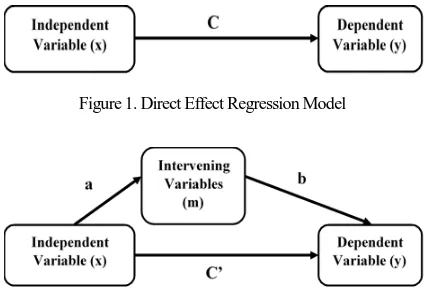
The researcher will use the analytical method of path analysis with regression. Path anaysis is a method of expansion to analyze the causal relationship in multiple regression where the independent variables are not having direct impact to the dependent variable because of the existence of mediating or intervening variables (Ghozali, 2011). Following figure is the patch analysis for this research:
Figure 1. Direct Effect Regression Model
Figure 2. Path Analysis with Regression Model
In order to have a deep explanation, the researcher conduct F-test and T-test, If F-Test is conducted to know the significance of each independent variable toward dependent, F-Test is measuring the overall significance of all independent variables simultaneously toward dependent variables in the model (Ghozali, 2011). In this case, F-Test will show that independent variables simultaneously affecting the dependent variable if the
Sig F below or lower than 0.05. If it’s higher it means
that Independent variables does not simultaneously affecting the dependent variable
T-Test is conducted to know the influence of each independent variable towards the dependent variable. According to Ghozali (2011), the significant value in the coefficient table from the output by using SPSS should be lower than 0.05. If not, it means that there is no influence from independent variable towards the dependent variable.
320 mediating or intervening variable between independent and dependent variable that will carry forward the impact of independent variable toward dependent variable (Ghozali, 2011).
To conduct the sobel test, the researcher calculate the standard error of indirect effect and the raw unstandardized regression coefficient by using the equation below:
Sab =
Where:
ab = The regression coefficient that represent the effect of X on M and M on Y, correspondingly Sa = Standard error of a
Sb = Standard error of b
Sab = Standard error of indirect effect
After that the the researcher calculate the Z-value by dividing coefficient ab with standard error of indirect effect. If Z-value bigger than 1.96 it means that the intervening variables carry forward the impact of independent variables toward dependent variables which mean there is mediation in the model.
RESULTS AND DISCUSSION
Validity shown the performance of each questions item in the questionnaire for measure the research variables. Validity test is conducted using correlations method of product moment Pearson. Items in the question is valid when the correlation product moment Pearson coefficient is bigger than r-table with n = 102 means 0.195.
Table 1: Validity Test
Item Criteria Result
X1 0,195 Valid
X2 0,195 Valid
X3 0,195 Valid
X4 0,195 Valid
M 0,195 Valid
Y 0,195 Valid
Table 2: Reliability Test
Variable Cronbach Alpha Criteria Result
Product (X1) 0,771 0,60 Reliable
Price (X2) 0,751 0,60 Reliable
Place (X3) 0,774 0,60 Reliable
Promotions (X4) 0,787 0,60 Reliable
Customer Satisfaction (M) 0,775 0,60 Reliable
Customer Loyalty (Y) 0,823 0,60 Reliable
Table 2 shown that product, price, place, promotions, customer satisfaction and customer loyalty are having cronbach alpha > critical point 0.60. Thus, the item questions which measure the research variables can be said as reliable.
For the path analysis with regression, the researcher conduct three times regression:
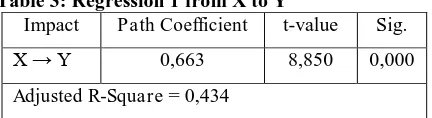
Table 3: Regression 1 from X to Y
Impact Path Coefficient t-value Sig.
X → Y 0,663 8,850 0,000
Adjusted R-Square = 0,434
From table 3 it can be seen that the path coefficient of the impact of marketing mix (X) toward customer loyalty (Y) is 1.174 with the significance
level 0.000 < 0.05 (α=5%). This result shown that
marketing mix has significant positive impact toward customer loyalty for Blackberry user in Surabaya. It means that the increasing in marketing mix will significantly increase the loyalty of Blackberry user in Surabaya. The result of adjusted R-Square is 0.434 shown that the diversity of customer loyalty Blackberry user in Surabaya can be explained by marketing mix 43.4% and the rest is because of other factors.
Table 4: Regression 2 from X to M
Impact Path Coefficient t-value Sig.
X → Y 0,656 8,696 0,000
R-Square = 0,425
From table 4 it can be seen that the path coefficient of the impact of marketing mix (X) toward customer satisfaction (M) is 1.304 with the
significance level 0.000 < 0.05 (α=5%). This result
shown that marketing mix has significant positive impact toward customer satisfaction for Blackberry user in Surabaya. It means that the increasing in marketing mix will significantly increase the satisfaction of Blackberry user in Surabaya. The result of adjusted R-Square is 0.425 shown that the diversity of customer satisfaction Blackberry user in Surabaya can be explained by marketing mix 42.5% and the rest is because of other factors.
Table 5: Regression 3 X and M to Y
Impact Path Coefficient t-value Sig.
X → Y 0,301 3,628 0,000
M → Y 0,551 6,650 0,000
R-Square = 0,605
From table 5 it can be seen that the f-test having significant level 0.00 which mean that the Marketing Mix and Customer Satisfaction is having
321 simultaneously significant impact toward Customer Loyalty. From table 5 it can be seen that Marketing Mix (X) gives significant impact toward customer loyalty (Y) with the significance level 0.000 < 0.05
(α=5%). It means that the increasing in marketing mix
will significantly increase the loyalty of Blackberry user in Surabaya.
Path coefficient of the impact of customer satisfaction (M) toward customer loyalty (Y) is 0.492
with the significance level 0.000 < 0.05 (α=5%). This
result shown that customer satisfaction is also has significant positive impact toward customer loyalty for Blackberry user in Surabaya. It means that the increasing in customer satisfaction will significantly increase the loyalty of Blackberry user in Surabaya.
The result of adjusted R-Square is 0.605 shown that the diversity of customer loyalty Blackberry user in Surabaya can be explained by customer satisfaction 60.5% and the rest is because of other factors besides marketing mix and customer satisfaction.
According to Ghozali (2011), hypothesis testing of the impact of marketing mix (X) toward customer loyalty (Y) through customer satisfaction (M) as the intervening variable are as follows: The direct impact of independent variable toward dependent variable without intervening variable must be significant, which can be done by conduct regression of independent variable and dependent variable. The impact of independent variable toward intervening variable must be significant. The intervening variable toward dependent variable must be significant. The impact of independent variable toward dependent variable still significant after intervening variable being included (partial mediation) or the impact of independent variable toward dependent variable is not significant if there is intervening variable (full mediation).
According to Table 1, 2 and 3 it can be seen that: The direct impact of marketing mix (X) toward customer loyalty (Y) without customer satisfaction (M) has been significant which is 0.000 < 0,05 (α=5%). The impact of marketing mix (X) toward customer satisfaction (M) has been significant which is 0.000 <
0,05 (α=5%). The impact of customer satisfaction (M) toward customer loyalty (Y) has been significant which
is 0.000 < 0,05 (α=5%). The impact of marketing mix (X) toward customer loyalty (Y) after customer satisfaction (M) being included in the regression model has been significant which is 0.000 < 0,05 (α=5%). The indirect impact can be found by multiplying the coefficient path X→M and M→Y which is 1.304 x 0.492 = 0.641.
The result of the test above showing that customer satisfaction is intervening variable for the impact of marketing mix toward customer loyalty. The researchers are now going to conduct the Sobel Test as follows:
To know whether the indirect impact is significant or not, here is the calculation formula of t-statistic with sobel:
The coefficient of indirect impact is 0.641
The standard error (Se) for the indirect impact is = 0.121
Z for indirect impact is = 0.641 : 0.121 = 5.297 In order to be significant, Z must be greater than +1.96 or less than -1.96 (Warner, 2013). According to the result the Z value is 5.297 which mean higher than +1.96 so it can be concluded that the mediation of marketing mix toward customer loyalty mediated by customer satisfaction is significant, thus every one point increase in marketing mix, there will be increased of 0.641 (Indirect impact) point in the customer loyaly which mediated by customer satisfaction. The direct effect of marketing mix toward customer loyalty is 0.533 which mean that one point increase in marketing mix, there will be 0.533 increase in customer loyalty. Thus, it can be said from the total effect of marketing mix toward customer loyalty (c = 1.174) that the customer satisfaction mediated relatively huge amount (ab = 0.641) and the remaining
is not mediated by customer satisfaction (c’ = 0.533).
It means that independent variable in this case may influence an outcome of dependent variable through a mediating variable (M=Customer satisfaction)
The indirect impact of marketing mix toward customer loyalty mediated by customer satisfaction can be concluded as partial mediation because after the customer satisfaction being included in the regression model of the impact of marketing mix toward customer loyalty still significant.
The Impact of Marketing Mix Individually Toward Customer Loyalty
To know the impact of marketing mix individually toward customer loyalty, the researchers are going to conduct the regression analysis for the elements of Marketing Mix and here is the result:
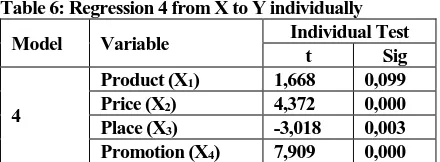
Table 6: Regression 4 from X to Y individually
Model Variable Individual Test
t Sig
4
Product (X1) 1,668 0,099
Price (X2) 4,372 0,000
Place (X3) -3,018 0,003
Promotion (X4) 7,909 0,000
The result of the t-test between Product toward customer loyalty is having significant value 0.099 > 0.05. It can be explained that product variable is not having significant impact toward customer loyalty of Blackberry user in Surabaya.
The result of the t-test between Price toward customer loyalty is having significant value 0.000 < 0.05. It can be explained that price variable is having significant impact toward customer loyalty of Blackberry user in Surabaya.
322 negative significant impact toward customer loyalty of Blackberry user in Surabaya.
The result of the t-test between Promotion toward customer loyalty is having significant value 0.000 < 0.05. It can be explained that promotion variable is having the most significant impact toward customer loyalty of Blackberry user in Surabaya.
After presenting the result of the data processing, the researchers would like to discuss the meaning of the result. First, the researchers will discuss about the confirmation of the four hypotheses that have been developed in which the four hypotheses are:
Marketing Mix has significant impact toward customer loyalty of Blackberry, Marketing Mix has significant impact toward customer satisfaction of Blackberry, Marketing Mix has significant impact toward customer loyalty mediated by customer satisfaction of Blackberry, Product, Price, Place, and Promotion individually has significant impact toward customer loyalty of Blackberry
In order to test the first hypothesis, the null
hypothesis developed stating that ”Marketing Mix
(4P’s) simultaneously does not have significant impact
toward customer satisfaction of Blackberry”. In order
to reject the null hypothesis, the significance T
(P-value) must be lower than significance level (α) of
0.05. The result of the regression show that the significance level at 0.000 which mean that the null hypothesis is rejected, it confirm the first hypothesis
which saying marketing mix (4P’s) simultaneously has
significant impact toward customer satisfaction of Blackberry
For the second hypothesis, the null hypothesis
developed stating that “Marketing Mix (4P’s)
simultaneously does not have significant impact
toward customer loyalty of Blackberry”. The result of
the regression test show the significance level at 0.000, it was below the significance level (α) 0.05 which mean
that the second which is saying “Marketing Mix (4 p’s)
simultaneously has significant impact toward customer
loyalty of Blackberry” is confirmed.
For the third hypothesis, the null hypothesis
developed stating that “Marketing Mix (4P’s) does not
has significant impact toward customer loyalty
mediated by customer satisfaction of Blackberry” in
order to know whether marketing mix has significant impact toward customer loyalty mediated by customer satisfaction the researcher use sobel test. The Z-value must be higher than 1.96 in order to reject null hypothesis. The result show that the Z-value is 5.297 which mean that the third hypothesis is confirmed.
From the T-Test we can see that product is the only independent variable whose P-value is higher than the significance level of 0.05 which mean that product is not having significant impact toward customer loyalty. While the other three independent variable which are price, place, and promotion is confirmed to have significant impact toward customer loyalty.
The results explained in the previous paragraphs shown that the there are some similarities and differences between the theory that have been developed by the
researcher compared with the result. the 4P’s as the
elements of marketing mix is shown to have significant impact both toward customer loyalty and customer satisfaction. However if the elements are being separated, only price, place, and promotion that have significant impact on customer loyalty of blackberry. However, Marketing Mix as a whole show a significant impact both toward customer loyalty and customer satisfaction which mean that all the elements of Marketing Mix must be combined together instead of stand individually.
The element of product may not significant due to the reason that people in Indonesia nowadays prefer to buy samsung or other android based operating system because nowadays Android operating system able to use Blackberry messenger which become the main reason for people to buy Blackberry and also because Android is having many feature that outstand Blackberry (Nistanto, 2014). Which mean that Blackberry product is not really significant anymore since the main feature of its product can be found in other Android based operating system smartphone. The element of place also having a significant impact however it was negative.
According to Wilson (2013) place is focused on making the customer easy to access or buying the product. Which mean that it will increase customer loyalty since the customer will feel comfortable to because it was easy to found Blackberry in the market. However after doing the research based on Kotler & Keller (2009) indicator, the researcher realize that there are some indicator that negatively related. For example assortments and inventory, according to Matt Haig (2003) the more the variety or choices in one store will overwhelmed the customer which make them confused and did not satisfied with their purchases. Since the customer confused and did not satisfied the element of place having a negative impact toward customer loyalty.
Based on the t-test, promotion and price are the two element that having positive impact toward customer loyalty. This is due to the fact that Blackberry launch a cheap smartphone spesifically for Indonesia and also give a lot of promotion such as zero percent installment (Oketekno, 2014).
323 Product is proven to have significant impact on customer loyalty of nigerian breweries, however not toward Blackberry customer loyalty. looking at the research object, it can be seen that breweries product have different nature with Blackberry which sell smartphone. People drink because it taste good, however in this case of Blackberry product is less preferable compared to Android product in the market which make the product become insignificant element. For place, in Nigerian breweries they had positive impact while in this case of blackberry it has negative impact. This is also due to the nature of the product, we can see that people go to the breweries because they want to have leisure time which mean that the place must be good. However what happen with blackberry is that it has a lot of product in one store which make the customer confused.
The second previous research was evidence from banking sector of Pakistan about impact of customer satisfaction on customer loyalty. The researcher tried to compare this research with the path analysis regression. The result from the marketing mix and customer satisfaction toward customer loyalty (3rd regression for path analysis) regression show that customer satisfaction is significant and affecting customer loyalty, the same with the previous research from banking sector of Pakistan that confirm customer satisfaction have positive impact toward customer loyalty which mean that when the customer feel satisfied toward one product they will become loyal to that one particular product.
The third previous research was taken from a case study deriving consensus rankings from benchmarking conducted by Amy Poh Ai Ling in 2007. The research focust on the impact of marketing mix toward customer satisfaction. Amy Poh Ai Ling stated that from her research that every element from marketing mix having positive significant impact toward customer satisfaction. This research also having the same result where marketing mix having positive significant impact toward customer satisfaction (2nd regression). However the difference is that in this research the researcher do the regression simultaneously or T-test, while on Amy Poh Ai Ling research she does the research individually or using T-test.
Additionally, the result of this research also answer the questions that have been raised when the research was started, the researcher wants to reveal whether Marketing Mix simultaneously (Product, Price, Place, Promotion ) having impact toward customer loyalty of Blackberry in Indonesia which mediated by customer satisfaction of Blackberry in Indonesia. The researcher already conducting regression with path analysis and sobel test. From the regression for path analysis we know that all variable is significant:
1st regression: Marketing Mix toward Customer Loyalty, 2nd regression: Marketing Mix toward
Customer Satisfaction, 3rd regression: Marketing Mix and Customer Satisfaction toward Customer Loyalty
Since all the regression for path analysis significant, sobel test can be conducted. The result show that the Z-value is 5.297 which is higher than 1.96, it is proven that Marketing Mix simultaneously having impact toward customer loyalty of blackberry in Indonesia which mediated by customer satisfaction.
The second question is that the researcher want to reveal which elements of marketing mix that having the biggest impact toward customer loyalty of blackberry in Indonesia. To answer the second question the researcher already conduct t-test and from the result the researcher found out that only price, place, and promotion that having significant impact toward customer loyalty with promotion as the element with the most significant impact toward customer loyalty in Indonesia and followed by price.
CONCLUSION
According to the result of the research, the researchers can give several recommendation for Blackberry Indonesia so that this company can have better performance in the future. The final result of this research shown that Marketing Mix simultaneously is all significant toward customer loyalty whether with or without intervening variable which is customer satisfaction. However, not all marketing mix elements are significant individually toward customer loyalty. Thus the researchers conclude that marketing mix better not stand individually due to some other reason such as nature of the product itself which might get one of the variables from the marketing mix become not significant.
Blackberry should improve their Marketing Mix strategy as simultaneously since Marketing Mix simultaneously having significant impact toward the satisfaction and the loyalty of Blackberry customer. Thus, if Blackberry wants to increase their customer satisfaction and customer loyalty, Blackberry needs to increase the quality of their product, giving special price, more focus on certain product in one store and be more active in promoting their product.
In details, if the researcher breakdown the element of marketing mix, it shown that promotion is the most significant element to improve customer loyalty. Thus, blackberry needs to be more focus on their promotion strategy. The researchers recommend Blackberry Company to be more active in the social media to attract the customer moreover using Facebook application. In fact, according to Pew Research Center (2015), 71% online adults are using Facebook. So, if blackberry advertise or promote their product online in Facebook, it means they will attract about 71% online adult people in this world.
324 loyalty of Blackberry. The researchers conclude that one of the indicator of place is become the main reason why place can be negative impact toward customer loyalty. The indicator saying that Blackberry sold many variants of product in one store. In fact, many choices in one store will make people overwhelmed
and did not want to buy the product. If people didn’t
want to buy the product, it will be impossible to create customer loyalty.
Finally, this research only have limited independent variables which is Marketing Mix. The customer satisfaction and customer loyalty of Blackberry could also being impacted by the other factors besides Marketing Mix. In fact, the adjusted R square of the final result of this research showing that Marketing Mix simultaneously having significant impact toward customer loyalty only explain about 43.4% and Marketing Mix simultaneously having significant impact toward customer satisfaction only explain 42.5% also for Marketing Mix simultaneously having significant impact toward customer loyalty mediated by customer satisfaction only explain 60.5% and the rest is because of other factors. So, this research can only give the recommendation about the Marketing Mix strategy without any other factors which give impact toward the satisfaction and the loyalty of Blackberry Indonesia customer.
REFERENCES
Redwing-Asia. (2014, february 2). redwing-asia.com. Retrieved from redwing-asia.com: http://redwing-asia.com/market-data/market-data-telecoms/
Reuters. (2014, march 10). http://gadgets.ndtv.com/. Retrieved from http://gadgets.ndtv.com/: http://gadgets.ndtv.com/apps/news/koreas- quirky-messaging-apps-take-on-bbm-whatsapp-in-text-happy-indonesia-493609 Samsung. (2014, october). Samsung.com. Retrieved
from Samsung.com:
http://www.samsung.com/id/galaxylaunchpa ck/
BBC. (2014, may 13). bbc.co.uk. Retrieved from bbc.co.uk:
http://www.bbc.co.uk/indonesia/majalah/201 4/05/140513_bisnis_blackberryjakarta Oketekno. (2014, september 30). oketekno.com.
Retrieved from oketekno.com: http://oketekno.com/340/blackberry-q5- smartphone-baru-untuk-anak-muda-spesifikasi-dan-review.html
The globe and mail. (2014, november 3). theglobeandmail.com. Retrieved from theglobeandmail.com:
http://www.theglobeandmail.com/report-on- business/international-business/lack-of- global-knowledge-has-cost-blackberry-indonesia/article21432165/
Koontz, C. (2004, february). infotoday.com. Retrieved
from infotoday.com:
http://www.infotoday.com/mls/jan04/koontz. shtml
Vikas Kumar, Luciano Batista, & Roger Maull. (2011). Service Science. The Impact of Operations Performance on Customer.
Ghozali, I. (2011). Aplikasi Analisis Multivariate dengan Program IBM SPSS.
Cooper, D., & Schindler, P. (2014). Business Research Methods. McGRAW-HILL.
Kotler, P., & Keller, K. L. (2009). Marketing Management. New Jersey: Pearson Education, Inc.
Ling, A. P. (2007). The Impact of marketing mix on customer satisfaction: a case study deriving consensus rankinigs from benchmarking. Journal of Productivity Measurement. Lukman, E. (2013, july 22). BlackBerry Now Has 15
Million Users in Indonesia. Retrieved from https://www.techinasia.com/blackberry-15-million-users-indonesia-sanctions/
Mohsan , F., Nawaz, M. M., Khan, S., Shaukat, Z., & Aslam, N. (2011). Impact of Customer Satisfaction on Customer Loyalty and Intention to Switch: Evidence from Banking Sector of Pakistan. International Journal of Business and Social Science.
Owomoyela, Olansunkanmi, & Oyeniyi. (2013). Investigating the impact of marketing mix elements on consumer loyalty: an emprical study on nigerian breweries plc. Interdisciplinary Journal of Contemporary Research in Business.