MARKETING STRATEGY AND ITS EFFECT TO
THE CONSUMER PURCHASE INTENTION
TOWARDS “KURMELO” (CANDIED POMELO
ORANGE PEEL) IN WIJAYA KUSUMA
AGRO-INDUSTRY MAGETAN REGENCY, EAST-JAVA,
INDONESIA
Aprilia Roudzotul M
1*, Budi Setiawan
21
Student in the Study Program of Agribusiness, Department of Agricultural Socio-Economics, Faculty of Agriculture, University of Brawijaya Malang
2
Lecturer in the Study Program of Agribusiness, Department of Agricultural Socio-Economics, Faculty of Agriculture, University of Brawijaya Malang
*corresponding author: [email protected]
Abstract: This study aims are to analyze the effect of marketing strategy – product, price, distribution, promotion – to the consumer purchase intention towards “Kurmelo” (candied pomelo orange peel) in Wijaya Kusuma Agro-Industry, to describe internal and external factors as well as formulating marketing strategy. Method that used to analyze the effect of marketing strategy to the purchase intention is linear multiple regression with total respondent of 65 respondents. In formulating marketing strategy, this study employs SWOT analysis. The results confirms that marketing strategy variable, which is price, product, promotion, and place, simultaneously able to explain purchase intention of consumers. All those variables affect significantly to the purchase intention. Moreover, the result of SWOT analysis suggests that several strategies, such as promotion, production strategy, and market expantion, are encouraging in order to develop more Wijaya Kusuma Agro-Industri.
Keywords: Marketing strategy, Product, Price, Distribution, Promotion, SWOT analysis
INTRODUCTION
After financial crisis in 1998, one of business type that able to survive is agro-industry. Agro-industry uses higher domestic resource than import, however, it is the thing that makes Small and Medium Enterprises able (UKM-Usaha Kecil Menengah) to survive in the middle of the crisis.
It is proven empirically during the financial crisis in 1997 when all sectors had negative growth, and amazingly, agriculture sector – as one of sector based on domestic resource – had positive growth (Amalia, 2006). Agro-industry has endurance and is more appropriate to be implemented and developed in order to improve economic condition after the crisis in agricultural nation, such Indonesia. Besides, in order to anticipate the same thing towards today global economics, the government starts to pay attention on small and medium enterprises based on agro-industry.
Wijaya Kusuma Agro-Industry is one agro-industry that established in 2015 in which it needs accurate marketing strategy to develop this agro-industry. One strategy that needs to be developed is marketing strategy because the products are still unfamiliar in public. Small and medium enterprises also need marketing strategy to develop the business, because in financial crisis condition, indeed, these small and medium enterprises are able to survive and own positive growth towards people income (Hermawan, 2012).
Marketing analysis is very important in order to develop the firm strategicly. Therefore, Wijaya Kusuma Agro-Industry needs an analysis about the effect of marketing strategy to the consumer
purchase intention towards “Kurmelo” (candied
will be affected to the marketing strategy. This marketing strategy formulation performed through SWOT analysis.
The objectives of this research as follow: 1) analyzing the effect of marketing strategy that conducted by Wijaya Kusuma Agro-Industry to the
consumer purchase intention towards “Kurmelo”
(candied pomelo peel); 2) describing internal and external factors that affected to the marketing strategy in Wijaya Kusuma Agro-Industry; 3) formulating marketing strategy that needs to be developed by Wijaya Kusuma Agro-Industry.
RESEARCH METHODS
Location and Time
This research was conducted in Wijaya Kusuma Agro-Industry, which located in Tambakmas Village Sukomoro District Magetan Regency, East-Java, Indonesia. It was selected as research location due to this agro-industry is the only one agro-industry, which produces candied pomelo peel continually. Moreover, this agro-industry wants to enlarge its market. Thus, the research location determined by purposive method. The research time was on February-March 2016.
Selected Respondent
Respondent in this research consisted of two groups, agro-industry respondent and consumer respondent. The first group was determined by using purposive method, where the key informant was owner and marketing department in Wijaya Kusuma Agro-Industry. While, the second group determined by using accidental sampling method. The indicator of consumer respondent was consumers that have
known and purchased “Kurmelo” (candied pomelo
peel) which produced by Wijaya Kusuma Agro-Industry. In determining respondent number of the second group, it was performed by using Hermawan (2008), who stated that method to determine respondent number in order to take research sample could be performed using 1:5 ratio. Where, one is variable that used in the research. Then, the research sample is 65 respondents.
Data analysis
1. Multiple linear regression analysis
Multiple linear regression analysis is an analysis used to analyze the extent of marketing strategy variables to the consumer purchase intention towards
“Kurmelo” (candied pomelo peel) in Wijaya
Kusuma Agro-Industry. Multiple regression analysis uses formula equation as below (Zikmud and Babin, 2013):
Yi = b0 + b1X1 + b2X2 + b3X3 + b4X4 + ei
Where:
Yi = Consumer purchase intention
b0 = Constant
b1 = Regression coefficient of X1 variable b2 = Regression coefficient of X2 variable b3 = Regression coefficient of X3 variable b4 = Regression coefficient of X4 variable X1 = Product variable
X2 = Price variable X3 = Distribution variable X4 = Promotion variable ei = Error
Data that obtained in this research then processed by using computer software of SPSS to result more accurate determination coefficient value. To obtain the best regression result, then it should meet statistical criteria as follow:
a. (R2) Determination Coefficient Test
̅
Where:
Y = observation value
y = estimated value from regression model
̅ = average value of observation
This R2value has range between 0 to 1 or (0 ≤ R2 ≤ 1). The larger value of R2 (closer to 1), the better of regression result. In contrast, the smaller value of R2 (closer to 1), the more independent variable completely unable to explain dependent variable (Sulaiman, 2002).
b. F Test
According to Sugiyono (2006), F test used to know simultaneous effect of independent variable to the dependent variable. To test the meaning of regression coefficient simultaneously, it is performed by using statistical test of F test with formulation as follows:
Where :
F = Obtained from distribution table K = Number of dependent variable R2 = Multiple determination coefficient N = Number of sample
a. If F-statistics < F-table, on confidence level of
95% (α = 0.05), then it is confirmed that all
independent variables (product, price, distribution, and promotion) has no significant effect to the dependent variable (consumer purchase intention). Therefore, alternative hypothesis (H1) rejected and null hypothesis (Ho) confirmed.
b. If F-statistics > F-table, on confidence level of
95% (α = 0.05), then it is confirmed that all
independent variables (product, price, distribution, and promotion) affected significantly to the dependent variable (consumer purchase intention). Therefore, alternative hypothesis (H1) confirmed and null hypothesis (Ho) rejected.
c. T-test
According to Sugiyono (2006), t test used to know the relationship between independent variable (X variable) and dependent variable (Y). T-test formulated as follows:
Where:
t = observation
n = number of observation r = correlation coefficient
With confidence level of 95% (α = 0.05), the
requirements are:
a. If t statistics > t table, then independent variable (product, price, distribution, promotion) has significant relationship to the dependent variable (consumer purchase intention).
b. If t statistics < t table, then independent variable (product, price, distribution, promotion) has no significant relationship to the dependent variable (consumer purchase intention).
2. Classical assumption test 1) Heteroscedasticity
Test method that used in this analysis is spearman correlation coefficient test. It is required that there is no heteroscedasticity on the regression model. To know whether or not heteroscedasticity, then it is seen from the output of heteroscedasticity test on its significance value. If significance value > alpha (0.05), then there is no heteroscedasticity, vice versa.
2) Autocorrelation
To detect whether or not autocorrelation, then it can be performed by using Durbin Watson (DW) test with the rules as follow:
1.65 < DW < 2.35 means there is not autocorrelation
1.21 < DW < 1.65 or 2.35 < DW < 2.79 means it cannot be concluded
DW < 1.21 or DW > 2.79 means there is autocorrelation
3) Multicollinearity
To know whether or not multicollinearity on the research data, it can be seen from VIF value. If VIF value larger than 10, then the variable has multicollinearity with other independent variable. For tolerance value, if it is closer to 0, then it is predicted to have multicollinearity. However, if it is closer to 1, then it is predicted to have no multicollinearity.
3. SWOT Analysis
Before it is conducted by SWOT analysis, first, it must be determined about internal factors that will be strength and weakness of a company as well as external factors that will be opportunity or threat for a company. These factors then weighed and rated as the stratification of importance.
a. EFAS and IFAS
Wheelen and Hunger (2004) in Solihin (2012) used EFAS and IFAS to assist environmental scanning in order to conduct analysis which able to give conclusion for managers and what kind of strategy that must be established by the company after studying the environmental scanning. IFAS and EFAS table come from SWOT analysis that been modified by Wheelen and Hunger by giving weight and rate to each factor which represents the importance level of a factor compared to the other factor. This following is IFAS and EFAS table which developed by Wheelen and Hunger:
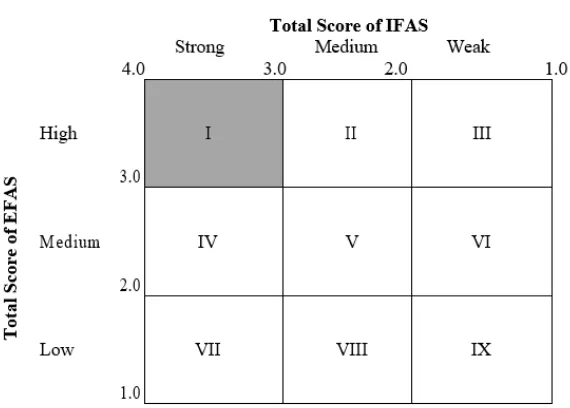
b. IE Matrix
In order to create map of current company position, it is conducted by using IR matrix (internal-external matrix). Value that obtained from IFAS and EFAS table then placed on IE matrix. Total IFAS weighed value in IE matrix placed on Y axis, while total EFAS weighed value placed on X axis.
c. SWOT Matrix
analysis and the result will be various depend on certain company. This following is relevant problems based on the potential about strength, weakness, opportunity, and threat.
Based on IFAS and EFAS table, then a company can perform formulation of strategy direction by using TWOS matrix which developed by Weihrich (Wheelen and Hunger, 2004). TWOS matrix developed based on SWOT analysis which will result many strategies (Solihin, 2012).
RESULTS AND DISCUSSION
Regression analysis
The first objective in this research was analyzing the effect of marketing strategy – product, price, distribution, promotion – to the consumer purchase intention by using multiple linear regression analysis. It resulted R-square value of 0.808 means 80.8% consumer purchase intention affected by product, price, distribution, and promotion variable and the remaining of 19.2% explained by other variables out of the model.
Several important points regarding regression analysis using SPSS are:
a. R2 (determination coefficient)
R2value has range between 0 to 1 (0 ≤ R2 ≤ 1). The model will have better fit to the data if R2 value is closer to 1. On the contrary, the that good R2value is (0 ≤ R2 ≤ 1).
b. F-Test
F-test used to know simultaneous effect of independent variable to dependent variable. From the result of SPSS, it was obtained that onfidence level of 95% (α = – –
relationship to the dependent variable – consumer
purchase intention towards “Kurmelo”. Therefore,
alternative hypothesis (H1) confirmed and null hypothesis (H0) rejected.
c. T-test
T-test used to know significant relationship between independent variable (X variable) to the dependent variable (Y variable). In this research, t table was 1.99834 and t statistics in each variable as follows: product variable 5.051; price variable 2.741; distribution variable 4.449; promotion variable 5.5125. T statistics value of independent variable (as mentioned above) larger than t table, then those four independent variables had strong relationship to the dependent variable (consumer purchase intention).
d. Classical Assumption Test 1) Autocorrelation
Durbin Watson value was 2.063. It means that there was no autocorrelation from the research data due to it meets the requirement of 1.65 < DW < 2.35. Thus, the conclusion was there was no autocorrelation.
2) Multicollinearity
It is stated as passed multicollinearity test if VIF value less than 10. VIF value in each variable as follows: product variable 1.526; price variable 1.434; distribution variable 1.506; promotion variable 1.581. VIF value in each variable was less than 10, thus the regression model passed multicollinearity test.
3) Normality Test
Data stated as passed normality test if skewness and kurtosis value meet the requirement of -2 < a < 2. Skewness value in this research was 0.229 and kurtosis value was 0.590, then data in this research distributed normally.
4) Heteroscedasticity Test
Heteroscedasticity test is a test that used to know whether or not heteroscedasticity of classical assumption in a research, which means variant inequality of residual for all observations in the regression model. Heteroscedasticity test is performed by seeing significance value of residual. It is stated as no heteroscedasticity if the value larger than alpha (0.05). Significance value to the product, price, distribution, and promotion variable was 1.00 (larger than 0.05). It means that each variable had no heteroscedasticity on its residual value. Thus, model that tested in this research passed classical assumption test of heteroscedasticity.
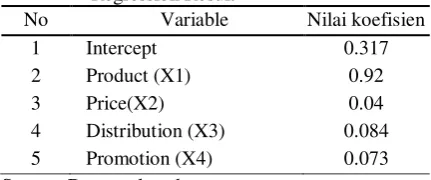
Table 1. Coefficient Value of Multiple Linear Regression Result
No Variable Nilai koefisien
1 Intercept 0.317
2 Product (X1) 0.92
3 Price(X2) 0.04
4 Distribution (X3) 0.084
5 Promotion (X4) 0.073
Source: Data analyzed
The Effect of “Product” Marketing Strategy to the Consumer Purchase Intention
The result of regression test showed that t-statistics of product variable (X1) was 5.051 larger than
t-table 1.99834 with significance value of 0.000 ≤
be explained by response stated by respondents that
“kurmelo” (candied pomelo peel) product which
produced by Wijaya Kusuma Agro-Industry has a good taste, appropriate texture, and natural color, thus the respondents intended to buy the product.
The Effect of “Price” Marketing Strategy to the Consumer Purchase Intention
Price that established for 100 g packaged “kurmelo”
(candied pomelo peel) is IDR 10,000. Thus, each
kilogram of “kurmelo” marketed for IDR 100,000.
The result of regression test showed that t-statistics of price variable (X1) is 2.741 larger than t-table
1.99834 with significance value of 0.008 ≤ 0.05. It
means that price variable (X2) affected significantly to the consumer purchase intention (Y). Price variable affected positively for 0.04 to the consumer purchase intention, which means that the increase of one rupiah of product price would increase consumer purchase intention for 0.04 (in which the increase of price should be normal). This positive effect also explained by many respondents, which stated that the price is appropriate (not too expensive and not too cheap). It was due to candied product was upper middle class snack, thus the established price would affect consumer purchase intention. However, according to coefficient value, price variable owned the smallest value than other variables in this research.
The Effect of “Distribution” Marketing Strategy to the Consumer Purchase Intention
The result of regression test showed that t-statistics of distribution variable (X3) was 4.449 larger than
t-table 1.99834 with significance value of 0.000 ≤
0.05. It means that distribution variable (X1) affected significantly to the consumer purchase intention (Y). Product variable affected positively for 0.084 to the consumer purchase intention, which means that the increase of one unit of distribution would increase consumer purchase intention for 0.084. Distribution marketing strategy, in fact, affected to the consumer purchase intention either direct distribution from producer to consumer, distribution with single agent, or using those two strategies together. The reason of respondents
intended to buy “Kurmelo” product with direct
distribution from producer is due to the lower price. Producer also has benefit to promote a new product
if there is available. Furthermore, the reason of
respondent intention in purchasing “Kurmelo” by
single agent is the easier way to get the product.
The Effect of “Promotion” Marketing Strategy to the Consumer Purchase Intention
The result of regression test showed that t-statistics of promotion variable (X4) was 5.125 larger than
t-table 1.99834 with significance value of 0.000 ≤
0.05. It means that promotion variable (X4) affected significantly to the consumer purchase intention (Y). Product variable affected positively for 0.073 to the consumer purchase intention, which means that the increase of one unit of promotion would increase consumer purchase intention for 0.073. Promotion activity, which affected to the consumer purchase intention, also mentioned by respondents that promotion activities such as advertising, publicity, sale promotion, and personal selling would affect consumer purchase intention. It was due to promotion activities; consumers would know better about the products and intended to purchase the products.
SWOT Analysis
Second objective in this research is describing internal and external factors that affected to the marketing strategy in Wijaya Kusuma Agro-Industry. The result is follows.
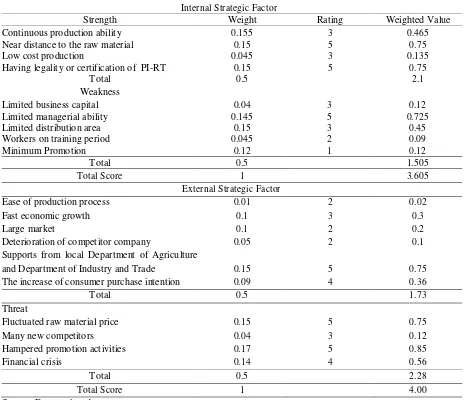
Table 2. Internal Factor (IFAS) and External Factor (EFAS)
Internal Strategic Factor
Strength Weight Rating Weighted Value
Continuous production ability 0.155 3 0.465
Near distance to the raw material 0.15 5 0.75
Low cost production 0.045 3 0.135
Having legality or certification of PI-RT 0.15 5 0.75
Total 0.5 2.1
Weakness
Limited business capital 0.04 3 0.12
Limited managerial ability 0.145 5 0.725
Limited distribution area 0.15 3 0.45
Workers on training period 0.045 2 0.09
Minimum Promotion 0.12 1 0.12
Total 0.5 1.505
Total Score 1 3.605
External Strategic Factor
Ease of production process 0.01 2 0.02
Fast economic growth 0.1 3 0.3
Large market 0.1 2 0.2
Deterioration of competitor company 0.05 2 0.1
Supports from local Department of Agriculture
and Department of Industry and Trade 0.15 5 0.75
The increase of consumer purchase intention 0.09 4 0.36
Total 0.5 1.73
Threat
Fluctuated raw material price 0.15 5 0.75
Many new competitors 0.04 3 0.12
Hampered promotion activities 0.17 5 0.85
Financial crisis 0.14 4 0.56
Total 0.5 2.28
Total Score 1 4.00
Source: Data analyzed
The result of lowest weight value towards external factor of opportunity is ease of production process, while the highest weight value is to supports from local Department of Agriculture and Department of Industry and Trade. The high weight value show high importance level, which would affect marketing strategy formulation as well as company position determination on IE matrix, while low weight value showed low importance level. In the external factor of threat, the highest weight value was hampered promotion activities and the lowest weight value was many new competitors. The highest rating towards external factor of opportunity was supports from local Department of Agriculture and Department of
Industry and Trade with rating of 5, while the highest rating towards external factor of threat was hampered promotion activities and fluctuated raw material price with rating of 5.
Figure 1. The result of IE Matrix towards Wijaya Kusuma Agro-Industry
The result of IE matrix showed that current agro-industry position is in sel I, it means that, this time, strategies that need to be taken by Wijaya Kusuma Agro-Industry are market penetration, market development, and product development strategy.
After knowing company position, the next step was formulating strategy by using SWOT analysis. This following is the result of SWOT analysis by considering internal and external factors of the company:
Internal
Factors
External Factors
Strength (S) 1. Continuous production 2. Near to the raw materials 3. Low costs production
4. Legal certification products from government
Weakness (W)
1. Limited capital for the business 2. Limited managerial ability 3. Limited distribution area 4. Less competent workers 5. Less promotion conducted
Opportunity (O)
1. Easiness of production process
2. Fast economic growth 3. The high potential market 4. Less competitor available 5. Government support
6. Increasing purchasing power of consumers
SO strategies:
1. Increasing production capability (S1, O1)
2. Production efficiency due to the strategic location of raw materials (S2, O2)
3. Market expantion due to decreasing performance of competitor and incrasing the company competitiveness (S1, S3, O3, O4)
4. Increasing labelling achieved for making thrust to the product (S4, O5, O6)
WO strategies:
1. Incrreasing capital of the company (W1, O2, O5)
2. Trainning of managerial capability (W2, O4)
3. Utilizing potential market by increasing performance of distribution (W3, O3)
4. Increasing partnership with local government (W4, O1, O5) 5. Increasing promotion for
market penetration (W5, O6)
Threats (T)
1. The price fluctution of raw materials
2. Emerging the new competitor 3. Marketing problem due to
external factor 4. Economic crisis
ST strategies:
1. Increasing partnership with orange farmers (S1, S2, T1) 2. Increasing promotion (S3, T3) 3. Increasing competitiveness
due to lower production cost (T2, T4, S3, S4)
4. Using labels of the product to build barrier to entry to the market (S4, T2)
WT strategies:
1. Budget arragement for efficiency (W1, T1, T4)
2. Increasing distribution and promotion (W3, T3, W5) 3. Increasing managerial trainning
for company’s human
development
4. Partnership with other companies (W1, T2)
CONCLUSION
1. Analysis result showed that the effect of marketing strategy to the consumer purchase intention was marketing strategy of product, price, distribution, and promotion affected significantly to the consumer purchase
intention towards “Kurmelo” (candied pomelo
peel) with the detail of each variable as follows:
Product variable affects consumer purchase intention significantly with coefficient value of 0.09 and confidence level of 100%. It means that the increase of one unit of product would increase consumer purchase intention for 0.09.
Price variable affects consumer purchase intention significantly with coefficient value of 0.04 and confidence level of 99.2%. It means that the increase of one unit of price would increase consumer purchase intention for 0.04.
Distribution variable affects consumer purchase intention significantly with coefficient value of 0.08 and confidence level of 100%. It means that the increase of one unit of distribution would increase consumer purchase intention for 0.08.
Promotion variable affects consumer purchase intention significantly with coefficient value of 0.07 and confidence level of 100%. It means that the increase of one unit of promotion would increase consumer purchase intention for 0.07.
2. Internal factors, which affected to the marketing strategy and became the advantage of Wijaya Kusuma Agro-Industry were: Continuous production ability, near distance to the raw material, low cost production, having legality or certification PI-RT. Internal factors, which became weakness of Wijaya Kusuma Agro-Industry were limited business capital, limited managerial ability, limited distribution area, workers on training period, and minimum promotion.
External factors, which affected to the marketing strategy and became opportunity for Wijaya Kusuma Agro-Industry are ease of production process, fast economic growth,
large market opportunity, deterioration of competitor company, supports from the government, the increase of consumer purchase intention.
External factors, which became threat in Wijaya Kusuma Agro-Industry were fluctuated raw material price, many new competitors, hampered promotion activity, financial crisis.
3. Marketing strategy formulation for Wijaya Kusuma Agro-Industry as the result of SWOT analysis explained as follows:
SO strategy (optimizing strength to cope with weakness) conducted by improving production ability, making efficient distance of raw material (thus it will be able to reduce production cost), optimizing efficient production cost to take market opportunity by the competitor deterioration, adding other legality or certification (Halal label) to increase consumer purchase intention.
WO strategy (overcoming weakness to take opportunity) conducted by increasing business capital, managerial training by studying the cause of competitor deterioration, enlarging distribution area by taking market opportunity, conducting training to the workers by performing cooperation with local Department, improving promotion to attract consumer purchase intention.
ST strategy (optimizing strength to cope with threat) conducted by cooperating with pomelo farmers, conducting sale or product promotion, optimizing production cost in order to be able in competing with competitors, using legality or certification as advantage to anticipate
competitor’s threat.
WT strategy (overcoming weakness to cope with threat) conducted by implementing budget-planning, enlarging distribution area and improving promotion, conducting managerial training for human resource in order to be able in competing with other companies, conducting cooperation with other companies.
to increase consumer purchase intention. Price addition also suggested, however, it must be conducted on normal line, also it is suggested to enlarge marketing area and to improve promotion activity in order to introduce the product to consumers. Suggestion towards marketing strategy that may be implemented is adding other legality or certification (Halal label) in order to increase consumer purchase intention. While, in order to improve promotion activity to attract consumer purchase intention, it may be conducted through cooperation with pomelo farmers and enlarging distribution area.
REFERENCES
Amalia, lia. 2006. Peranan Agroindustri dalam Pemulihan Perekonomian Indonesia Pasca Krisis Ekonomi. Jurnal InovasiTM Vol 5, No. 1
Ferrel dan Hartline. 2014. Marketing Strategy Text and Cases. South-Western. Australia. Hermawan, Agus. 2012. Komunikasi Pemasaran.
Erlangga. Jakarta.
Hermawan, Asep. 2008. Penelitian Bisnis Paradigma Kuantitatif. PT Grasindo. Jakarta.
Solihin, Ismail. 2012. Manajemen Strategik. Erlangga. Jakarta.
Sugiyono. 2006. Metode Penelitian Kuantitatif, Kualitatif dan R&D (Qualitative and Quantitative Research Methods). Alfabeta. Bandung.
Sulaiman, Wahid.2002. Jalan Pintas Menguasai SPSS. Andi. Yogyakarta.
Wheelen dan Hunger. 2004. Strategic Management and Business Policy. Pearson Education. New Jersey.