ANALYSIS THE EFFECT OF MARKETING MIX
IN PURCHASING DECISION OF GROWING UP
MILK (GUM) ON THREE SOCIO-ECONOMIC
CLASSES IN MALANG
Sunardi
1, Jabal Tarik Ibrahim
2, Anas Tain
31Postgraduate Student of Magister Agribisnis UMM 2Professor and Lecturer of Magister Agribisnis UMM
3Lecturer of Magister Agribisnis UMM
*corresponding author: [email protected]
ABSTRACT
: The changing of consumer behavior is one of the attractive topic in consumer research. The dynamic of consumer behavior could be part that is caused the shorter life cycle product. Then, proper mapping of consumer’s socio-economic class is important thing to enable manufacturers in providing the best product according to customer expectation. The research aims to obtain an explanation about the effect of marketing mix (product, price, place and promotion) towards purchase decision of Growing Up Milk (GUM) products on three socio-economic classes (lower, middle and upper class) and to discover the differences among those three classes. The study was conducted in Malang using questionnaire and data processed by using Partial Least Squares as an alternative to the Structural Equation Modeling. The results showed that one of the marketing mix whis is product significantly affect purchase decision of GUM across the three classes. Price had significant effect to the purchase decision only at lower and upper class. Furthermore, place and promotion do not significantly affect the purchase decision across all classes. Variation change in endogenous variable (purchase decision) could be explained by exogenous variables (marketing mix), for 64.8% (upper), 48.3% (middle) and 49.9% (lower), respectively. Multi Group Analysis (MGA) showed that there are no significant differences between middle and lower class. A significant differences between upper class and middle class and also between upper class and lower class place on product and price. Upper class tends to purchase GUM due to its quality instead of product design and packaging. Price discount and lower price are not the main factors considered for the upper class.Keywords: Marketing Mix, Purchase Decision, Growing Up Milk Product, Partial Least Squares (PLS), Socio-Economic Class of Consumer
INTRODUCTION
Nielsen data shows that market size of milk products in Indonesia is tremendous and its business value even reaches IDR 40 trillion PER year. Milk powder and infant formula are dominant products and contribute consecutively 38% and 15% from the total value (SWA, 2012). Delgado et al., (1999) stated that in line with population growth, lifestyle changes, nutritional awareness and improvement of education level, demand over milk continues to rise.
Indonesia is in the early period of high economic growth, creating a wave of new Middle-class and Affluent Consumers (MACs)
that will grow in both size and purchase power through 2020 according to a new report by The Boston Consulting Group (BCG). With the fourth-biggest population in the world (including a high proportion of working-age people), stable political environment and strong local demand, Indonesian economy is currently growing at 6.4 percent a year. Such growth is lifting millions from lower socio-economic income level into the MAC category (BCG, 2013)
determining product or brand's offering in the market.
Purchase decision is a process which goes through customers when they buy a product. It can be seen as particular form of cost–benefit analysis. Purchase decision model has gone through a lot of interpretations.
Previous research about consumer behavior of milk products was conducted by Setiyanti et al., (2009) on "Marketing Strategy of Clinical Enteral Nutrition to the Dairy Products" which conducted through five hospitals in Jakarta. That research concluded that there were several factors – educational background, monthly household expenditure and product availability – which quite prominent on consumer behavior when they consumed dairy products. The weakness from this study is less extensive research location, which only conducted through five hospitals in Jakarta.Thus, it can be extended to the larger hospital area that has patients with lower to middle socio-economic class and will results in different opinion to the use of infant nutrition with premium price.
Two main objectives in this research were: to obtain an explanation about the effect of marketing mix towards purchase decision of Growing Up Milk products on consumers from three – upper, middle and lower – socio-economic classes in Malang and to determine the difference and similarity toward purchase decision of the product among those three socio-economic classes.
RESEARCH METHOD
Subject, object and research location
This research subject was households that purchases growing up milk products for children aged 1-12 years old. While the research object has wide range of socio-economic class.
Quotation of socio-economic class
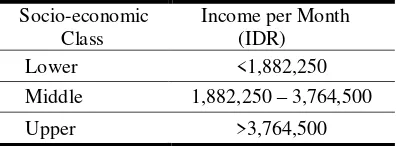
Family income is the most significant factor that affects children's milk consumers (Sunarti, 2006). In this study, socio-economic class referred to the income per month and referred to
Minimum Wages (MW) of Malang in 2015. MW calculated based on the needs of Decent Living (DL) parameters, means that people with income at MW level will be able to meet the standard needs of a Decent Living. Minimum Wage of Malang in 2015 was IDR 1,882,250 related to East Java Governor Regulation No. 72 Year 2014 About Minimum Wage District / Municipality in East Java.
Table 1. Socio-economic class distribution based on income per month
Socio-economic Class
Income per Month (IDR)
Lower <1,882,250
Middle 1,882,250 – 3,764,500
Upper >3,764,500
Hypothesis
Data that used in this study was primary data (questionnaire) taken by purposive sampling technique.
Figure 1. Framework Analysis
Number of respondents for each socio-economic class was 100 respondents. To test the hypothesis, it is used Partial Least Squares (PLS) analysis as an alternative to Structural Equation Modeling (SEM) with framework analysis as showed on Figure 1.
Research Variable and Instrument
Indicators are variables which observed and called as manifest variables. It was recommended that the researchers used four or more variables. If it only uses two variables, the analysis will be problematic. In relation with this case, if it only uses one measurement, then error will be occurred in the model. Model that only uses two indicators per latent variable will be difficult to identify (unidentified) and the error estimation will not be reliable.
Latent variable is variablewhich indirectly observedin the research and so called constructs that were measured using indicators. Latent variable includes independent, intermediaries and dependent variables. Meanwhile, construct is kind of specific concept in a higher level of abstraction and created for the purpose of certain theory. A concept is consciously produced by scientists for scientific purposes.
Exogenous variable is independent variable with no previous cause. Endogenous variable is variable that can be functioned as an intermediate to the effect of other exogenous variable and is the cause of other intermediate and dependent variables.
In this study, there were four exogenous variables that would be analyzed by 4Ps: Product, Price, Place, Promotion and one endogenous variable namely purchase decision. Each variable would be developed into some questions and accompanied by five alternative answers that would be measured using Likert scale with the weight value of 1 for the answer of "Strongly disagree" to 5 for the answer of "Strongly agree". Data from Likert scale was ordinal data, so it needs to be changed into interval data by using Method Successive Interval (MSI) that commonly used in the measurement transformation. Interval data was then processed by using PLS as part of SEM.
Validity and Reliability Test
A validity measure correlates with level of accuracy or precision achieved by an indicator in the assessment or accuracy measurement of what is supposed to be measured (Ferdinand, 2005). Validity test conducted by using convergent validity test with reflective indicators assessed based on loading factor (correlation between item score/ component score with constructs score). Validity also measured by discriminant validity test that assessed by cross loading
measurement of the construct. Discriminant validity relates to the principle where indicators from different constructs should not be highly correlated.
Reliability is an index indicating the extent of measurement device (in this study, it was questionnaire which was an indicator of variable or construct) can be trusted or relied (Singarimbun, 1995). Reliability indicates consistency of measurement result in case of gauges that used by different people at the same time or used by the same person at different times. Technique that used to calculate reliability index in this study was PLS as Composite Reliability.
Data Test
Data analysis in this research used PLS as an alternative to SEM. Software that used for this analysis wasSmartPLS version 3.0. According to Abdillah and Jogiyanto (2015), measurement test model used to validate the research model. Two main parameters are construct validity test (convergent and discriminant validity) and internal consistency test (reliability). Convergent validity test parameter can be seen from Average Variance Extracted (AVE) which should be > 0.5. Discriminant validity test to the appraised value of composite reliability should be > 0.7.
RESULT AND DISCUSSION Overview of Research Location
This research was conducted in Malang, East Java Province. Malang consists of 5 districts namely Blimbing, Klojen, Sukun, Kedung kandang and Lowokwaru. Malang population in 2014, based on data from Population and Civil Registration Agency, was 865,011 people that spread over 57 villages. The number of children aged 1-12 years in 2014 reached more than 180 thousand or about 20% from total population and close to the national profile. The number of families in the same year was 204,179 families.
Descriptive Statistics
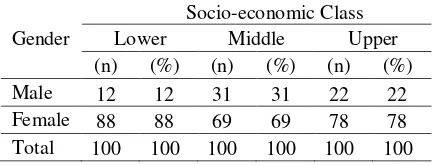
Respondents on all socio-economic classesdominated by female with proportion of 69% - 88% from total respondent as presented in Table 2. It was due to, in general, women take responsibility over the provision of household consumption, in which it is in line with the statement of Engel., et al (1994).
Table 2. Respondent distribution by gender
Gender
Socio-economic Class
Lower Middle Upper
(n) (%) (n) (%) (n) (%)
Male 12 12 31 31 22 22
Female 88 88 69 69 78 78 Total 100 100 100 100 100 100
According to Suryani (2012), education is one of variables that often used as indicator in measuring social class. In general, the higher education level, the higher social class they owned. Higher education will also provide opportunity and better access to the employment. Table 3 showed that total respondenton upper socio-economic class with Bachelor, Master and Doctoral degree was very high at 87%, while on lower socio-economic class was only 34%. As many as 41% respondents on lower socio-economic class had high school education, while on upper socio-economic class was only 9% for high school education level.
Table 3. Respondent Distribution by Education Level
Education
Socio-economic Class
Lower Middle Upper
(n) (%) (n) (%) (n) (%) High
School 41 41 33 33 9 10 Bachelor
Degree 34 35 52 53 62 63 Master
Degree 0 0 5 5 18 19
Doctoral
Degree 0 0 1 1 5 5
Others 24 24 8 8 3 3
Total 99 100 98 100 97 100
Table 4. Showed that total combination from the three jobs – private worker (25%), bureaucrat (41%) and entrepreneur (13%) – was equal to 79% on upper socio-economicclass, while on lower socio-economicclass was only 51% (sum of 38%, 3% and 14%).
Table 4.Respondent Distribution by Job
Job
Socio-economic Class Lower Middle Upper (n) (%) (n) (%) (n) (%) Private
Worker 38 38 41 41 23 25
Bureaucrat 3 3 24 24 38 41 Entrepreneur 14 14 9 9 12 13 Others 45 45 26 26 19 21 Total 100 100 100 100 92 100
The researcher also added other respondent profiles to explain better about the differences of respondent characteristicamong those socio-economic classes as follow: (1) Electrical Power, data showed that majority upperclass respondents (76%) installed 1300 watt - 2200 watt electrical power for their home needs, while the lower class respondents (up to 81%) dominated 450 watts - 900 watts; (2) Cooking fuel, data showed that most of the upper class tends to use 12 kg LPG as cooking fuel with proportion of 55% which was much higher than the lower class that was only 7%. Majority lower class (87%) used 3 kg LPG as cooking fuel for their households due to that kind of LPG subsidized by government so that it has lower price. Moreover, on lower socio-economic class, there were respondents who use firewood as their cooking fuel. It might be occurred because some respondents stay in the sub-urban or even in the countryside area of Malang; (3) Size of house building, mostly house building area of 250 m2 - 500 m2 owned by the upperclass (63%) compared to the lower class which only 18%. For 78% respondents of the lower class owned house size of 50 m2 - 75 m2; (4) Land size, mostly land size of 500 m2 - 1000 m2 owned by the upper class which also tend to be higher at 49% compared to the lower class that only 18%. Most of the lower class (79%) owned land size of 100 m2 - 250 m2.
Inferential Statistics
and (2) structure model (inner model) (Abdillah and Jogiyanto, 2015).
Outer model is measurement model to assess validity and reliability of the model. Through iteration process (gradual estimation technique to generate the best value), it can generate algorithm parameter measurement model (convergent validity, discriminant validity and composite reliability). Inner model is structural model that used to predict causal relationship between latent variables. Through bootstrapping process (repetitive sampling or re-sampling method), test parameter of tstatistics applied to
predict the existence of causality.
To simplify the result presentation in this study, detail analysis phase would only be applied on upper socio-economic class, while on middle and lower class would only be presented by its final result in the inner analysis results.
Outer testing model (measurement model) on upper socio-economic class
Build Conceptual Model Analysis of Structural Equation conducted by usingSmartPLS Program. Structural analysis model was built in the first phase of this research and continued with determination of structural model coefficient.
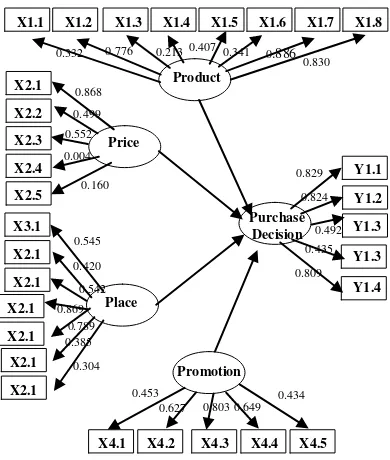
Structural ModelCoefficient Determination
The result of structural model coefficient determination showed in Figure 2.
Figure 2. Structural Model Coefficient Equation
A concept and model of studycannot be tested in predictive relational and causal relationshipmodel if it is not passed purification stage in the measurement model. The model itself used to test construct validity and instrument reliability. Validity test was conducted to determine ability of research instrument in measuring what it should be measured. Instrument reliability test used to know measurement instrumentconsistency in measuring a concept or it can also be used to measure respondentconsistency in answering questionnaire.
Discriminant validity to the measurement principle of different construct should not be correlated with its height. Discriminant validity occurred when two different instruments measure two different uncorrelated predicted constructs and produce uncorrelated scores. Discriminant validity assessed by measuring construct cross loading, in which cross loading > 0.7 is considered to have good discriminant validity.
ValidityTest - Convergent Construct Validity
Construct validity test consists of convergent validity and discriminant validity test. The validity indicates how well the result obtained from the use of an appropriate measurement theory which used to define a construct.
In PLS with reflective indicator, convergent validity can be assessed by outer loading factor (correlation between item score/component score with construct score). Convergent validity can also be measured by Average Variance Extracted (AVE). Loading factor (original sample (O)> 0.5 is considered as significant.
Convergent validity test with outer loading used to know that there are several indicators that do not meet the criteria, which is indicator with original sample value (O) <0.5 and a p-value> 0.05, as X1.1, X1.3, x1.5, X1.6 (latent variable indicator of product), X2.4, X2.5 (latent variable indicator of price), X3.2, X3.1, X3.6, X3.7 (latent variable indicator), X4.2, X4.1, X4.5 (latent variableindicatorof sale), Y1.4, Y1.3 (latent variable indicator of purchase decision). Unstandardizedsample beta of original score used to view predictive properties of independent variable on dependent variable, either positive or negative. Some of these indicators wereinvalid, so it could not be included in the test.
Table 5 showed the results of convergent validity using ave indicator after eliminating all invalid indicators
AVE Remark
Product 0.740 valid
Price 0.508 valid
Place 0.628 valid
Promotion 0.550 valid
Purchase
Decision 0.738 valid
Convergent Validity Test conducted by eliminating all invalid indicators with low outer loading score (<0.5) and p-value> 0.05 such as X1.4 (latent variables indicator of product) and X4.2 (latent variable indicator of sale).
Convergent validity test that conducted using AVE indicator resulted in latent variables with AVE scale value <0.5, thus, it needs re-estimation by eliminating invalid indicators such as X1.4 (latent variable indicator of product), X4.2 (latent variable indicator of promotion).
Convergent validity test with AVE after re-estimation was conducted by eliminating invalid indicators such as X1.4 (latent variable indicator of product), X4.2 (latent variable indicator of sale) and resulted AVE scale > 0.5; thus, it could be stated that all indicators were valid for each marketing mix variables. Furthermore, structural model coefficient was calculated after it was conducted by validity and reliability test.
Figure 3. Structural model coefficient after eliminating invalid indicators
Construct Validity Testusing Discriminant From the result ofcross loading discriminant validity test, it could be seen that the gauge of different construct did not correlate with its height (indicated by number that placedinside the box with dash line).
Table 8. The Result of Construct Validity Test using Discriminant Validity
Price
Pur-chase Decision
Pro-duct
Promo-tion Place
X1.2 0.590 0.690 0.854 0.418 0.293 X1.7 0.376 0.594 0.897 0.457 0.403 X1.8 0.291 0.563 0.829 0.471 0.354 X2.1 0.776 0.650 0.541 0.249 0.255 X2.2 0.658 0.312 0.147 0.101 0.129 X2.3 0.699 0.316 0.214 0.060 0.182 X3.3 0.082 0.159 0.200 0.435 0.644 X3.4 0.059 0.213 0.377 0.429 0.891 X3.5 0.148 0.249 0.355 0.214 0.823 X4.3 0.046 0.251 0.200 0.636 0.404 X4.4 0.261 0.350 0.526 0.834 0.266 Y1.1 0.618 0.886 0.636 0.328 0.176 Y1.2 0.532 0.848 0.623 0.325 0.255 Y1.5 0.564 0.844 0.600 0.406 0.260
Reliability
Reliability test was conducted by using composite reliability.
Table 9. The Result of Composite Reliability Test
Composite
Reliability Remark
Product 0.895 Reliable
Price 0.755 Reliable
Place 0.833 Reliable
Promotion 0.706 Reliable
Purchase Decision 0.894 Reliable
In addition to validity test, PLS is also used as reliability test to measure internal consistency of measurement tools. Reliability indicates accuracy and consistency from measurement instrument. In PLS method, composite reliability test must have composite reliability value greater than 0.7, even if the value of 0.6 is acceptable. But, in real, internal consistencytest is not absolutely necessary if construct validity has completed, as valid and reliable construct (Cooper et al in Abdillah and Jogiyanto, 2015).
Inner Model Test (Structural Property Test)
Inner analysis model (structural test model) is conducted to see the relationship between endogenous constructs with exogenous constructs based on the results of data processing. The relationship tested by using
value of tstatistics (validity correlation),
significance level, the most dominant weighting factorand value of R2 (coefficient determination) which is close relationship models.
Further reflective construct analysis of structural test model used to predict causal relationships between variables or hypothesis test. In this test, PLS Path Coefficient (mean, STDEV and tstatistic) and p-value would be
counted. According to Abdillah and Jogiyanto (2015), significance level of hypothesis uses comparative value of ttable and tstatistics. If tstatistics
value higher than ttable value then hypothesis is
accepted. For 95 percent confidence level (alpha 5 percent), this research resulted ttable for
two-tailed hypothesis >/= 1.96 and one-two-tailed hypothesis> / = 1.64.
Table 10. The results of path coefficient and p-value on upper socio-economic class
Original Sample
(O)
tstatistics
(|O/STERR|) PValues Product Purchase
Decision * 0.476 5.271 0.000
Price Purchase
Decision * 0.413 4.882 0.000
Place Purchase
Decision 0.018 0.215 0.830
Promotion Purchase
Decision 0.062 0.754 0.451
The Result of hypothesis test to the consumers on upper socio-economic class:
H1: marketing mix (product) affect purchase decisionof GUM on upper class consumers in Malang.
Result: H0 is rejected, because tstatistic
(5.271)>ttable (1.960) and p-value (0.000) <0.05
means that product significantly affects purchase decision on upper class consumers in Malang. H2: marketing mix (price) affects purchase decision of GUM on upper class consumers in Malang.
Result: H0 is rejected, because tstatistic
(4.882)>ttable (1.960) and p-value (0.000) <0.05
means that price significantly affects purchase decision on upper class consumers in Malang. H3: marketing mix (place) affects purchase decision of GUM on upper class consumers in Malang.
Result: H0 is accepted, because tstatistic (0.754)
<ttable (1.960) and p-value (0.451)> 0.05 means
H4: marketing mix (promotion) affects purchase decision of GUM on upper class consumers in Malang.
Result: H0 is accepted, because tstatistic (0.215)
<ttable (1.960) and p-value (0.830)> 0.05 means
that promotion does not significantly affect purchase decision on upper class consumers in Malang.
The result R-Square (R2) value in Structural Test Model (Inner Model) is as follows:
Table 11. R-Square value in structural test model R Square Purchase Decision 0.648
Determination coefficient used to describe proportion of dependent variable which can be explained by independent variable. Determination coefficient value is 0 <R2<1. If R2 value is small means that exogenous variable has limited ability in explaining endogenous variable. If the value close to one means that independent variable (exogenous) provides almost all needed informationto predict dependent variable (endogenous).
From data analysis above, it is found that R2 value is equal to 64.8%; it means that variation of endogenous variables (purchase decision) could be explained by the exogenous variables (marketing mix) for 64.8%, while the rest (35.2%) was explained by other variables outside the model that proposed by this study, i.e., family, life style, groupreference and role status.
All hypothesis on middle class were rejected except for H1 to H0 (product) because tstatistic
(6.672)>ttable (1.960) and p-value (0.000) <0.05,
so that, the product significantly affects purchase decision on middle socio-economic class consumers in Malang, while R2 value is 48.3%.
Moreover, all hypothesis on lower class is rejected except for H0 to H1 (product) becausetstatistic (6.898)>ttable (1.960) and p-value
(0.000) <0.05; and H2 (price) because tstatistic
(2.103)>ttable (1.960) and p-value (0.036) <0.05,
so that, product and prices significantly affects purchase decision on lower socio-economic class consumers in Malang, while R2 vaue is 49.9%.
Multi Group Analysis (MGA)
Group analysis such as age, gender and country is common model needs and it can be conducted by SmartPLS (Lowry and Gaskin, 2014). In this
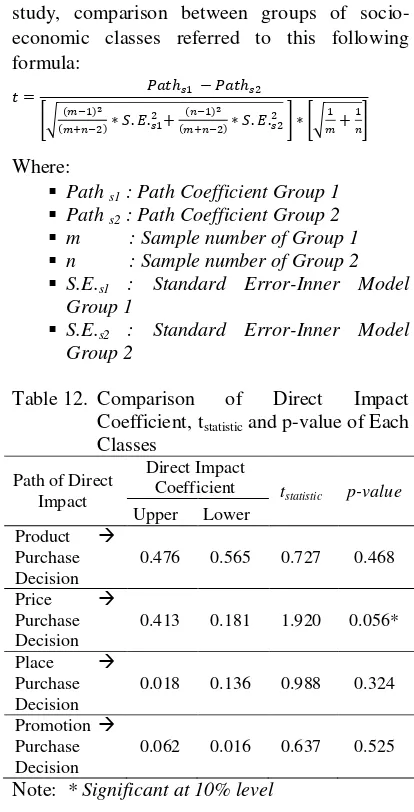
study, comparison between groups of socio-economic classes referred to this following formula:
[√( )( ) ( )( ) ] [√ ]
Where:
Path s1 : Path Coefficient Group 1 Path s2 : Path Coefficient Group 2 m : Sample number of Group 1
n : Sample number of Group 2
S.E.s1 : Standard Error-Inner Model Group 1
S.E.s2 : Standard Error-Inner Model Group 2
Table 12. Comparison of Direct Impact Coefficient, tstatistic and p-value of Each
Classes
Path of Direct Impact
Direct Impact
Coefficient tstatistic p-value Upper Lower
Product Purchase Decision
0.476 0.565 0.727 0.468 Price
Purchase Decision
0.413 0.181 1.920 0.056* Place
Purchase Decision
0.018 0.136 0.988 0.324 Promotion
Purchase Decision
0.062 0.016 0.637 0.525 Note: * Significant at 10% level
The purpose of this MGA is to compare the effect of marketing mix to purchase decision among socio-economic classes. The comparison was conducted respectively as follows. Comparison is conducted between Upper and Middle Class, Middle and Lower Class and Upper and Lower Class.
The analysis is performed by calculating each tstatistics and p-value. The results of this
analysis represented in Table 12 about the comparative effect of marketing mix toward purchase decision on upper and lower class
Differences in perception between upper and lower class could also be explained by comparing the result of descriptive analysis of questionnaire through indicator X2.2 and X2.3 (price variable) as follows. X2.2. "I always buy GUM product because the price is cheaper than other products"
Table 13. Comparison of consumer statement in each classes
Consumer Statement
Socio-economic Class Upper
(%)
Middle (%)
Lower (%) Strongly Disagree &
Disagree 66 42 36
Neutral 13 15 17
Strongly Agree &
Agree 21 43 47
Dominant attitude on upper class had statement of ‘strongly disagree’ and ‘disagree’ for 66%, while the same attitude on middle and lower class only 42% and 36%, respectively. This result shows that the upper class has different attitude to the middle and lower class towards the statement of X2.3. "I always buy the product because there is a rebate (discount)".
CONCLUSION AND SUGGESTION
Based on data analysis in this research, the several conclusions can be obtained as follow: 1. Product and price variable are elements of
marketing mix that significantly affect purchase decision of GUM on upper and lower class in Malang, while for middle class, the variable of marketing mix is only product. 2. Similarity, among consumer class (upper, middle and lower), marketing mix of product is significantly affecting purchase decision of GUM product.
3. MGA shows that the differences between upper and middle class toward purchase decision of GUM product are on product and price variable of marketing mix. MGA also shows that the difference between upper and lower class toward purchase decision of GUM product is on price variable. However, there is no difference between lower and middle class regarding purchase decision of GUM product in Malang.
REFERENCES
Abdillah, Willy dan H.M., Jogiyanto. (2015). Partial Least Square Alternatif Structural Equation Modeling (SEM) Dalam Penelitian Bisnis. Yogyakarta: Andi Offset.
Bartosevicien V., L. Gudonavicius, G. Saparnis. (2005). Statistical Analysis of Milk
Products Consumers’ Behavior.
Engeering Economics. Vol 2. (42):62-70.
Cooper, D. R, and Pamela S. S. (2001). Business Research Methods, 7th Edition, Homewood: Mc. Graw – Hill.
Delgado, C., M. Rosegrant, H. Steinfeld, S. Ehui, and C. Courbois. (1999). Livestock to 2020. The Next Food Revolution. Washington DC: International Food Policy Research Institute (IFPRI), FAO., and ILRI.
Engel, James. F; Roger D. Blackwell and Paul W. Miniard. (1994). Perilaku Konsumen Jilid 1. (Diterjemahkan oleh: Budiyanto). Jakarta: Binarupa Aksara.
Ferdinand, Augusty. (2005). Structural Equation Modeling Dalam Penelitian Manajemen, Edisi 2, Semarang: Bagian Penerbitan UNDIP.
J. Paul Peter, Jerry C. Olson. (2013). Perilaku Konsumen dan Strategi Pemasaran Edisi 9 – Buku 1(Consumer Behavior and Marketing Strategy, 9th editon.), Penerjemah : Diah Tantri Dwiandani, Jakarta: McGraw-Hill Education and Salemba Empat.
Kotler, Philip and Keller, Kevin-Lane. (2008). Marketing Management (Manajemen Pemsaran), 13th Edition, Jakarta: Gelora Aksara Pratama.
_____, Philip. & Armstrong, Garry. (1997). Principles of Marketing (Dasar-Dasar Pemasaran) . Jakarta: Prenhallindo.
Lowry, Paul Benjamin and Gaskin, James. (2014). Tutorial: Partial Least Squares (PLS) Structural Equation Modeling (SEM) for Building and Testing Behavioral Causal Theory: When to Choose It and How to Use It, IEEE Transactions On Professional Communication, Vol. 57, No. 2, June 2014.
Report of The Boston Consulting Group (BCG), (2013): Asia’s Next Big Opportunity:
Indonesia’s Rising Middle-Class and
Affluent Consumers).BCG. http://www.bcg.com/media/PressReleaseD etails.aspx?id=tcm:12-129295
Sejati, W.K. dan Rusdiana, S. (2009). Upaya Pengembangan Agribisnis Sapi Perah Dan Peningkatan Produksi Susu Melalui Koperasi Susu (Measures for Dairy Cattle Agribusiness Development and Milk Production Enhancement Through Dairy Co-Operatives Empowerment). Jurnal Forum Penelitian Agro Ekonomi, Bogor,Volume 27 No. 1, Juli 2009 :43-51
Setiyanti, Ety Sri, Agus Maulana, dan Idqan Fahmi . (2009). Strategi Pemasaran Produk Susu Nutrisi Enteral Klinikal, Jurnal Manajemen & Agribisnis, IPB, Vol 6 No. 2 tahun 2009
Singarimbun, Masri. (1995). Metode Penelitian Survei, Edisi 2, Jakarta: LP3ES.