Measuring the Movement of a Research Paradigm
Chaomei Chen
College of Information Science and Technology, Drexel University, 3141 Chestnut Street,
Philadelphia, PA 19104-2875, USA
ABSTRACT
A research paradigm is a dynamical system of scientific works, including their perceived values by peer scientists, and governed by intrinsic intellectual values and associated citation endurance and decay. Identifying an emerging research paradigm and monitoring changes in an existing paradigm have been a challenging task due to the scale and complexity involved. In this article, we describe an exploratory data analysis method for identifying a research paradigm based on clustering scientific articles by their citation half life and betweenness centrality as well as citation frequencies. The Expectation Maximization algorithm is used to cluster articles based on these attributes. It is hypothesized that the resultant clusters correspond to dynamic groupings of articles manifested by a research paradigm. The method is tested with three example datasets: Social Network Analysis (1992-2004), Mass Extinction (1981-2004), and Terrorism (1989-2004). All these subject domains have known emergent paradigms identified independently. The resultant clusters are interpreted and assessed with reference to clusters identified by co-citation links. The consistency and discrepancy between the EM clusters and the link-based co-citation clusters are also discussed.
Keywords: Scientific paradigm, EM clustering, co-citation networks
1. INTRODUCTION
The widely known philosophy of science is due to Thomas Kuhn’s structure of scientific revolutions1. According to Kuhn, the advance of science is made through scientific revolutions that dramatically change the scientific world view, or a scientific paradigm. Science can be characterized into an endlessly iterating process from normal science to crisis, revolution, and the re-establishment of new normal science under a new paradigm. Classic examples of scientific revolutions include the Copernican revolution and the Einstein’s relativity theory in modern physics. At a smaller scale, scientific revolutions take place all the time, from major breakthrough and discoveries to relatively minor ones2. It is therefore of fundamental significance for scientists, science policy makers, and the general publication to be able to identify the most significant changes in science.
Science moves forward rapidly in terms of the growth of the vast volume of scientific publications. Scientific literature has been an integral part of science. The dynamic and complex nature of science presents significant challenges to any attempts of tracking the growth of knowledge, especially mapping scientific frontiers in intuitive ways3. A citation is a reference link made by an article to an existing one. Citations to an article can be seen as an indicator of the level of the intellectual impact of the article. The higher the citations, the more prestige the article is in terms of its intellectual value. Citation analysis has a long tradition in information science4.
In addition to the level of citation counts, the endurance of the citations to a given article also matters. Scientific literature can be seen as the combination of three components at a given time: citation classics, transiently prominent articles, and articles with few or no citations. In analog to the decay of radio active isotope in physics, the half life of a scientific journal can be defined to capture the recentness of a journal’s content. For example, the Journal Citation Reports (JCR) compiled by Thomson ISI includes cited half-life and citing half-life. The cited half-life of a journal is the age of cited articles within the journal, whereas the citing half-life is the age of articles cited by the journal. The key questions we want to address here are: To what extent can the citation half-life of articles, at a finer granularity than that of journals, be used to characterize research paradigms? To what extent can it be used to measure the speed of a paradigm? Is it possible to detect a paradigm shift based on citation half-life of articles in a given field?
such measures are harmonic to the widely used graph drawing algorithms such as the force-directed node placement and spring embedder models. Articles can be clustered according to their association strengths by using graph-theoretical algorithms such as minimum spanning tree and by algorithms derived from the betweenness centrality11. These algorithms form clusters by removing the weakest links from a given network. However, link-based clustering approaches have drawbacks. For example, the connectivity patterns are the only input used by the clustering process. Intrinsic attributes of nodes, such as the half life of an article or the age of the article, are not taken into account in generating clusters. More importantly, the graph-theoretical approach may not be particularly suitable to detect how fast a new paradigm is emerging or to what extent an existing paradigm is enduring.
In this article, we describe a method for analyzing transient patterns of a subject domain. The co-citation network of a subject is first derived using graph-theoretical approaches as implemented in CiteSpace10. A series of attributes of nodes in the network are computed, including citation frequency, year of publication, and citation half life. Network nodes are subsequently clustered based on these attributes using the Expectation Maximization (EM) algorithm12, which is an iterative optimization method to estimate unknown parameters by maximizing their posterior probability, given measurement data. Clusters identified by the EM clustering algorithm are interpreted in conjunction with the visualization of the original co-citation network in order to identify emerging paradigms and long enduring paradigms. The method is tested with three datasets on Social Network Analysis (1992-2004), Mass Extinction (1981-2004), and Terrorism (1989-2004). The consistency and discrepancies between groupings identified by the EM algorithm and the link-based clustering method are compared and discussed. The rest of the article is organized as follows. Related work is reviewed, followed by a description of the method. The results are presented, first in terms of the cluster profiles identified by the EM algorithm, and then interpreted along with additional evidence from co-citation networks and topical information of articles. Implications and future work are discussed.
2. RELATED WORK
There is a growing body of research literature on mapping scientific literature. The study of networks of scientific papers is pioneered in the 1960s13. Price also developed the notion of research fronts. The growth and decay of scientific articles have been studied by2, 6, 7, 14. More recently, Redner conducted a comprehensive analysis of citation statistics of articles published in Physical Review over a 100-year period15. Statistical analysis of scientific collaboration networks is also a popular topic in the context of complex network analysis16. Visualizing the growth of a knowledge domain is a growing topic of interest3, 8, 9, 14, 17-20.
Visualizing changes of information over time is addressed21, 22, 23, 24. A relevant study is the timeline visualization25, in which scientific articles are clustered based on their bibliographic coupling strengths26. Articles in each cluster are plotted over a timeline. The emergence of a new theme could be visually detected based on the notable changes in citations. We report the use of the burst detection algorithm27 in the context of citation network analysis in a recent study28. The surge of subject terms is incorporated into a bipartite graph representation, along with cited articles.
The concept of centrality in social networks is introduced in 1970s29. The betweenness centrality (BC) measures the extent to which an actor is in all available shortest paths in a social network. A fast algorithm for computing betweenness centrality is available11. The betweenness centrality metric is suitable for identifying the weakest links in a social network. A number of recent studies of community finding have developed clustering algorithms based on a modified definition of the metric30, 31. A particularly insightful perspective from social network analysis is given by the work of Granovette32, in which the importance of long-range links in social networks is emphasized. Using the betweenness centrality in identifying pivotal points in scientific networks is reported in a recent study33.
The Expectation Maximization (EM) algorithm is an iterative optimization method consisting of two steps for estimating parameters of generative models based on available data12. The two steps are the Expectation step and the Maximization step. Suppose J is a set of hidden variables and U is the given data, EM maximizes the posterior probability of the parameters Θ:
Θ* = argmaxΘ∑JP(Θ, J | U)
clustering without pre-specifying the number of clusters, easy to compare and evaluate the results of clustering based on log likelihood levels, and its potential of making predictions of cluster memberships of newly arrived data points. In this study, we use the EM algorithm implemented in the open-source machine learning package Weka34.
3. METHODS
The method is tested on three datasets: Social Network Analysis (1992-2004), Mass Extinction (1981-2004), and Terrorism (1989-2004). All datasets are retrieved from the Web of Science, the web-portal of Science Citation Index (SCI) and Social Science Citation Index (SSCI). Each data record is the bibliographic description of an article, including its author(s), title, abstract, and citations to existing articles. Such articles are called citing articles with restrict to a given dataset. If a citing article is cited by other articles in the same dataset, then the citing article is also a cited article. To be included in the subsequent analysis, an article must be cited by other articles. Thresholds are typically applied to select articles that have been cited for more than fc times.
CiteSpace is a research prototype that we have developed for analyzing and visualizing co-citation networks10. CiteSpace is implemented in Java. It is freely available*. In CiteSpace, the user first selects the time interval in which the subsequent analysis is to be conducted. The user can divide the entire time interval into a number of equal-length subintervals known as time slices.
CiteSpace facilitates the creation of co-citation networks in these time slices and processes them using network scaling algorithms such as Pathfinder network scaling35. The purpose of using Pathfinder network scaling is to reduce the complexity of networks by retaining only the most salient links. CiteSpace allows the user to control the sampling procedure by selecting various thresholds for citation, co-citation, and co-citation coefficients. The lower a threshold, the more articles will be qualified for subsequent modeling and analysis. The network scaled co-citation networks from individual time slices are subsequently merged with the Pathfinder’s topological properties preserved; in essence, all links in the final network must not violate the triangle inequality. Betweenness centrality is computed for each node in the network.
The merged network, and the networks from individual time slices, can be visualized. A number of color encoding schemes are used to convey a variety of information. Each article is shown with its citation tree rings colored by the time when citations were made to the article. Co-citation links between articles are colored by the time when the first instance of the co-citation was made. Nodes with high centrality are marked with an extra purple ring. We call such nodes pivotal nodes because they tend to be the bridges between two dense clusters. The user can also choose to have all nodes in color or only the pivotal nodes in color and leave the rest of nodes in grayscale.
While CiteSpace is generating the co-citation networks, it also computes the citation half life for each article. The following six attributes of each article are compiled and used for the EM clustering step: citation counts throughout the entire time interval, betweenness centrality, the first author of the article, the year of publication, the source of the publication, and the half life of the article. The half life (H-L) of an article is defined as the number of years since its publication year such that more than 50% of the total citations were made during these years. This is intended to measure the movement of a research front. Network nodes are subsequently clustered based on these attributed by the EM algorithm implemented in Weka. We let the algorithm to determine the optimal number of clusters.
The descriptions of three datasets are summarized in Table 1. The size of a dataset means the number of citing records. The network size is the number of article nodes in a corresponding co-citation network. In this article, all networks refer to merged Pathfinder networks.
Table 1. Three datasets tested.
Datasets Time Interval Size Network Size
Social Network Analysis
1992-2004 1,090 245
Mass Extinction 1981-2004 771 623
Terrorism 1988-2004 1,776 532
*
4. RESULTS
4.1. Cluster Profiles
A 245-node network of the Social Network Analysis (1992-2004) dataset was used to derive the 6-attribute node profiles. The EM algorithm identified five clusters. A 623-node network of Mass Extinction (1981-2004) led to eight clusters. A 532-node network of Terrorism (1989-2004) led to five clusters.
4.1.1. Social Network Analysis (1992-2004)
Details of identified clusters are summarized in Table 1. Clusters are numbered as 0, 1, 2, and so on. The numbers in the Instances column are the number of nodes in a given network in identified clusters. The Prior Probability is the probability of a node belongs to a given cluster. The values in the Citation, Centrality, Year, and H-L are the mean. Standard deviations are omitted for simplicity. Complete results are available from the author upon request.
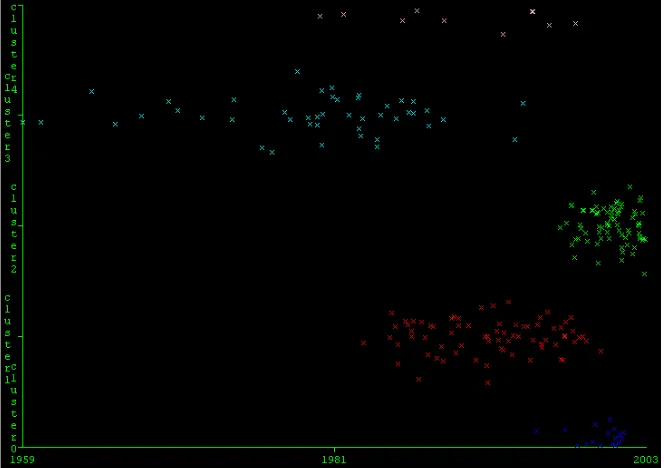
Among the five Social Network Analysis clusters, clusters C0, C3, and C4 are of particular interest. Articles in C0 tend to have the following profile: published around late 1999, probably highly cited at the level of 24 citations, with the second highest betweenness centrality level, and a short citation half life due to their overall recentness. In contrast, articles in C3 are centered around a different profile: published 21-years earlier than articles in C0, slightly lower citations than articles in C0, and with a 18.67 year of citation half life. Articles in C4 are published in between around 1989, more likely to have high betweenness centrality, and with a 5.57 year of citation half life. It is clear that C0 may represent the latest surge of interest in social networks prompted by complex network analysis. We expected to identify leading articles in complex network analysis in this cluster. The details are reported in the following sections. C4 may represent the main paradigm prior to the rapidly emerging one associated with C0. C3 may correspond to an even earlier paradigm.
4.1.2. Mass Extinction (1981-2004)
The EM algorithm identified eight clusters based on the half life attributes of nodes in the network. The cluster with the most prominent profile is C1, with the mean citation of 53.95, a centrality of 0.1577, published around 1991, and a 2.76 year of citation half life. This profile suggests that articles in this cluster may be associated with a significant event. The short half life of 2.76 years is also of interest. Although articles in C4 tend to be published in the same timeframe as those in C1, C4 articles tend to have less citations and weaker centrality measures. The most recent cluster is C0, which covers 20% of nodes in the network.
4.1.3. Terrorism (1989-2004)
Articles in the co-citation network of the Terrorism dataset belong to five clusters. Articles in C4 are generally highly cited, with a high centrality, published around 1997/1998, and with a citation half life of 2.17 years. The largest cluster is C2 (45%).
Table1. Clusters in the three datasets are identified by Expectation Maximization (EM).
Social Network Analysis (1992-2004) (Clusters 5; Log Likelihood: -14.1181) Cluster Instances % Prior Prob Citation Centrality Year H-L
0 17 8% 0.0765 24.41 0.0255 1999.76 1.43
1 75 33% 0.3359 9.89 0.0005 1991.86 7.06
2 77 34% 0.3446 7.22 0.0000 2000.66 2.01
3 45 20% 0.1898 17.21 0.0023 1978.34 18.67
4 10 4% 0.0533 44.44 0.0753 1989.31 5.57
Mass Extinction (1981-2004) (Clusters 8; Log Likelihood: -16.0895)
Cluster Instances % Prior Prob Citation Centrality Year H-L
0 135 20% 0.2247 6.15 0.0000 1998.69 2.61
1 17 3% 0.0251 53.95 0.1577 1991.28 2.76
2 212 32% 0.2361 10.99 0.0018 1995.20 4.07
3 32 5% 0.0492 25.96 0.0123 1990.94 3.03
5 91 14% 0.1352 8.99 0.0000 1988.60 8.07
6 44 7% 0.0952 12.52 0.0006 1995.14 4.51
7 102 15% 0.1694 7.60 0.0000 1981.66 15.47
Terrorism (1988-2004) (Clusters 5; Log Likelihood: -15.6628 )
Cluster Instances % Prior Prob Citation Centrality Year H-L
0 120 24% 0.2257 2.93 0.0012 1990.39 9.01
1 46 9% 0.1166 7.79 0.0008 1987.81 8.64
2 223 45% 0.4450 3.60 0.0000 1998.66 2.55
3 51 10% 0.1023 3.88 0.0013 1970.67 28.38
4 53 11% 0.1104 13.47 0.0608 1997.97 2.17
4.2. Interpreting Clusters
4.2.1. Social Network Analysis
The five Social Network Analysis clusters are shown along time – the year of publication. Based on the cluster profiles, we are particularly interested in C0, C3, and C4. In Figure 1, C0 is shown in blue and on the lowest level; C3 in light blue and the second from the top; C4 is shown in the top of the chart. The figure clearly shows that C3 is the longest lasting paradigm, but it is not current. C0 and C2 are recent. It is more likely to find a pivotal point in C0 than in C2.
Figure 1. The span of five Social Network Analysis clusters over time.
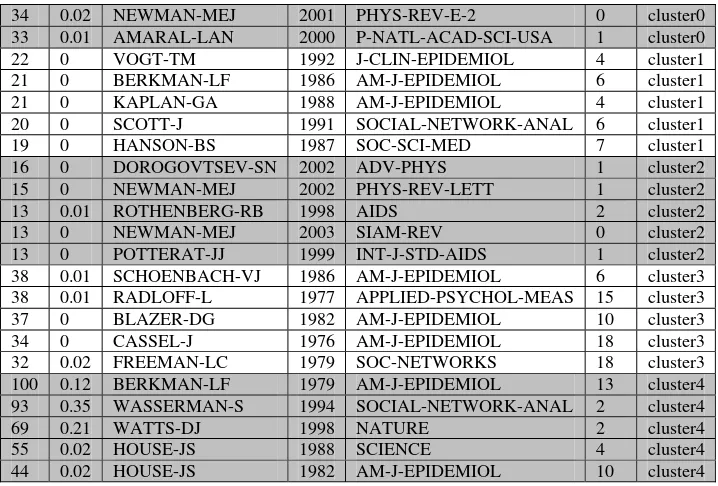
The most cited five articles from each cluster are shown in Table 2. The top-5 articles in C0 include Barabasi (1999) and Albert (2002); both are the seminal articles in the surge of the complex network analysis paradigm. The leading articles in C4 include Wasserman (1994) and Watts (1998), revealing the connection between small-world networks and social network analysis in general.
Table 2. Top-5 most cited articles in each of the five Social Network Analysis clusters. TC=Times Cited; BC=Betweenness Centrality; H-L=Citation Half Life.
34 0.02 NEWMAN-MEJ 2001 PHYS-REV-E-2 0 cluster0 33 0.01 AMARAL-LAN 2000 P-NATL-ACAD-SCI-USA 1 cluster0
22 0 VOGT-TM 1992 J-CLIN-EPIDEMIOL 4 cluster1 21 0 BERKMAN-LF 1986 AM-J-EPIDEMIOL 6 cluster1 21 0 KAPLAN-GA 1988 AM-J-EPIDEMIOL 4 cluster1 20 0 SCOTT-J 1991 SOCIAL-NETWORK-ANAL 6 cluster1 19 0 HANSON-BS 1987 SOC-SCI-MED 7 cluster1
38 0.01 SCHOENBACH-VJ 1986 AM-J-EPIDEMIOL 6 cluster3 38 0.01 RADLOFF-L 1977 APPLIED-PSYCHOL-MEAS 15 cluster3
37 0 BLAZER-DG 1982 AM-J-EPIDEMIOL 10 cluster3 34 0 CASSEL-J 1976 AM-J-EPIDEMIOL 18 cluster3 32 0.02 FREEMAN-LC 1979 SOC-NETWORKS 18 cluster3 100 0.12 BERKMAN-LF 1979 AM-J-EPIDEMIOL 13 cluster4 93 0.35 WASSERMAN-S 1994 SOCIAL-NETWORK-ANAL 2 cluster4 69 0.21 WATTS-DJ 1998 NATURE 2 cluster4 55 0.02 HOUSE-JS 1988 SCIENCE 4 cluster4 44 0.02 HOUSE-JS 1982 AM-J-EPIDEMIOL 10 cluster4
Figure 2 is a close-up view of the visualized co-citation network of the Social Network Analysis research. The nodes with colored rings are the ones that have strong betweenness centrality. These nodes are pivotal nodes in terms of graph-theoretical connectivity. The popularity of Wasserman (1994), Watts (1998), Barabasi (1999), and Albert (2002) is prominent. Each of them appears as a hub in its own right. Clustering based on citation half life allows us to see the grouping from a perspective that is particularly concerned with the transient nature of a research front.
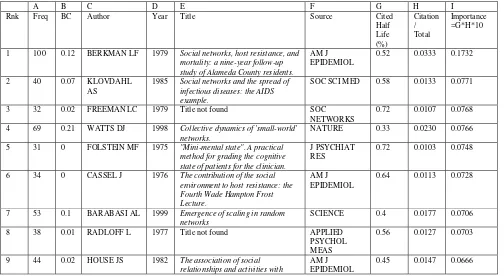
Identifying the most significant and latest articles in a fast-moving research front is challenging. Citation frequency alone, centrality alone, or citation half life alone can only inform us a particular aspect of the position of an article in the advancing research front. Existing metrics could be modified as illustrated below. A recently published article is bound to have a shorter citation half life than an article appeared long time ago. A more meaningful and more comparable measure of the endurance of an article in terms of its intellectual impact could be its citation half life adjusted to its publication age. For example, if a 10-year old article has a 5-year citation half life, its adjusted half life is 0.50 out of 1.00. If we also normalize the citations across the network, then the importance of an article can be defined as an extended endurance and highly cited. Table 3 lists the top 20 articles ranked by the new metrics. Watts (1998) is ranked as the 4th, Barabasi (1999) the 7th, and Wasserman (1994) the 10th. The new ranking scheme partially corrected the potential bias of weighting heavily on highly cited earlier articles.
4.2.2. Mass Extinction
Figure 2. A close-up view of a co-citation cluster of the Social Network Analysis dataset. Pivotal articles such as Wasserman (1994), Watts (1998), Albert (2002), and Barabasi (1999) are shown in color. Note that only the first authors of these references are used because the full author list may not be available in the dataset.
Table 3. Top-25 articles in social network analysis ranked by cited half life and normalized citations.
A B C D E F G H I
1 100 0.12 BERKMAN LF 1979 Social networks, host resistance, and
mortality: a nine-year follow-up
1985 Social networks and the spread of infectious diseases: the AIDS
mortality: prospective evidence from
12 30 0.02 COBB S 1976 Presidential Address-1976. Social
support as a moderator of life stress.
PSYCHOSOM
19 55 0.02 HOUSE JS 1988 Social relationships and health. SCIENCE 0.25 0.0183 0.0458
20 15 0 UNDEN AL 1989 Development of a social support
instrument for use in population surveys.
SOC SCI MED 0.87 0.0050 0.0433
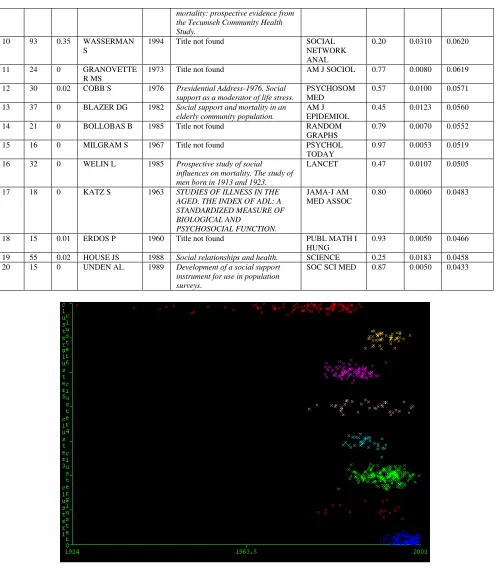
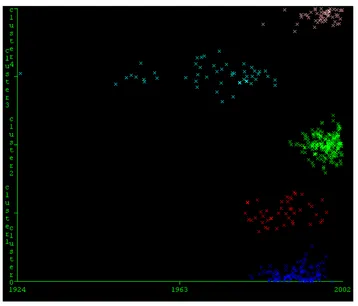
Figure 3. The eight Mass Extinction clusters identified by Expectation Maximization.
Alvarez (1980) has a centrality as high as 0.91 out of 1.00, whereas Bowring (1998) has 0.22, which is also considerably high.
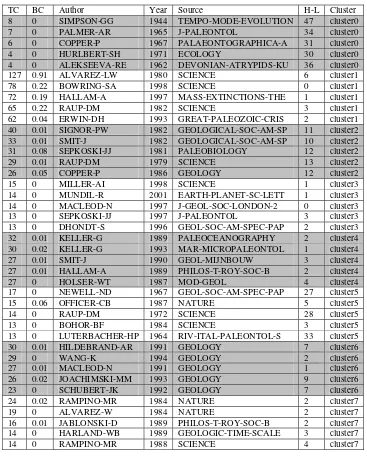
Table 4. Top-5 most cited articles in each of the eight Mass Extinction clusters. TC=Times Cited; BC=Betweenness Centrality; H-L=Citation Half Life.
TC BC Author Year Source H-L Cluster 8 0 SIMPSON-GG 1944 TEMPO-MODE-EVOLUTION 47 cluster0 7 0 PALMER-AR 1965 J-PALEONTOL 34 cluster0 6 0 COPPER-P 1967 PALAEONTOGRAPHICA-A 31 cluster0 4 0 HURLBERT-SH 1971 ECOLOGY 30 cluster0 4 0 ALEKSEEVA-RE 1962 DEVONIAN-ATRYPIDS-KU 36 cluster0 127 0.91 ALVAREZ-LW 1980 SCIENCE 6 cluster1 78 0.22 BOWRING-SA 1998 SCIENCE 0 cluster1 72 0.19 HALLAM-A 1997 MASS-EXTINCTIONS-THE 1 cluster1 65 0.22 RAUP-DM 1982 SCIENCE 3 cluster1 62 0.04 ERWIN-DH 1993 GREAT-PALEOZOIC-CRIS 2 cluster1 40 0.01 SIGNOR-PW 1982 GEOLOGICAL-SOC-AM-SP 11 cluster2 33 0.01 SMIT-J 1982 GEOLOGICAL-SOC-AM-SP 10 cluster2 31 0.08 SEPKOSKI-JJ 1981 PALEOBIOLOGY 12 cluster2 29 0.01 RAUP-DM 1979 SCIENCE 13 cluster2 26 0.05 COPPER-P 1986 GEOLOGY 12 cluster2 15 0 MILLER-AI 1998 SCIENCE 1 cluster3 14 0 MUNDIL-R 2001 EARTH-PLANET-SC-LETT 1 cluster3 14 0 MACLEOD-N 1997 J-GEOL-SOC-LONDON-2 0 cluster3 13 0 SEPKOSKI-JJ 1997 J-PALEONTOL 3 cluster3 13 0 DHONDT-S 1996 GEOL-SOC-AM-SPEC-PAP 2 cluster3 32 0.01 KELLER-G 1989 PALEOCEANOGRAPHY 2 cluster4 30 0.02 KELLER-G 1993 MAR-MICROPALEONTOL 1 cluster4 27 0.01 SMIT-J 1990 GEOL-MIJNBOUW 3 cluster4 27 0.01 HALLAM-A 1989 PHILOS-T-ROY-SOC-B 2 cluster4 27 0 HOLSER-WT 1987 MOD-GEOL 4 cluster4 17 0 NEWELL-ND 1967 GEOL-SOC-AM-SPEC-PAP 27 cluster5 15 0.06 OFFICER-CB 1987 NATURE 5 cluster5 14 0 RAUP-DM 1972 SCIENCE 28 cluster5 13 0 BOHOR-BF 1984 SCIENCE 3 cluster5 13 0 LUTERBACHER-HP 1964 RIV-ITAL-PALEONTOL-S 33 cluster5 30 0.01 HILDEBRAND-AR 1991 GEOLOGY 7 cluster6 16 0.01 JABLONSKI-D 1989 PHILOS-T-ROY-SOC-B 2 cluster7 14 0 HARLAND-WB 1989 GEOLOGIC-TIME-SCALE 3 cluster7 14 0 RAMPINO-MR 1988 SCIENCE 4 cluster7
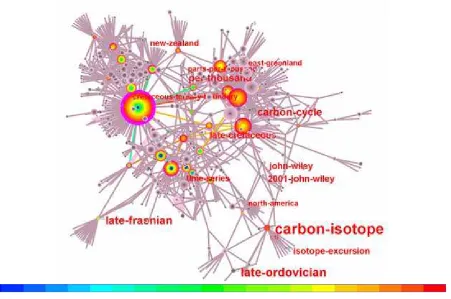
Figure 4. A 623-node network of key terms and articles in the Mass Extinction dataset. The network is the result of incorporating 21 Pathfinder networks. Pivotal nodes are in color, whereas non-pivotal nodes are in grayscale. The thickness of a citation ring of an article represents the number of citations to the article in a particular time slice; citations in earlier slices are colored in blue and more recent ones in red. Article labels are turned off in this figure, whereas term labels are enabled.
4.2.3. Terrorism
The cluster profiles indicate that C4 are C2 are potentially significant ones. C4 is highly cited and associated with high centrality measures. C2 is the largest cluster.
Figure 5. The five clusters in the Terrorism dataset.
Table 5. Top-5 most cited articles in each of the five Terrorism clusters. TC=Times Cited; BC=Betweenness Centrality; H-L=Citation Half Life.
31 0.19 GALEA-S 2002 NEW-ENGL-J-MED 0 cluster4 30 0.17 INGLESBY-TV 1999 JAMA-J-AM-MED-ASSOC 0 cluster4 30 0.11 HENDERSON-DA 1999 JAMA-J-AM-MED-ASSOC 1 cluster4
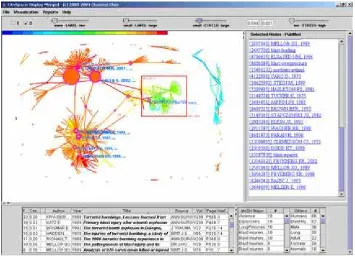
Figure 6. A 532-node network of the Terrorism dataset. All nodes are shown in color. Article labels are on, but term labels are disabled in this image. Schuster (2001) and Galea (2002) belong to the top cluster, whereas Franz (1997), Inglesby (1999), and Henderson (1999) belong to the lower left cluster.
5. DISCUSSIONS
The three examples have shown the potential of combining machine learning techniques and graph-theoretical modeling techniques in identifying transient research paradigms. Attributes of nodes in co-citation networks such as citation counts, the year of publication, and citation half life years are independent from the sampling procedure supported by CiteSpace. In contrast, the betweenness centrality is dependent on the procedure in terms of the selection of thresholds, the selected time span, and the network scaling component. In other words, different configurations may influence the centrality measures.
The EM clustering appears to be able to capture the temporal grouping of articles purely based on these attributes, for example, the identification of the emerging paradigm of complex network analysis in the Social Network Analysis dataset. In the Mass Extinction example, it is interesting to note that the EM clustering can distinguish the impact theory cluster from its opponent cluster even though they took place within the same time frame. This suggests the potential of using citation half life as a characteristic metric of a research paradigm so that one can distinguish one paradigm from another based on their citation half life profiles. The primary motivation for us to use a generative modeling approach such as EM alongside the traditional graph-theoretical approaches is that using a generative model could lead to more meaningful metrics of overall fitness quality.
A potentially significant route is the potential of making predictions based on existing cluster profiles so that one can identify the emergence of a new paradigm based on the citation half life value of recently published articles. One would expect that if many new articles are citing more recent articles, then it is a possible sign that a new paradigm is emerging. On the other hand, if an article starts to attract many citations in a new wave, then the article may be part of a rising paradigm. Such articles will have prolonged citation endurance.
The examples have also shown that co-citation networks can reveal finer-grained clusters that might be missed by EM clustering as in the Terrorism dataset. The betweenness centrality was the only attribute included in the EM clustering that may convey the characteristics of the global structure of the network. Further research is needed to investigate the role of other graph-theoretical metrics in identifying meaningful clusters. Further studies should be also encouraged in fostering an integration of generative models and graph-theoretical models.
6. CONCLUSIONS
In this article, we have reported a study of identifying transient scientific paradigms in two complementary approaches, namely the EM clustering and the co-citation network analysis. Articles in co-citation networks are clustered by the EM algorithm based on attributes such as citation counts, betweenness centrality, year of publication, and citation half life. The central hypothesis is that a scientific paradigm influences the citation half life of an article, i.e. the number of years since its publication that accumulate more than half of all citations to the article. Articles with enduring citation half life are citation classics.
REFERENCES
1. Kuhn, T.S., The Structure of Scientific Revolutions. 1962, Chicago: University of Chicago Press.
2. van Raan, A., On growth, ageing, and fractal differentiation of science. Scientometrics, 2000. 47(2): p. 347-362. 3. Chen, C., Mapping Scientific Frontiers: The Quest for Knowledge Visualization. 2003, London: Springer.
4. Garfield, E., Citation Indexing: Its Theory and Applications in Science, Technology, and Humanities. 1979, New York: John Wiley.
5. Small, H., Visualizing science by citation mapping. Journal of the American Society for Information Science, 1999. 50(9): p. 799-813.
6. Small, H.G. and B.C. Griffith, The structure of scientific literatures I: Identifying and graphing specialties. Science Studies, 1974. 4: p. 17-40.
7. Griffith, B.C., et al., The structure of scientific literatures II: Towards a macro- and microstructure for science. Science Studies, 1974. 4: p. 339-365.
8. Chen, C. and R.J. Paul, Visualizing a knowledge domain's intellectual structure. Computer, 2001. 34(3): p. 65-71.
9. Chen, C., Visualising semantic spaces and author co-citation networks in digital libraries. Information Processing and Management, 1999. 35(2): p. 401-420.
10. Chen, C., Searching for intellectual turning points: Progressive Knowledge Domain Visualization. Proc. Natl. Acad. Sci. USA, 2004. 101: p. 5303-5310.
11. Brandes, U., A faster algorithm for betweenness centrality. Journal of Mathematical Sociology, 2001. 25(2): p. 163-177.
12. Dempster, A., N. Laird, and D. Rubin, Maximum likelihood from incomplete data via the EM algorithm. Journal of the Royal Statistical Society, Series B, 1977. 39(1): p. 1-38.
13. Price, D.D., Networks of scientific papers. Science, 1965. 149: p. 510-515.
14. Braam, R.R., H.F. Moed, and A.F.J.v. Raan, Mapping of science by combined co-citation and word analysis II: Dynamical aspects. Journal of the American Society for Information Science, 1991. 42(4): p. 252-266.
15. Redner, S., Citation statistics from more than a century of Physical Review. Phys. Rev. E (Submitted for Publication), 2004. 16. Newman, M. The structure of scientic collaboration networks. in Natl. Acad. Sci. 2001b. USA.
17. White, H.D. and K.W. McCain, Visualizing a discipline: An author co-citation analysis of information science, 1972-1995. Journal of the American Society for Information Science, 1998. 49(4): p. 327-356.
18. Boyack, K.W., B.N. Wylie, and G.S. Davidson, Domain visualization using VxInsight for science and technology management. Journal of the American Society for Information Science and Technology, 2002. 53(9): p. 764-774.
19. Braam, R.R., H.F. Moed, and A.F.J. Vanraan, Mapping of science by combined cocitation and word analysis I: Structural aspects. Journal of the American Society for Information Science, 1991. 42(4): p. 233-251.
20. Chen, C. and J. Kuljis, The rising landscape: A visual exploration of superstring revolutions in physics. Journal of the American Society for Information Science and Technology, 2003. 54(5): p. 435-446.
21. Havre, S., et al., ThemeRiver: Visualizing thematic changes in large document collections. IEEE Transactions on Visualization and Computer Graphics, 2002. 8(1): p. 9-20.
22. Brandes, U. and S.R. Corman, Visual unrolling of network evolution and the analysis of dynamic discourse. Information Visualization, 2003. 2(1): p. 40-50.
23. Brandes, U. and T. Willhalm. Visualization of bibliographic networks with a reshaped landscape metaphor. in Proc. 4th Joint Eurographics - IEEE TVCG Symp. Visualization (VisSym '02). 2002.
24. Erten, C., et al. Exploring the computing literature using temporal graph visualization. in Conference on Visualization and Data Analysis (VDA). 2004.
25. Morris, S.A., et al., Timeline visualization of research fronts. Journal of the American Society for Information Science and Technology, 2003. 55(5): p. 413-422.
26. Kessler, M.M., Bibliographic coupling between scientific papers. American Documentation, 1963. 14: p. 10-25.
27. Kleinberg, J. Bursty and hierarchical structure in streams. in Proceedings of the 8th ACM SIGKDD International Conference on Knowledge Discovery and Data Mining. 2002. Edmonton, Alberta, Canada: ACM Press.
28. Chen, C. Detecting and mapping thematic changes in transient networks. in Proceedings of the 8th International Conference on Information Visualization (IV’04). 2004. London: IEEE Computer Society Press.
29. Freeman, L.C., A set of measuring centrality based on betweenness. Sociometry, 1977. 40: p. 35-41.
30. Girvan, M. and M.E.J. Newman, Community structure in social and biological networks. Proc. Natl. Acad. Sci. USA, 2002. 99: p. 7821-7826.
31. Radicchi, F., et al., Defining and identifying communities in networks, in arXiv: cond- mat/ 0309488 v1. 2003. 32. Granovetter, M., Strength of weak ties. American Journal of Sociology, 1973. 8: p. 1360-1380.
33. Chen, C. The centrality of pivotal points in the evolution of scientific networks. in Proceedings of the International Conference on Intelligent User Interfaces (IUI 2005). 2005. San Diego, CA.
34. Witten, I.H. and E. Frank, Data Mining: Practical Machine Learning Tools and Techniques with Java Implementations. 1999: Morgan Kaufmann. 416.