Full Terms & Conditions of access and use can be found at
http://www.tandfonline.com/action/journalInformation?journalCode=cbie20
Download by: [Universitas Maritim Raja Ali Haji] Date: 17 January 2016, At: 23:32
Bulletin of Indonesian Economic Studies
ISSN: 0007-4918 (Print) 1472-7234 (Online) Journal homepage: http://www.tandfonline.com/loi/cbie20
Survey of Recent Developments
Haryo Aswicahyono & Hal Hill
To cite this article: Haryo Aswicahyono & Hal Hill (2014) Survey of Recent Developments, Bulletin of Indonesian Economic Studies, 50:3, 319-346, DOI: 10.1080/00074918.2014.980374 To link to this article: http://dx.doi.org/10.1080/00074918.2014.980374
Published online: 03 Dec 2014.
Submit your article to this journal
Article views: 599
View related articles
View Crossmark data
ISSN 0007-4918 print/ISSN 1472-7234 online/14/000319-28 © 2014 Indonesia Project ANU http://dx.doi.org/10.1080/00074918.2014.980374
* We thank interviewees in Jakarta, Tokyo, and Singapore, as well as participants at infor-mal roundtables in these cities and in Canberra. We also thank several ANU colleagues for very detailed and informative comments on an earlier draft.
SURVEY OF RECENT DEVELOPMENTS
Haryo Aswicahyono* Hal Hill*
Centre for Strategic and International The Australian National University Studies, Jakarta
SUMMARY
Following the remarkably successful 2014 parliamentary and presidential elections
in Indonesia, attention now turns to the new president and his agenda for the next
ive years. President Joko Widodo, known as Jokowi, has emphasised the impor
-tance of strong economic growth and rising living standards. But he faces signii
-cant, broadranging economic challenges and, perhaps not surprisingly, serious discussion of these issues did not feature during the election campaigns. In many respects the economy is at a crossroads, facing the choice between a businessas usual scenario of no reform and consequently sluggish economic growth, and a politically dificult reform agenda that would set it on a higher growth path. Economic policymakers regard the events of 2013 as a mini economic crisis, and they feel vindicated in their explicit preference for stability over growth—that is, for slowing the economy through tighter iscal and monetary policy and let
-ting the currency decline. For now, the economy is slowing but holding up quite well, especially by comparative international norms and considering foreign and domestic headwinds, including possible macroeconomic and inancial fragilities. Here we examine these headwinds—from global economic volatility and declin
-ing commodity prices, particularly in the wake of the socalled Bernanke shock of May 2013, to the continuing policy drift at home. We investigate whether there is evidence of an emerging adjustment from the commoditydriven growth of the past decade to some of the traditional tradables sectors, especially manufacturing. While the commodity boom is almost certainly a thing of the past—at least at lev
-els witnessed since 2005—the country’s political narratives and the government’s microeconomic policies appear to be still premised on an era of plenty funded by a disappearing boom. We speculate on likely options and directions for what in all likelihood will be a ‘Jokowi decade’.
Keywords: energy subsidies, economic reform, economic volatility JEL classiication: D72, E62, J38, O11, O14, O53
320 Haryo Aswicahyono and Hal Hill
INTRODUCTION
In Indonesia the four months since July 2014 have been dominated by national
politics, owing to the presidential election of 9 July and the continuing aftermath of the April parliamentary elections (see Aspinall and Mietzner 2014, this issue). Indonesians have rightly taken great pride in these elections and their outcomes; the integrity of the democratic processes was maintained, reafirming Indonesia’s position as the leading democracy in Southeast Asia. But the presidential cam
-paign was generally regarded as the most rancorous and divisive in Indonesia’s history. Both candidates, Joko Widodo (Jokowi) and Prabowo Subianto, empha
-sised their ‘nationalist’ credentials, to the point of xenophobia—especially the Prabowo camp—and there was a pronounced disconnect between political rheto
-ric on the hustings and current economic realities. The presidential campaigns were dominated by vague, allencompassing slogans, consistent with modern political practice. We know very little about Jokowi’s economic platform beyond the broad and rather vague campaign rhetoric, together with his notable achieve
-ments in local government. For example, his platform consists of state-ments such as a ‘clean, effective, democratic and trusted administration’. His government will ‘improve the quality of life of the Indonesian people’, by increasing the people’s productivity and international competitiveness, and also by focusing on ‘strate
-gic’ domestic economic sectors.1
Since 22 July, when the results of the presidential election were announced, and particularly since the Constitutional Court’s afirmation on 21 August of the legit
-imacy of the results, speculation has surrounded the likely nature of the Jokowi administration and its priorities. Amid the lurry of activity over these months, three events stood out. The irst was the announcement of Jokowi’s transition team, whose composition has been widely—though perhaps inaccurately—seen as a guide for things to come. It is headed by Rini Soemarno, a USeducated loyal
-ist of former president Megawati and a successful businesswoman, including as president director of PT Astra International. She was trade minister under Mega
-wati, with a mixed, somewhat protectionist policy record. Other members of the transition team include Anies Baswedan, the highproile and highly regarded rector of Paramadina University; Andi Widjajanto, a defence and foreign affairs specialist; Akbar Faizal, a NasDem Party politician; and Hasto Kristiyanto, the deputy secretarygeneral of the Indonesian Democratic Party of Struggle (Partai Demokrasi Indonesia–Perjuangan [PDI–P]).
The second event to attract attention was the highproile Bali meeting in late August between the outgoing and incoming presidents. It was hoped that this meeting would lead to a breakthrough on subsidies, including the possibility that a joint declaration would be issued, straddling the administrations and hence par
-tially depoliticising this vexed issue. In spite of the clear public signals that Jokowi favours subsidy reform, no deal was forthcoming. The third important develop
-ment was the evident determination of Prabowo’s RedandWhite Coalition to remain united and to play a powerful obstructionist role in the People’s Repre
-sentative Council (Dewan Perwakilan Rakyat [DPR]). Unless the Jokowi team is able to induce some members of this coalition to defect, it is very likely that the new administration will have great dificulty progressing its legislative agenda.
1. These details are set out more fully in Jokowi and Jusuf Kalla’s ‘Nawa Cita’ platform is-sued in May as part of their ‘Sembilan Agenda Prioritas’—that is, the nine priority agendas.
AN OVERVIEW: GROWTH HOLDING UP SURPRISINGLY WELL Economic Growth
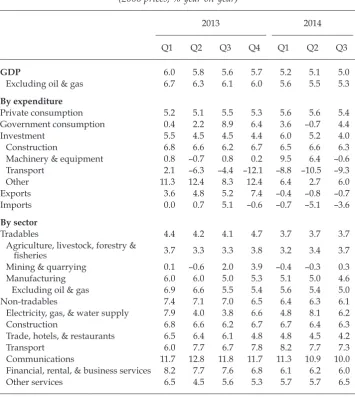
At irst glance, the Indonesian economy is holding up surprisingly well. Indone
-sia’s economic growth is slowing but is still fast enough for the government to be able to claim the secondhighest growth rate among the G20 economies, behind China and marginally ahead of India (although India will probably grow faster over 2014 as a whole). For the irst three quarters of 2014, the economy grew by around 5.1% (table 1), continuing the gradual deceleration since the peak of 2011, and about a percentage point slower than that of the underlying trend growth of the three previous years. This is the slowest rate since 2008–9, the period of the global inancial crisis. It is also well below the growth target of 7% set by the two presidential candidates, an annual rate last achieved during the Soeharto era.
The growth slowdown is evident in all sectors. The growth in tradables (that is, agriculture, mining, and manufacturing) is now below 4.0%. Excluding oil and gas processing, manufacturing is growing a little more quickly, but still only at 4.6%. The muchdiscussed ‘revival’ of manufacturing is hardly evident. We return to this issue below. Agricultural growth is close to the longterm trend. Mining and its process
-ing shrank slightly in the irst half of 2014, and rebounded only slightly in the third quarter. These sectors have been stagnant in recent years, and of course the restric
-tive mining export regulations, discussed extensively in recent BIES surveys, have
further dented growth. The nontradable sectors continue to grow more strongly, led by transport and communications, with construction and inance also buoyant. In oficial circles, there is an air of cautious optimism about the economy.2 The
coverage of Investment Coordinating Board (Badan Koordinasi Penanaman Modal [BKPM]) data is limited, but investment approvals, for what they are worth, are quite strong. Indonesia’s ranking in the 2014–15 World Economic Forum, a widely cited report, is now 34th of 144 countries, an appreciable rise in recent years.3
Indo-nesia is also cited as the ‘most promising’ Asian investment destination in the lat
-est survey conducted by the inluential Japan Bank for International Cooperation, ranking ahead of India, China, and Thailand (Armstrong and Rahardja 2014).
The key to shortterm growth resilience is private consumption, which grew at 5.6% in the irst half of 2014 (table 1), faster than that of the three previous years. Thus, consumer conidence is keeping the economy moving forward, for the time being. Election spending may have contributed marginally to this outcome. In contrast, government spending has been very restrained, actually declining in per capita terms in the irst half of 2014. This arguably relects well on the country’s macroeconomic management, to the extent that its electoral cycle has not resulted in iscal proligacy. Investment is holding up quite well, although it is heavily concentrated in construction and therefore vulnerable to a downturn in this sec
-tor. Net exports also contributed positively to growth outcomes, albeit in the negative sense that the import contraction resulting from the growth slowdown was larger than the export slowdown resulting from weaker commodity prices, slower global growth, and the miningsector imbroglio.
2. Coincidentally, and further bolstering Indonesia’s proile in global markets (as well as national pride), according to the latest World Bank estimates Indonesia is now the 10th largest economy in the world in purchasing power parity (PPP) terms. China is estimated to have become the world’s largest economy (again in PPP terms).
3. Curiously, improved infrastructure was cited as a major factor in this rise.
322 Haryo Aswicahyono and Hal Hill
The Comparative Picture
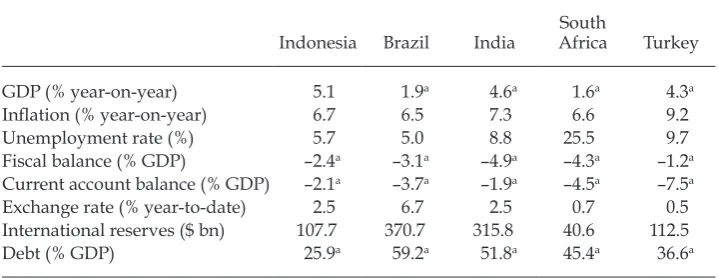
What comparators are relevant in assessing Indonesia’s slowing growth? Since the socalled Bernanke shock4 of May 2013, which we discuss in the following
section, in much of the international inancial press Indonesia has, controver
-sially, been included in a group labelled the ‘Fragile Five’, alongside Brazil, India, South Africa, and Turkey. These developing economies experienced the twin shocks of a capital reversal and (for the resource exporters) a declining terms of
4. Named after former US Federal Reserve chair Ben Bernanke, who in May 2013 fore shadowed the end to quantitative easing in the United States.
TABLE 1 Components of GDP Growth, 2013–14 (2000 prices; % year-on-year)
2013 2014
Q1 Q2 Q3 Q4 Q1 Q2 Q3
GDP 6.0 5.8 5.6 5.7 5.2 5.1 5.0
Excluding oil & gas 6.7 6.3 6.1 6.0 5.6 5.5 5.3
By expenditure
Private consumption 5.2 5.1 5.5 5.3 5.6 5.6 5.4
Government consumption 0.4 2.2 8.9 6.4 3.6 –0.7 4.4
Investment 5.5 4.5 4.5 4.4 6.0 5.2 4.0
Construction 6.8 6.6 6.2 6.7 6.5 6.6 6.3
Machinery & equipment 0.8 –0.7 0.8 0.2 9.5 6.4 –0.6
Transport 2.1 –6.3 –4.4 –12.1 –8.8 –10.5 –9.3
Other 11.3 12.4 8.3 12.4 6.4 2.7 6.0
Exports 3.6 4.8 5.2 7.4 –0.4 –0.8 –0.7
Imports 0.0 0.7 5.1 –0.6 –0.7 –5.1 –3.6
By sector
Tradables 4.4 4.2 4.1 4.7 3.7 3.7 3.7
Agriculture, livestock, forestry &
isheries 3.7 3.3 3.3 3.8 3.2 3.4 3.7
Mining & quarrying 0.1 –0.6 2.0 3.9 –0.4 –0.3 0.3
Manufacturing 6.0 6.0 5.0 5.3 5.1 5.0 4.6
Excluding oil & gas 6.9 6.6 5.5 5.4 5.6 5.4 5.0
Non-tradables 7.4 7.1 7.0 6.5 6.4 6.3 6.1
Electricity, gas, & water supply 7.9 4.0 3.8 6.6 4.8 8.1 6.2
Construction 6.8 6.6 6.2 6.7 6.7 6.4 6.3
Trade, hotels, & restaurants 6.5 6.4 6.1 4.8 4.8 4.5 4.2
Transport 6.0 7.7 6.7 7.8 8.2 7.7 7.3
Communications 11.7 12.8 11.8 11.7 11.3 10.9 10.0
Financial, rental, & business services 8.2 7.7 7.6 6.8 6.1 6.2 6.0
Other services 6.5 4.5 5.6 5.3 5.7 5.7 6.5
Source: CEIC Asia Database.
trade. Although a disparate group, they were all perceived to have moderately large iscal or current account deicits, they experienced signiicant exchangerate depreciations from mid2013, and they were therefore regarded in international inancial markets as potentially vulnerable to a further capital exodus.
Table 2 presents a range of macroeconomic indicators for the ive countries for the most recently available period. The Indonesian economy looks fairly robust on all indicators. With the caveat noted for India, Indonesia’s growth is the high
-est, notably compared with the anaemic record of the two other major resource exporters in the group, Brazil and South Africa.
This comparative picture might suggest that Indonesia has less to worry about than the four other countries, and that its inclusion within the group was mistaken. Its better outlook has been the result of stronger macroeconomic fundamentals over the past decade and of the government’s prompt macroeconomic response from mid2013. The above indicators do not of course present the full picture. For example, the funding of the current account deicit is arguably as important as its size. And Indonesia beneits from its locational advantage, as the most connected among the ive to the still dynamic East Asian region. Here the contrast with South Africa and Turkey, both connected mainly to a stagnating Europe, is relevant, as is the contrast with Brazil, linked to a sluggish North America and to its large southern neighbour, Argentina, again in technical debt default. Moreover, Indone
-sia’s inclusion in the Fragile Five arguably did the country no harm, to the extent that it reinforced the argument for macroeconomic prudence emanating from Bank Indonesia (BI) and the Ministry of Finance at a time of serious policy drift at home.
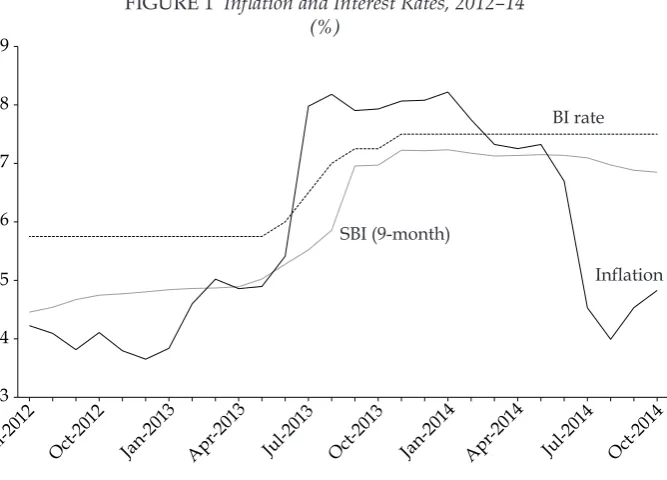
Inlation and the Exchange Rate
Indonesia’s economic resilience has been underpinned by stable macroeconomic conditions. Following the temporary blip in mid2013 (as a result of the reduction in electricity subsidies), the inlation rate is trending down, aided also by lower world food prices, and is within BI’s target zone of 3.5%–5.5% (igure 1). Two counteracting tendencies have been at work here. First, monetary policy has been quite tight, as a result of the increased BI policy rate, which rose progressively by
TABLE 2 Indonesia and the ‘Fragile Five’, 2014
Indonesia Brazil India
South
Africa Turkey
GDP (% yearonyear) 5.1 1.9a 4.6a 1.6a 4.3a
Inlation (% yearonyear) 6.7 6.5 7.3 6.6 9.2
Unemployment rate (%) 5.7 5.0 8.8 25.5 9.7
Fiscal balance (% GDP) –2.4a –3.1a –4.9a –4.3a –1.2a
Current account balance (% GDP) –2.1a –3.7a –1.9a –4.5a –7.5a
Exchange rate (% yeartodate) 2.5 6.7 2.5 0.7 0.5
International reserves ($ bn) 107.7 370.7 315.8 40.6 112.5
Debt (% GDP) 25.9a 59.2a 51.8a 45.4a 36.6a
Sources: Data from the Economist (various issues) and selected press reports.
aQ1 2014 (all other igures are for Q2 2014).
324 Haryo Aswicahyono and Hal Hill
1.75 percentage points in 2013, soon followed by the interest rate on ninemonth Bank Indonesia Certiicates (Sertiikat Bank Indonesia [SBIs]). Second, there have been costpush pressures from the depreciating currency, large wage increases (see below), and higher utilities charges. The overall result is a comfortable inla
-tionary outcome.
From mid2013, the rupiah slid about 25% against the US dollar (igure 2). BI initially leant against the market, attempting to hold the rate at between Rp 9,500 and Rp 10,000. But in August it allowed the depreciation to continue, always— as in late 2008 and early 2009—with the concern in the background that a pre -cipitous decline could trigger a rerun of the 1997–98 collapse. As a result, foreign
exchange reserves, which declined through much of 2013, began to increase from around August. Figure 2 charts the exchangerate depreciation, along with trends in the Indonesia Stock Exchange (IDX) index, over this period. The capital exodus began after the Bernanke shock pushed both series down. By September 2014 the IDX had recovered to early 2013 levels, whereas the rupiah remained about 20% lower.
Although a contentious issue in Indonesia, the Bernanke shock has arguably helped the country’s exchange rate adjust to declining commodity prices. On the one hand, policymakers regard the capital exodus as a conirmation of their belief that international capital markets are not to be trusted. However, the weaker rupiah is a helpful shock absorber in these circumstances, and it has restored Indonesia’s real exchange rate to a level similar to those of its neighbours (and export competitors) prior to the commodity boom. With the events of 1997–98 still a recent memory, BI’s initial ‘fear of loating’ syndrome was at one level
FIGURE 1 Inlation and Interest Rates, 2012–14
(%)
Inflation BI rate
SBI (9-month)
Jul-2012 Oct-2012 Jan-2013 Apr-2013 Jul-2013 Oct-2013 Jan-2014 Apr-2014 Jul-2014 Oct-2014 3
4 5 6 7 8 9
Source: CEIC Asia Database.
Note: SBI = Sertiikat Bank Indonesia (Bank Indonesia Certiicate).
understandable, but letting the currency decline was the right decision both in a shortterm macroeconomic sense and as a longterm strategy to shift resources into the noncommodity tradables sectors. In fact, in the current political environ
-ment, the weaker rupiah is practically the only policy tool the government has at its disposal to promote this sort of growth.
SIGNIFICANT GLOBAL HEADWINDS Managing Capital Volatility
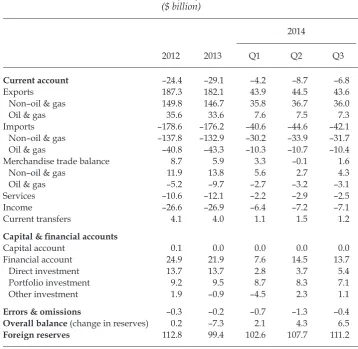
Indonesia has been running a signiicant current account deicit in its balance of payments since 2012 (table 3). The historically large deicits of 2012 and 2013 were seen in inancial markets as a predisposing factor in the 2013 capital exo
-dus. The deicit in the irst quarter of 2014 was a good deal smaller, at 2.1% of GDP, and seemed to indicate that the government’s strategy to lower the deicit was working. However, it rose sharply again in the second quarter, mainly owing to the smaller surplus in non–oil and gas goods. This deicit is not far short of the secondquarter igure from 2013 that unnerved the markets. However, the increase in the second quarter was partly the result of seasonal factors, associated with the fasting month, and it is thought unlikely to be repeated.
The inancial account has remained positive throughout, the overall deicit in 2013 arising because of a larger current account deicit combined with a smaller inancial account surplus. Since BI was attempting to support the currency through to August 2013, reserves declined to below $100 billion. However, capital lows have rebounded strongly in 2014, resulting in a inancial account surplus of $13.7 billion, up 174% year on year, with portfolio lows the largest contributor ($7.1
FIGURE 2 The Exchange Rate and the Indonesia Stock Exchange Index, 2013–14 (’000)
IDX (rhs)
Rp/$ (lhs)
Jun-2013 Aug-2013 Oct-2013 Jan-2014 Mar-2014 Jun-2014 Aug-2014 Oct-20149.6 10.0
10.4 10.8 11.2 11.6 12.0 12.4
3.8 4.0 4.2 4.4 4.6 4.8 5.0 5.2 5.4
Source: CEIC Asia Database.
Note: IDX = Indonesian Stock Exchange (composite index).
326 Haryo Aswicahyono and Hal Hill
billion). (Direct investment contributed $5.4 billion.) In the irst three quarters of 2014, the inancial account surplus was $35.8 billion, resulting in an overall surplus of $12.9 billion in the balance of payments and hence rising international reserves.
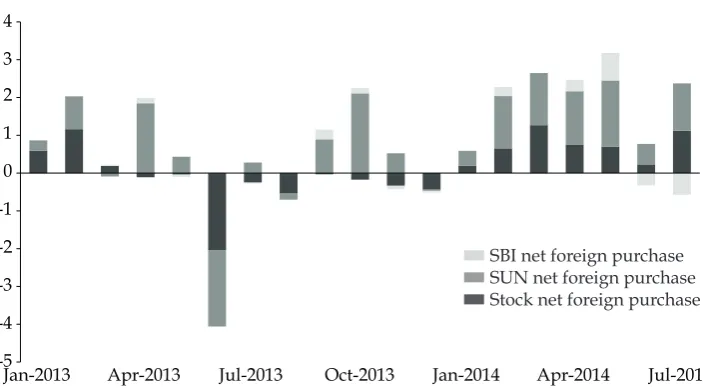
The aggregate igures in table 3 do not reveal any signiicant capital volatility during 2013. To unpack the data, it is useful to examine trends in capital lows among three major asset classes within the broadly ‘short term’ or potentially volatile category: investments in shares listed on the IDX, SBIs, and government bonds (SUNs). Figure 3 shows these data on a monthly basis from January 2013 to July 2014. The pronounced period of capital exodus in June 2013 was reminiscent of a similar exodus in August–October 2011, during the Greek debt crisis. How
-ever, most of the net outlow in the more recent period took the form of shares and SUNs, whereas in the earlier period it was primarily SBIs and SUNs. By early 2014, all items had generally returned to positive balances, with SUNs being the largest component. These results are somewhat counterintuitive: it might have been expected that the share market would be the source of greatest volatility, but this has not always been the case.
TABLE 3 Balance of Payments, 2012–14 ($ billion)
2014
2012 2013 Q1 Q2 Q3
Current account –24.4 –29.1 –4.2 –8.7 –6.8
Exports 187.3 182.1 43.9 44.5 43.6
Non–oil & gas 149.8 146.7 35.8 36.7 36.0
Oil & gas 35.6 33.6 7.6 7.5 7.3
Imports –178.6 –176.2 –40.6 –44.6 –42.1
Non–oil & gas –137.8 –132.9 –30.2 –33.9 –31.7
Oil & gas –40.8 –43.3 –10.3 –10.7 –10.4
Merchandise trade balance 8.7 5.9 3.3 –0.1 1.6
Non–oil & gas 11.9 13.8 5.6 2.7 4.3
Oil & gas –5.2 –9.7 –2.7 –3.2 –3.1
Services –10.6 –12.1 –2.2 –2.9 –2.5
Income –26.6 –26.9 –6.4 –7.2 –7.1
Current transfers 4.1 4.0 1.1 1.5 1.2
Capital & inancial accounts
Capital account 0.1 0.0 0.0 0.0 0.0
Financial account 24.9 21.9 7.6 14.5 13.7
Direct investment 13.7 13.7 2.8 3.7 5.4
Portfolio investment 9.2 9.5 8.7 8.3 7.1
Other investment 1.9 –0.9 –4.5 2.3 1.1
Errors & omissions –0.3 –0.2 –0.7 –1.3 –0.4
Overall balance (change in reserves) 0.2 –7.3 2.1 4.3 6.5
Foreign reserves 112.8 99.4 102.6 107.7 111.2
Source: CEIC Asia Database.
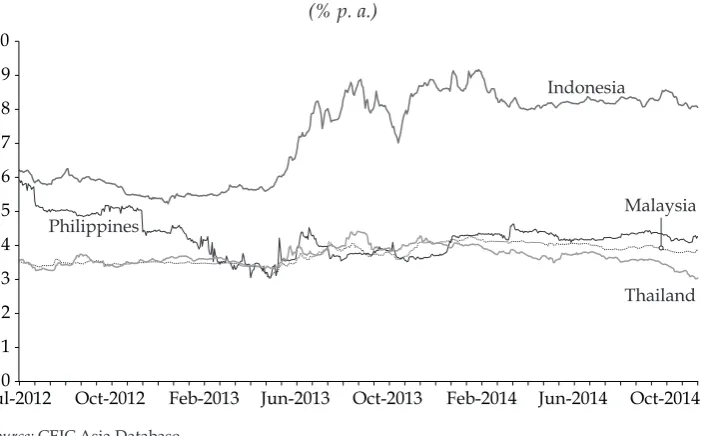
The Bernanke shock served as a reminder that the capital markets still view Indonesia with some reservation. One indicator is the comparative yield on government bonds. For 10year localcurrency government bonds, for example, Indonesia has to pay about four percentage points more than three of its middle income neighbours: Malaysia, the Philippines, and Thailand (igure 4). In fact, the bond yield data, which incorporate the effects of both country and exchangerate risk, reveal three aspects of market perceptions of Indonesia. First, Indonesia has to pay a higher rate on its bonds, relecting its traditionally higher inlation rate and the more stable macroeconomic history of Malaysia and Thailand especially. Second, Indonesia parted company with its neighbours in the wake of the Ber
-nanke shock: its yields rose about four percentage points, whereas there was just a minor impact in the other countries. This differential has persisted for more than a year since the Bernanke announcement. Third, it is interesting to observe the behaviour of the Philippines over this period. Historically, it was grouped with Indonesia, owing to the similarity in the two countries’ macroeconomic histories. In 2011 their yields were very similar. However, they began to diverge in the sec
-ond half of 2012; that is, the Philippine yields dropped signiicantly compared with Indonesia’s, and the Bernanke shock had little impact on Philippine yields.
Thus the Philippines has ‘migrated’ to the lowerrisk club of Malaysia and Thai
-land, enjoying large budgetary savings. It is running both a current account surplus (largely owing to buoyant remittances) and a small iscal surplus (unusual in its macroeconomic history). The conclusion that Indonesian macroeconomic policy
-makers draw from these outcomes is that a prudent iscal policy of adhering to the 3% iscal law limit and restraining the current account deicit, even in a global envi
-ronment of historically low interest rates, could yield savings on interest payments. FIGURE 3 Short-Term Net Capital Flows, 2013–14
($ billion)
Jan-2013 Apr-2013 Jul-2013 Oct-2013 Jan-2014 Apr-2014 Jul-2014 -5
-4 -3 -2 -1 0 1 2 3 4
SBI net foreign purchase SUN net foreign purchase Stock net foreign purchase
Source: We are grateful to Dr Alex Sienaert of the World Bank’s Jakarta ofice for kindly supplying
these data. The original data sources are the Ministry of Finance, BI, and the IDX.
Note: SBI = Sertiikat Bank Indonesia (Bank Indonesia Certiicate). SUN = Surat Utang Negara
(govern-ment bonds).
328 Haryo Aswicahyono and Hal Hill
Returning to the balance of payments, it seems that Indonesia’s position is comfortable for now. On the current account the outlook for exports is mixed, but, as noted below, the resolution of the dispute over the mining export ban and tax should see these exports recover. However, there will be a question mark over Indonesia’s ability to compete in international markets, especially if global economic growth remains sluggish. If the subsidies issue remains unresolved, oil imports will continue to increase, resulting in a quasistructural trade deicit with severe iscal implications. On the capital account, concerns focus on the impact of sudden and unforeseen external shocks, the reliance on shortterm capital lows to inance the current account deicit, the rising shortterm corporate indebtedness, and the currency composition of this external debt. Moreover, like its neighbours, Indonesia still does not have an international inancial safety net in the event of a balanceofpayments crisis: an IMF rescue package is politically offlimits, while the regional inancial architecture in the form of the enhanced and multi
-lateralised Chiang Mai Initiative (the CMIM) remains essentially nonoperational (Menon and Hill 2014). The current policy settings and rhetoric are also sending mixed signals for longterm investors, the very investors that the government is looking to attract in order to inance the deicit.
The End of the Commodity Boom?
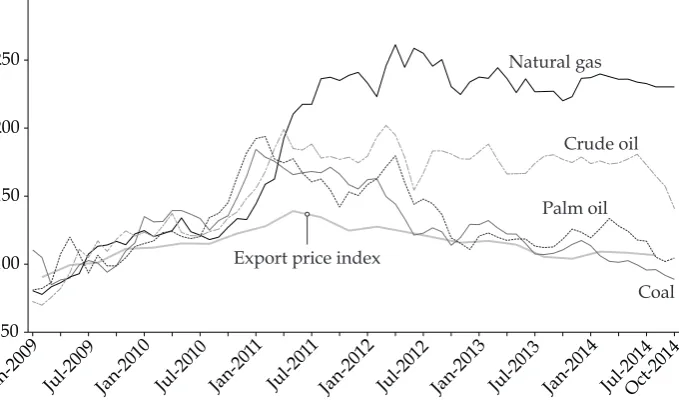
The prices of Indonesia’s major export commodities continue to soften, putting more pressure on both the budget (except, perversely, lower oil prices beneit the budget) and the balance of payments (igure 5). It appears likely that the recent ‘commodity super cycle’ has come to an end, as China’s growth slows, the drivers of its growth switch from investment to consumption, and international produc
-tion capacity for these commodities comes on stream.
FIGURE 4 Comparative Government 10-Year Bond Yields, 2012–14 (% p. a.)
Indonesia
Philippines
Thailand Malaysia
Jul-20120 Oct-2012 Feb-2013 Jun-2013 Oct-2013 Feb-2014 Jun-2014 Oct-2014 1
2 3 4 5 6 7 8 9 10
Source: CEIC Asia Database.
Indonesia’s two major commodity exports in recent years have been palm oil and coal, together accounting for almost onequarter of merchandise exports at the peak of the boom. International prices for both are now at their lowest point in ive years. In the case of palm oil, Indonesia accounts for almost half of global exports, and together with Malaysia about 86% of global supply. In the irst eight months of 2014, palm oil prices in the Kuala Lumpur market fell by about 23%, with further declines considered likely. Favourable weather in the United States has produced a record harvest of soybeans, which provide an alternative oil. Coal prices have fallen steadily since their 2010 peak, and this trend is considered likely
to continue.5 Naturalgas prices have remained quite resilient, and three very
large Indonesian projects are under active consideration, in the ields of Natuna (off Riau, and with potential geopolitical considerations), Makassar, and Maluku. These projects are considered to be relatively expensive and geologically com
-plex. They will need very large external funding and, although the gas sector is not affected by the mining export regulations, the general investment climate for large natural resource projects remains somewhat uncertain.
It is important to put these developments in perspective. As igure 5 indicates, the recent decline in commodity prices constitutes more of a return to ‘normal’ conditions than to the very low prices that prevailed until around 2005. Indonesia
5. China’s recent decision to place restrictions on the import of lowquality coal, commencing January 2015, is thought unlikely to have a major adverse effect on Indonesia (as compared with China’s other major suppliers, Australia and South Africa, given the low sulfur and ash content of Indonesian coal).
FIGURE 5 Major Commodity Prices, 2009–14 (2009 = 100)
Natural gas
Coal Palm oil
Crude oil
Export price index
Jan-2009 Jul-2009 Jan-2010 Jul-2010 Jan-201 1
Jul-201 1
Jan-2012 Jul-2012 Jan-2013 Jul-2013 Jan-2014 Jul-2014Oct-2014
50 100 150 200 250 300
Source: CEIC Asia Database.
Note: Crude oil = petroleum (dated Brent).
330 Haryo Aswicahyono and Hal Hill
looks likely to remain a lowcost producer of most of these commodities, particu
-larly coal and palm oil, especially if its internationally oriented logistics can be improved. Moreover, although the country’s price terms of trade have declined, the large investments over the past decade should mean that its income terms of trade will remain strong—that is, the volume increases may well compensate for the price declines, depending of course on the direction of longterm prices. In
addition, the softening prices ease the upward pressures on the exchange rate,
and also some of the more egregious political excesses that are more likely to occur during an exceptional boom.
CONTINUING DOMESTIC POLICY DRIFT
While Indonesia’s macroeconomic policy framework remains effective, in all other respects the domestic policy narrative and decisions show little indication of the increasingly urgent need to adjust to global economic realities. There are currently four main domestic policy challenges on which little progress has been made in recent years, and which therefore await the new administration. We review each briely.
Rising Minimum Wages
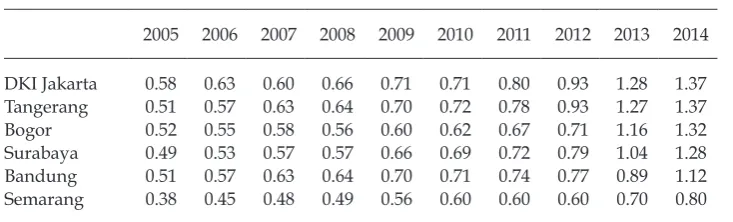
Minimum wages rose steeply in 2013, relecting the political pressures of a pre election year. The increases occurred in all regions, but were particularly pro
-nounced in Jakarta and surrounding regions (table 6).6 These were among the
largest wage increases awarded over the past decade (Cornwell and Anas 2013). With the inlation rate declining, they have translated into very large real wage increases for those workers fortunate enough to secure employment in the formal
sector.7 In retrospect, the timing was unfortunate, coinciding with the declining
terms of trade and a period of inancial market volatility. For labourintensive tradable goods industries, the increases have more than eroded the beneicial
effects of the 2013 depreciation of the rupiah.
The extent of the impact of these wage increases, especially in the tradable goods sectors, depends on trends in productivity and wage trends in competitor countries. The evidence suggests that Indonesian labour productivity has been growing quite slowly over the past decade, and thus these wage increases will have pushed up unit labour costs quite sharply (Aswicahyono and Hill 2014). A mitigating factor is that wages are rising in several middleincome Asian econo
-mies, because of mandated increases (in Thailand, for example), the end of labour surpluses (in coastal China), or both (in Malaysia). However, these economies gen
-erally have superior education outcomes to Indonesia and therefore a greater like
-lihood that wage increases will be absorbed by higher productivity. Proponents of the wage increases in Indonesia argue that irms in Jakarta and surrounding
6. Note also that these data are at the provincial level, and are therefore provincewide minimums. In practice, in the neighbouring kabupaten (districts) of Banten and West Java, where much of the country’s modernsector manufacturing is located, the increases have been much higher, and closer to the Jakarta norm.
7. It is estimated that 39% of the workforce is covered by these regulated wages (World Bank 2010), with substantial lowon effects to others in the formal labour market.
regions, where the wage increases are most pronounced, have the option of relo
-cating to Central Java, where minimum wages are substantially lower. There is some anecdotal evidence that this is happening in the footwear and garments industries. However, the scope for this form of labourmarket adjustment is lim
-ited by three factors. First, Jakarta is the national wagesetter for other major urban centres in Java, so its awards spill over to these cities.8 Second, to relocate,
Jakartabased irms have to close their operations, and thus incur onerous sever
-ance payouts. Third, these irms are penalised by the high logistics costs of getting their products to the major markets of greater Jakarta and Surabaya, and through them to international markets.
No Action on Subsidies
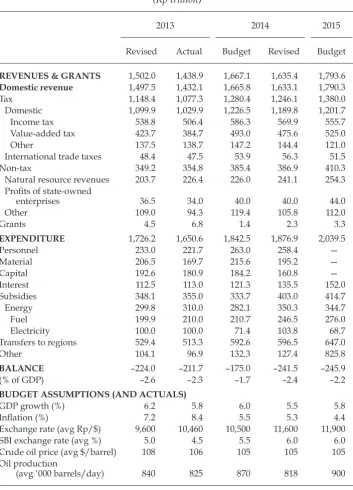
President Yudhoyono delivered his last major budget speech on 17 August, during the traditional Independence Day address. The budget consisted of three major components: a proposed 2015 budget (which has since been approved by parlia
-ment), which basically incorporated businessasusual assumptions for revenue and expenditure; updated estimates for actual 2014 numbers; and inal (though unaudited) igures for 2013 (table 7). The 2014 igures are similar to those reported by Howes and Davies (2014) from the May release and therefore contained few surprises, except that the iscal picture is even tighter than earlier in the year. That is, the subsidies are ballooning still further, while revenue is likely to be softer than expected. Thus the iscal tightening on the expenditure side has had to be even more stringent than planned.
The budget serves as a reminder that, without reform, the government’s iscal policy space is severely limited. Out of total expenditure of Rp 2,039.5 trillion in the 2015 budget, Rp 647 trillion will go directly to subnational governments. In these straitened iscal times, there is mounting concern within government about the increasing amount of unspent funds controlled by local governments (esti
-mated at about Rp 116 trillion at the end of 2013), and about the continuing lag in
8. This Jakarta pacesetter effect appears to have become increasingly important in recent years (Chris Manning, pers. comm.).
TABLE 6 Minimum Wages in Java, 2005–14 (Rp million per month)
2005 2006 2007 2008 2009 2010 2011 2012 2013 2014
DKI Jakarta 0.58 0.63 0.60 0.66 0.71 0.71 0.80 0.93 1.28 1.37
Tangerang 0.51 0.57 0.63 0.64 0.70 0.72 0.78 0.93 1.27 1.37
Bogor 0.52 0.55 0.58 0.56 0.60 0.62 0.67 0.71 1.16 1.32
Surabaya 0.49 0.53 0.57 0.57 0.66 0.69 0.72 0.79 1.04 1.28
Bandung 0.51 0.57 0.63 0.64 0.70 0.71 0.74 0.77 0.89 1.12
Semarang 0.38 0.45 0.48 0.49 0.56 0.60 0.60 0.60 0.70 0.80
Source: We are grateful to Chris Manning of The Australian National University for supplying these
data. The original data are from the Ministry of Manpower and Transmigration.
332 Haryo Aswicahyono and Hal Hill
local infrastructure spending, while local spending on salaries rises. Indeed, the
new inance minister, Professor Bambang Brodjonegoro, has, in the past, gone so far as to state that these large regional transfers are ‘the greatest threat to macro
-economic stability’ (Jakarta Post, 20 Aug. 2014).
Energy subsidies also continue to increase: for fuel to Rp 276 trillion and for electricity (even with the 2013 price increases) to Rp 68.7 trillion. As noted, it was hoped that there would be a joint announcement about subsidy reform by the out
-going and incoming presidents, a grand unifying national gesture under which both parties could claim some credit and neither would solely wear the oppro
-brium of the subsequent price increases. But after an inconclusive Bali summit in late August, hopes vanished.9 Indonesia is now uncomfortably close to exceed
-ing the provisions of Law 17/2003 on State Finance, which stipulate that deicits should not exceed 3% of GDP. (It is of course well under the public debt limit of 60% of GDP.) In fact, in practice the government may have already exceeded the limit, depending on precisely when and how the government’s subsidy transfers to the state oil and electricity companies (Pertamina and PLN, respectively) are treated, and also some of its allocations to regional governments under revenue sharing arrangements.10
The 2015 budget marks the beginning of direct funding to villages, as prescribed by Law 6/2014 on Villages (Howes and Davies 2014). The initial allocation for 2015 is Rp 9.1 trillion, which is targeted to rise to 10% of total regional grants over the next four years. If this grant program were to be fully implemented in 2015, the allocation would have been Rp 64 trillion, allocated as a block grant to the nation’s 72,000 villages. This is an issue to watch. Proponents of the grants argue that vil
-lages were the missing piece of subnational architecture in the 1999 regional autonomy laws, and that locallevel accountability and vigilance will ensure sen
-sible expenditure decisions. However, there are three main concerns. First, the grants constitute another essentially unfunded budget allocation, to the extent that they involve new money over and above the earlier allocations under the Program Nasional Pemberdayaan Masyarakat community development programs. Second, there are certain to be dificulties related to governance and absorptive capacity, most likely on a scale greater than that for kabupaten (districts), especially in the
more remote villages where ‘dynastic’ rule is entrenched.11 Third, it is envisaged
that part of the village funding will be provided by provinces and kabupaten, and it
is not dificult to imagine that they will be reluctant funding participants.
9. The hopes have vanished but the speculation for the inaction has not. Much of the lat-ter has centred on the alleged negotiations, including over possible legal immunities to protect powerful igures in and connected to the outgoing administration. Another factor appears to be former president Megawati Sukarnoputri’s refusal to engage with President Yudhoyono, owing to her lingering resentment at her sense of being ‘betrayed’ in 2003–4. 10. It is thought likely that these delayed payments, technically ‘arrears’, could be quite large, perhaps in excess of Rp 40 trillion. The resignation of the highly regarded president director of Pertamina, Karen Agustiawan, in August, a little over a year after her reappoint-ment to a second term, inevitably fuelled rumours connected to the subsidy and arrears is-sues. There has been periodic panic buying of subsidised gasoline products, in anticipation that the subsidy quota will soon be exhausted.
11. For the release of funds, each village will have to prepare a full budget proposal that is in turn signed off by a higher level of government. This procedure alone is likely to be complex.
(Rp trillion)
2013 2014 2015
Revised Actual Budget Revised Budget
REVENUES & GRANTS 1,502.0 1,438.9 1,667.1 1,635.4 1,793.6 Domestic revenue 1,497.5 1,432.1 1,665.8 1,633.1 1,790.3
Tax 1,148.4 1,077.3 1,280.4 1,246.1 1,380.0
Domestic 1,099.9 1,029.9 1,226.5 1,189.8 1,201.7
Income tax 538.8 506.4 586.3 569.9 555.7
Value-added tax 423.7 384.7 493.0 475.6 525.0
Other 137.5 138.7 147.2 144.4 121.0
International trade taxes 48.4 47.5 53.9 56.3 51.5
Non-tax 349.2 354.8 385.4 386.9 410.3
Natural resource revenues 203.7 226.4 226.0 241.1 254.3
Proits of stateowned
enterprises 36.5 34.0 40.0 40.0 44.0
Other 109.0 94.3 119.4 105.8 112.0
Grants 4.5 6.8 1.4 2.3 3.3
EXPENDITURE 1,726.2 1,650.6 1,842.5 1,876.9 2,039.5
Personnel 233.0 221.7 263.0 258.4 —
Material 206.5 169.7 215.6 195.2 —
Capital 192.6 180.9 184.2 160.8 —
Interest 112.5 113.0 121.3 135.5 152.0
Subsidies 348.1 355.0 333.7 403.0 414.7
Energy 299.8 310.0 282.1 350.3 344.7
Fuel 199.9 210.0 210.7 246.5 276.0
Electricity 100.0 100.0 71.4 103.8 68.7
Transfers to regions 529.4 513.3 592.6 596.5 647.0
Other 104.1 96.9 132.3 127.4 825.8
BALANCE –224.0 –211.7 –175.0 –241.5 –245.9
(% of GDP) –2.6 –2.3 –1.7 –2.4 –2.2
BUDGET ASSUMPTIONS (AND ACTUALS)
GDP growth (%) 6.2 5.8 6.0 5.5 5.8
Inlation (%) 7.2 8.4 5.5 5.3 4.4
Exchange rate (avg Rp/$) 9,600 10,460 10,500 11,600 11,900
SBI exchange rate (avg %) 5.0 4.5 5.5 6.0 6.0
Crude oil price (avg $/barrel) 108 106 105 105 105
Oil production
(avg ’000 barrels/day) 840 825 870 818 900
Sources: CEIC Asia Database; data from the Ministry of Finance (2014); Jakarta Globe (28 Sep. 2014).
Note: SBI = Sertiikat Bank Indonesia (Bank Indonesia Certiicate).
334 Haryo Aswicahyono and Hal Hill
In spite of Indonesia’s impressive iscal consolidation over the past decade, the government is conscious of its debtservicing requirements in an uncertain global economic environment. It is actively seeking to increase the proportion of the is
-cal deicit that is funded through longerterm, rupiahdenominated loans. Of the current outstanding debt, about 56% is denominated in rupiah, 28% in US dol
-lars, and 11% in yen. It is likely the government will require that a portion of the signiicant funds held in government accounts be allocated to government bonds. This includes the funds held by the Social Security Management Agency and the Haj Fund (Tabungan Haji) into which Indonesian citizens contribute in prepara -tion for their haj. Accounts held in BI are obviously offlimits under this proposal.
On the revenue side, tax revenue is rising slowly, projected to be Rp 1,380 tril
-lion in 2015, an increase of just 10.7% (that is, little more than the nominal GDP increase) over the revised 2014 budget. Even this modest increase is considered optimistic, given likely weaker corporate earnings; if consumption growth slows, the government’s VAT collections will be below forecast. As noted by Howes and Davies (2014), the government therefore has little choice but to cut its expendi
-tures. In the crucial infrastructure budget, for example, the Department of Public Works is to receive the same allocation in 2015 as it did in 2014, Rp 74.5 trillion, a reduction of about 6% in real per capita terms.
In the 2015 budget, the government assumes a yield for threemonth treasury bonds of 6.0%, the same as that in 2014. It also assumes that the government will inance Rp 304.9 trillion from government bonds, 25% of which would be foreign currency bonds. The latter have lower rates but obviously present an exchange rate risk. The events of 2013–14 serve as a reminder that this risk could be substan
-tial, and the government does not want to be hostage to exchangerate volatility in setting its iscal policy framework.
There continues to be a debate about whether Indonesian iscal policy is exces
-sively cautious. Global interest rates are historically low, and many investment projects in Indonesia have high social rates of return, in infrastructure and else
-where. The country has a credible record of macroeconomic management, but
-tressed further by Law 17/2003 on State Finance and an independent, professional central bank. It also has an investmentgrade rating with two major ratings agen
-cies (Fitch Ratings and Moody’s), though not with Standard and Poor’s. Thus far the government has been able to issue bonds without dificulty. So, the argument goes, why not advertise its macroeconomic strengths more vigorously in inter
-national inancial markets and lock in the available borrowing opportunities at exceptionally favourable terms? It has done this to some extent already. But given Indonesia’s highly open capital market and the large yield differential between dollar (and other currency) interest rates abroad and rupiah rates at home, the worry persists that any large yet volatile capital inlows may have implications for the government’s deicitinancing program.
Moreover, as noted above, the government has practically no iscal policy space. The assumptions underlying the current budget illustrate how inely tuned the calculations are. For example, the Ministry of Finance assumes the following in its budget sensitivity analysis:
• an increase of 0.1 percentage point in the GDP growth rate will improve the
iscal balance by about Rp 1 trillion
• a depreciation of Rp 100 against the US dollar will worsen the iscal position
by about Rp 3.5 trillion
• an increase in the Indonesian crude price (of oil) of $1 will worsen the iscal
position by about Rp 3.5 trillion
• an increase in oil output of 10,000 barrels per day will improve the iscal
position by about Rp 1.7 trillion
• an increase of one percentage point in the inlation rate will improve the iscal
position by about Rp 5.5 trillion
The general direction of these effects is selfevident, but it is notable that two fac
-tors that would generally be considered positive for the Indonesian economy—a lower inlation rate and a weaker rupiah—have negative iscal implications.
Financial Fragility: A ‘Sleeper’ Issue?
While Indonesia’s macroeconomic indicators look comfortable for now, less dis
-cussed are some possible emerging vulnerabilities in the inance sector. Here, too, on the surface the sector appears to be quite healthy and weathering global inan
-cial volatility. The shocks of 2013 did not distress any inan-cial institutions. Credit growth has been moderating, the various corporate leverage ratios are no cause for alarm, nonperforming loans are reportedly low and, with the possible excep
-tion of pockets of Jakarta real estate, there do not appear to be any asset price bubbles of concern. For example, the inancial indicators data classify banks into three groups—principally, state banks, private national banks, and foreign and jointventure banks—and on a net basis the nonperforming loans range from 0.04% to 2.40%.
Nevertheless, the growth in deposits is slowing, as are corporate cash lows, while loantodeposit ratios are rising, forcing banks to raise their deposit rates. Three interrelated events—capital volatility, declining terms of trade, and the resulting iscal and monetary tightening—have placed pressure on the inance sector. Moreover, the process of inancial innovation and complexity continues apace, posing continuous challenges for policymakers. Overcoming past crises
does not guarantee that the next challenge will be benign.
In 2014 two main sets of issues are occupying the attention of inancial regula
-tors. The irst is whether certain structural features of the country’s banking sector render Indonesia inancially vulnerable. Indonesia’s four largest banks—Mandiri, BNI, BRI, and BCA—together account for about 80% of deposits. They attract a ‘safety discount’ (that is, lower deposit rates), since they are regarded as the most secure institutions, protected also by the government’s deposit guarantee, which applies to deposits up to Rp 2 billion.12 Among the remaining small and
medium banks, 116 in total, the situation is less clear. Some of these banks strug
-gle to attract deposits, particularly when liquidity is tight, as it is at present. They therefore generally have to offer higher rates, which potentially squeezes their proitability and renders them more vulnerable to a sudden loss of conidence.
12. It is estimated that about 50% of deposits, by value, in Indonesian banks are covered by this guarantee.
336 Haryo Aswicahyono and Hal Hill
As noted, the nonperforming loans look comfortable. However, an alternative indicator, the loantodeposit ratio, is being watched closely by the authorities. The combined effects of monetary tightening and slight nervousness in the mar
-kets have put pressure on medium and small banks. That is, depositors have made something of a ‘light to safety’ to the four largest banks, three of which are majority governmentowned, with the result that loantodeposit ratios have increased signiicantly since early 2013, by about seven percentage points (ig
-ure 6). The increase has occurred across all three bank groups, with the sharpest increase evident among foreign and jointventure banks, for which the ratio is now over 1.4.
Underlying this issue is the broader question of whether Indonesia has a domestic inancial safety net, a lender of last resort in the case of a sudden bank crisis. For complex political economy reasons, it does not. Suppose, for exam
-ple, that there was another Bank Century—that is, a midsized bank (assuming plausibly that it would not be one of the big four) that experiences a liquidity or insolvency problem. In all likelihood, the cost of any bailout would not be great, but quick action would be needed to prevent any generalised contagion emerg
-ing. The mechanism for crisis resolution involves coordinated action by several government agencies: the Ministry of Finance, for budget support; BI, for mone
-tary policy; the Financial Services Authority (Otoritas Jasa Keuangan) as inancial regulator; and the Deposit Insurance Institution (Lembaga Penjamin Simpanan), as the deposit guarantor (Allford and Soejachmoen 2013). However, legislation to enact the coordinating agency that is designed to manage a crisis, the Financial Safety Net (Jaring Pengaman Sistem Keuangan), has yet to be passed by the DPR
and is not in prospect.
The problem has arisen essentially because the 2008 Bank Century case con
-tinues to have a toxic aftermath. It led to the demise of former inance minister FIGURE 6 Loan-to-Deposit Ratios in the Banking Sector, 2012–14
Foreign & joint-venture banks
Private national banks
Jul-2012Sep-2012Nov-2012Jan-2013Mar-2013May-2013 Jul-2013Sep-2013Nov-2013Jan-2014Mar -2014
May-2014 Jul-2014Sep-2014 0.8
0.9 1.0 1.1 1.2 1.3 1.4 1.5 1.6
State banks Total
Source: CEIC Asia Database.
Indrawati and, regrettably, it continues to embroil outgoing vicepresident Boe
-diono. Masquerading under the banner of protecting state inances, members of the legislature have behaved unconscionably, inding it politically convenient to block the passage of the law establishing this lender of last resort. In such a legal vacuum, no government oficial would dare sign off on a bank rescue package, out of fear that the case would be referred to the Corruption Eradication Com
-mission (Komisi Pemberantasan Korupsi [KPK]). As one senior oficial wryly observed, ‘When the next bank crisis occurs, the KPK will have to sort it out’.
The uncertainty evident in the foreign exchange market in 2013 has now abated. This uncertainty arose because BI initially engaged in different moral sua
-sion exercises to stem the decline of the rupiah, which began to fall quickly in mid2013 (Armstrong and Rahardja 2014). For several months there was a gap between the spot and forward (or expected future) rates. Figure 7 indicates the spread between the two rates in 2012–14. The spread peaked at almost 7% and persisted until about October 2013, by which time it was clear that BI had decided to let the rupiah loat downwards. With the changed policy stance, the gap virtu
-ally disappeared, and the decline in foreign exchange reserves was reversed. This was the largest gap since the height of the global inancial crisis in late 2008 and early 2009.
Rising Economic Nationalism: No Respite
There have been no major trade and investment initiatives since July 2014; but of course the nationalist rhetoric in the election campaigns was starkly evident, and it will not be easy to turn around the prevailing sentiment. The mining export ban and subsequent modiication in the form of an export tax in exchange for
FIGURE 7 The Gap between the Forward and Spot Rp/$ Exchange Rates, 2012–14 (Rp)
Jul-2012Aug-2012Oct-2012Dec-2012Feb-2013Apr-2013Jun-2013Aug-2013Oct-2013Dec-2013Feb-2014Apr-2014Jun-2014Aug-2014Oct-2014 -200
-100 0 100 200 300 400 500 600 700 800
Source: CEIC Asia Database.
Note: Forward rate = BI’s forward rate (oneweek average).
338 Haryo Aswicahyono and Hal Hill
the establishment of processing facilities, discussed extensively in recent BIES
surveys, has been resolved for now.13 However, as with the log export bans of
the past, the result will be lower government revenue (as compared with a tough miningtax regime), some country reputational damage, and the impending establishment of what will in all likelihood be highcost processing facilities.
FreeportMcMoRan resumed copper exports in late August, after a seven month hiatus. As part of the resumption, the royalties it pays have increased, to 4.00% for copper and 3.75% for gold (up from 3.50% and 1.00%, respectively), and the company has agreed to provide an assurance bond of $115 million in support of its commitment to build a second copper smelter. Meanwhile, the other major mining company affected by the export regulations, Newmont, has dropped international litigation proceedings and is in negotiation with the government.
One development of concern to the business community is the bill to limit foreign ownership in plantation companies to no more than 30% (the current limit is 95%). The major foreign investors in this industry are Malaysian and Singa porean, and the major crop is palm oil.14 As noted, this development comes as
palmoil prices have fallen signiicantly. Although it is not thought that the new law is explicitly directed at neighbouring business interests, one cannot avoid the irony that it is being planned on the eve of the launching of the ASEAN Economic Community, with its objective of establishing a ‘seamless’ ASEAN economy.
In another indicator of the strength of economic nationalism, a law restricting foreign ownership in life and general insurance companies is in prospect. Cur
-rently capped at 90%, this limit may be reduced to minority ownership. There is also a debate about whether the proposed caps would be retrospective or applied only to new investors.
BACK TO MANUFACTURING?
As commodity prices weaken, a key engine of recent Indonesian economic growth slows. Assuming that commodity prices remain subdued, where will growth come from? At a general level, it will have to be the noncommodity sectors, particularly manufacturing and services, assuming that the longterm agricultural growth rate will not exceed 3%. In fact, as shown above, the nontradables sectors have per
-formed quite well over the past decade. The manufacturing sector has grown more slowly, and much of the policy discussion now focuses on measures to ‘revitalise’ it. While the dominant political narrative is protectionist and inwardlooking, as manifested in Law 3/2014 on Industry and Law 7/2014 on Trade (see Howes and Davies 2014), the presidential election campaign, and much else, the only feasible way to revitalise the manufacturing sector is to create a policy environment in which manufacturing will become more eficient and productive.
13. The negotiations were completed shortly before the then minister of energy and min-eral resources, Jero Wacik, was named as a suspect by the KPK, forcing his resignation. This is, incidentally, the third corruption indictment against a member of the Yudhoyono cabinet in the past two years.
14. To complicate this picture further, it is thought that there are large Indonesian holdings in Singaporelisted plantation companies. That is, Indonesian investors have sought the higher regulatory quality and political protection that a Singapore listing confers.
Manufacturing continues to grow quite slowly, at about 5%–6% per year (table 8), or about half that of most of the Soeharto period. Its growth has been con
-strained by the large but stagnant oil and gas processing subsector, but the other subsectors are also growing quite slowly. Thus, there is no revival discernible to date. Among the major subsectors there is considerable volatility, such that generalisations are dificult. Food processing is growing quite fast, much of it in palm oil. The automotive industry has been growing strongly, buoyed by strong domestic demand, import protection, and some modest exports. The heavy resourcebased industries, still with signiicant state ownership—such as petro
-chemicals, cement, and steel (corresponding to International Standard Industrial Classiication codes 36–38), have slowed signiicantly in the past two years. The traditional labourintensive industries of textiles, garments, and footwear are also growing quite slowly.
Indonesia’s export record illustrates the combined effects of lower commod
-ity prices and weak global demand. Merchandise exports remain reasonably diversiied—a strength in times of adversity—with manufactures accounting for almost twothirds of the total (table 9). Yet in 2012, 2013, and the irst three quarters of 2014 the value of exports declined; the sharpest decline was in min
-ing, led by the large coal sector, but gas and oil also fell.15 Agricultural export
growth is holding up, but these exports make up just over 3% of the total. Within the large manufacturing sector, the record is mixed. Agricultural processing of palm oil and rubber still dominates the sector, but prices of both commodities are below their 2012 peaks and are likely to decline further. In textiles, garments, and other labourintensive products, Indonesia has been steadily losing market share; policy makers appear to be resigned to this trend continuing, in view of labour and other domestic supplyside constraints. In electronics, the largest and most dynamic part of East Asian trade, and in which Indonesia has been a relatively minor participant, exports have been declining since 2012.
There is also no evidence to date that resources are moving into the manufactur
-ing sector in response to the declin-ing terms of trade. This is illustrated by various ‘quick release’ indicators, omitted here for reasons of space.16 The share of manu
-facturing in bank lending continues to be quite small, around 15%–20%, and has remained fairly stable since 2010. BKPM’s realised investment statistics show a higher share for manufacturing, around 40% in the irst half of 2014. But it is a vola
-tile series, with no clear trend, and excludes investments in inance, oil, and gas. In response to this sluggish growth, much of the oficial rhetoric continues to emphasise a deadend strategy of protection. This has been manifested recently in discussions about the impact of the ASEAN Economic Community, to take effect from December 2015, and the planned Regional Comprehensive Economic Part
-nership among 16 AsiaPaciic economies (that is, ASEAN Plus 6), to be inaugu
-rated in 2015. Predictably, a senior oficial in the Ministry of Industry was quoted in the press as stating that ‘some of our industrial products are not strong enough to compete with foreign products, so protection will be needed’ (Jakarta Post, 21
Aug. 2014). More direct still were the remarks of outgoing industry minister M. S. Hidayat on policy priorities: the government, he argued, should learn from past
15. Indonesia is of course a net oil importer, but it still exports crude oil. 16. These indicators are available from BKPM and BI.
340 Haryo Aswicahyono and Hal Hill
mistakes, and needs to issue ‘bolder and more protectionist regulations, including more iscal incentives and nontariff barriers’. Moreover, he said, ’basic industry is most important, as it prevents massive imports’ (Jakarta Post, 20 Aug. 2014).
Symptomatic of this approach is Indonesia’s decision not to participate in the current Genevabased negotiations concerning a second round of the Interna
-tional Technology Agreement (ITA), ITA II. The ITA governs the trade in electronic components. Recognising the reality of global production networks, and that inal electronics products include components produced in many countries, there is free trade for components among signatories to the ITA. This has been the fastest growing sector of trade in East Asia, including ASEAN. For example, about half of intraASEAN trade now consists of electronics components (Athukorala 2010). Originally the ITA focused mainly on components, but the distinction between components and inal goods is now increasingly blurred. Therefore, under ITA II it is proposed to extend freetrade coverage to electronic products. Several major electronics producers, among them Singapore, Malaysia, and Japan, have already signed the accord. China is central to the outcome, since it increasingly hosts the major inal assembly stage. It is involved in the negotiations though is not yet a signatory. Indonesia has decided not to participate in the negotiations, presum
-ably owing to concerns that its already protected electronics goods industries will come under further pressure. Already missing out on regional trade opportunities (Soejachmoen 2012), Indonesia will become an even more minor participant in the ITA, the most dynamic segment of East Asian trade.
Indonesia’s exchangerate depreciation of 2013 is the only signiicant policy lever shifting resources into a more internationally oriented manufacturing sector.
TABLE 8 Manufacturing Growth, by Industry, 2010–14 (% year-on-year)
2010 2011 2012 2013 2014a
Manufacturing 4.7 6.1 5.7 5.6 4.9
Oil & gas 0.6 –0.9 –2.8 –1.8 –1.1
Petroleum reinery 1.2 0.5 –1.9 1.0 2.1
Liqueied natural gas 0.0 –2.1 –3.5 –4.3 –4.0
Excluding oil & gas 5.1 6.7 6.4 6.1 5.3
Food, beverage & tobacco 2.8 9.1 7.6 3.3 8.8
Textile, leather products & footwear 1.8 7.5 4.3 6.1 3.5
Wood & wood products –3.5 0.3 –3.1 6.2 7.3
Paper & printing 1.7 1.4 –4.8 4.5 5.1
Fertilisers, chemicals & rubber 4.7 4.0 10.5 2.2 1.0
Cement & nonmetallic mineral 2.2 7.2 7.8 3.0 1.2
Iron & basic steel 2.4 13.1 5.8 6.9 3.1
Transport equipment machinery & apparatus 10.4 6.8 7.0 10.5 4.7
Other manufacturing products 3.0 1.8 –1.1 –0.7 10.8
Tradables 4.1 4.5 4.7 4.3 3.7
Non-tradables 8.2 8.2 7.6 7.0 6.3
Source: CEIC Asia Database.
aData for 2014 are for the irst three quarters of the year only.
As noted, the other major policy settings are acting to nullify the depreciation’s potentially beneicial effects. In addition, the country’s infrastructure deicit is becoming ever more serious. Indeed, as noted, real publicsector infrastruc
-ture expendi-ture is scheduled to decline in the 2015 budget, even as grandiose megaprojects of dubious economic viability and business patronage are still being proposed—including the Sunda Strait Bridge, connecting Sumatra and Java, and a seawall to protect Jakarta from tidal lows.17
17. However, at least one major infrastructure project, Jakarta’s mass rapid transit sys-tem, has inally got off the ground. The incoming president can rightly claim signiicant credit for this project, which had been under active discussion since the 1970s. Sensibly, Singapore’s excellent mass transit system was seen as a model for Jakarta.
TABLE 9 Value and Growth of Exports, 2010–14
2010 2011 2012 2013 2014a
Value, by commodity ($ billion)
General merchandise 148.9 189.4 185.3 180.3 115.6
Agricultural products 4.9 5.1 5.6 5.8 3.8
Manufactured products 93.0 115.8 115.5 113.2 78.5
Palm oil 12.9 16.7 17.7 16.5 11.4
Textile and textile products 11.2 13.2 12.5 12.8 8.6 Electrical apparatus, measuring
instruments, & optics 8.2 8.6 11.2 10.7 6.7
Processed rubber 9.2 14.1 10.4 9.3 4.9
Base metal products 9.0 10.8 9.3 8.6 6.1
Mining products 49.7 66.6 61.8 58.8 31.6
Coal 17.8 26.9 26.2 24.4 14.3
Natural gas 13.0 18.2 17.7 15.7 10.4
Crude oil 11.2 14.2 12.7 12.2 6.1
Growth, by commodity (% yearonyear)
General merchandise 27.2 –2.2 –2.7 –2.0
Agricultural products 2.9 10.0 3.6 3.9
Manufactured products 24.6 –0.3 –2.0 6.0
Palm oil 29.6 5.8 –6.6 8.5
Textile and textile products 17.9 –5.0 2.1 0.1
Electrical apparatus, measuring
instruments, & optics 5.4 29.9 –4.0 –6.2
Processed rubber 53.1 –26.4 –10.2 –22.0
Base metal products 19.8 –13.6 –7.4 5.6
Mining products 34.0 –7.3 –4.8 –18.2
Coal 51.3 –2.5 –7.2 –13.5
Natural gas 40.3 –2.9 –11.2 1.1
Crude oil 26.3 –10.2 –4.2 –23.7
Sources: Authors’ calculations; data from BI (2014, table V.10).
aData for 2014 are for January–August only.
342 Haryo Aswicahyono and Hal Hill
Here, too, subsidies affect the infrastructure outlook, not only by tilting the incentives towards automobiles over mass transit rail but also by raising the spectre of a looming energy crisis. Indonesia consumes about 1.5 million barrels of fuel equivalent per day. Almost half (44%) comes from oil, with coal provid
-ing 27%, gas 23%, and renewables 6%. The National Energy Council has recom
-mended an energy mix of 25%, 30%, 22%, and 23%, respectively, by 2025 (Jakarta Post, 20 Aug. 2014). As long as oil is so heavily subsidised, there will be little
incentive to switch to other energy sources, or to meet the extremely ambitious renewables target. The council’s proposed energy mix implies that coal will be the largest energy source in a decade’s time, with implications for Indonesia’s attempts at climatechange mitigation.
One hopeful infrastructurerelated development is Law 2/2012 on the Acqui
-sition of Land for Development in the Public Interest, scheduled to replace the current, nonfunctional law (Law 5/1960) on 1 January 2015. Under the new law, landowners will be forced to sell their property if the land is considered essential to a project. The law also stipulates just compensation—itself a thorny issue—and a 60day public consultation process.
SUMMING UP: LOOKING FORWARD TO A NEW ADMINISTRATION With the events of 1997–98 still etched deeply into the nation’s psyche, Indonesian policymakers have a clearly articulated view of how to respond to the volatility that occurred in 2013: they will choose stability over growth. That is, they will opt for a lower, albeit safer, growth rate over a higher and riskier one. According to this argument, the principal risk comes from sudden capital light triggered by a per
-ception in international capital markets of elevated country risk for Indonesia and other emerging economy markets.18 The key indicator to watch in this narrative is
the current account in the balance of payments: if it exceeds 3% of GDP, as it did in the irst half of 2013 and again in the second quarter of 2014, the solution is to apply the brakes, through tighter iscal and monetary policy and a depreciating rupiah.
Is this the right strategy for Indonesia? The reasoning is understandable: a growth collapse of 20 percentage points, as occurred in 1997–98, is traumatic. In the view of many, it threatened the nationstate, not to mention its contribu
-tion to lost growth and corporate and social hardship. The economics textbooks may assert the eficacy of the eficientmarket theorem and contend that current account deicits do not matter. But Indonesia’s economic policymakers fear a sudden capital light, their fears premised on the political economy constraints in which they operate. That is, the current policy environment is discouraging longterm capital lows in the form of foreign direct investment that could be used to inance a larger current account deicit. Moreover, there is also a worry that the larger iscal deicits created by a more aggressive borrowing program
18. Indonesian policymakers are not alone in these views. See, for example, the observa-tions of perhaps the most inluential central banker in the developing world, Raghuram Rajan: ‘Six years since the inancial crisis, central banks still have their foot fully on the ac-celerator … [pushing] credit into the emerging markets. We don’t know how it will end. It may end smoothly … or by a series of minicrises. But it may be more dramatic’ (Financial Times, 16–17 Aug. 2014).