Lat. Am. J. Phys. Educ. Vol. 6,No. 3, Sept. 2012 347 http://www.lajpe.org
Teaching-Learning
through
innovative
experiments: An investigation of s
tudents’
responses
Umapati Pattar
1, Vijay H. Raybagkar
2and Suresh Garg
3 1Department of Physics, Vijayanagar College, Hospet, Karnataka, India. 2
Principal, SSR Science, Commerce, and Arts College, Silvasa, India. 3
Professor, School of Sciences, IGNOU, New Delhi, India.
E-mail: [email protected]
(Received 5 May 2012, accepted 16 September 2012)
Abstract
The primary objective of performing a physics experiment is to gain procedural as well as conceptual understanding. Some of the researches reported in Physics Education emphasize the importance of introducing innovations in physics experiments so as to improve clarity as well as the depth of learning experiences. In this paper, we report the impact of seven experiments designed in different branches of physics and systematically tried on college students. We observe a significant enhancement in the conceptual understanding of the students after exposure to the treatment.
Keywords: Innovative experiments, Posttest, Solomon four group analysis.
Resumen
El principal objetivo de llevar a cabo un experimento de Física es obtener un procedimiento, así como el entendimiento conceptual. Algunas de las investigaciones reportadas en la Enseñanza de la Física hacen hincapié en la importancia de introducir innovaciones en los experimentos de Física con el fin de mejorar la claridad así como la profundidad de las experiencias de aprendizaje. En este trabajo, informamos el impacto de los siete experimentos diseñados en diferentes ramas de la Física y tratados sistemáticamente en los estudiantes universitarios. Observamos un mejoramiento significativo en la comprensión conceptual de los estudiantes después de la exposición al tratamiento.
Palabras clave: Experimentos innovadores, Postest, Análisis del cuarto grupo Salomón.
PACS: 01.40.-d, 01.50.Pa, 01.30.-y ISSN 1870-9095
I. INTRODUCTION
Traditionally, laboratory work has been incorporated in the curricula of various science and engineering courses to enrich teaching-learning experiences [1]. The reasons for doing so are many and varied. Some of the prime reasons include:
To acquire hands-on skills and experience in the use of
materials, scientific instruments and laboratory
equipment; say–microscopes for biology, pipettes for
chemistry and design of circuits for physics;
To develop an understanding of the concepts and
content taught in theory courses;
To gain experience in scientific method;
To learn how to write clear and concise reports on
investigations;
To apply scientific knowledge and methods to
manipulate dysfunctional components;
To design new experiments and/or fabricate new
equipment; and
To appreciate the ways in which scientists work.
These and such other justifications are embedded in the objectives of most laboratory programmes. General goals of science laboratories are outlined in studies reported in [2, 3, 4]. The physics-oriented perspectives on goals of undergraduate laboratories are discussed in [5, 6]. Agrest [7] highlighted the importance of innovation in physics
experiments as, “In my opinion it is important to bring
some ‘flavor‘
Lat. Am. J. Phys. Educ. Vol. 6,No. 3, Sept. 2012 348 http://www.lajpe.org
The logical questions that arise for realization of this philosophy in the context of physics are: How is an actual laboratory conducted? What skills are being developed in a laboratory course? Could any of the skills be developed outside the expensive laboratory environment? How well is the laboratory time utilized? Against this background, we undertook a research study to look into the level of conceptual understanding developed through traditional laboratories (Phase-1). Subsequently, we designed a few innovative experiments in different branches of physics and conducted them on the students to assess their effectiveness (Phase-2). The findings of phase-1 were reported recently [8]. In this paper, we report the outcome of phase-2.
The Method
In phase-1, we conducted a survey on a large sample of college students during August-September of 2009 to evaluate the procedural (or conceptual?) understanding on laboratory teaching. Two tools consisting of objective type questions were developed and administered to about 500 students from 14 colleges to assess the effectiveness of physics teaching through traditional laboratory experiments. The findings of the item analysis were used to design innovative experiments, particularly to seek answers for the following two research questions:
Q1. What is the existing level of understanding of the
concepts and/or theory underlying a physics
experiment?
Q2. Which concepts are perceived hard on which designing innovative experiments will help improve
student’s learning?
A part of the data collected during the survey was also used as pre-test data. The research process has been conceptualized using the framework described by [9, 10]. The theoretical perspective of our study is post-positivism whereby we explore student experiences of experimental laboratories in a quantitative manner [11]. The chosen study design is truly experimental within an authentic educational setting. The data collected is quantitative and we use statistical analysis using suitable computer software for speedy yet reliable results.
A. The sample description
Physics is studied as one of the three optional subjects of equal weightage in B.Sc programme at Gulbarga University, Gulbarga, in Karnataka State of India. The programme is spread over three years (6 semesters).
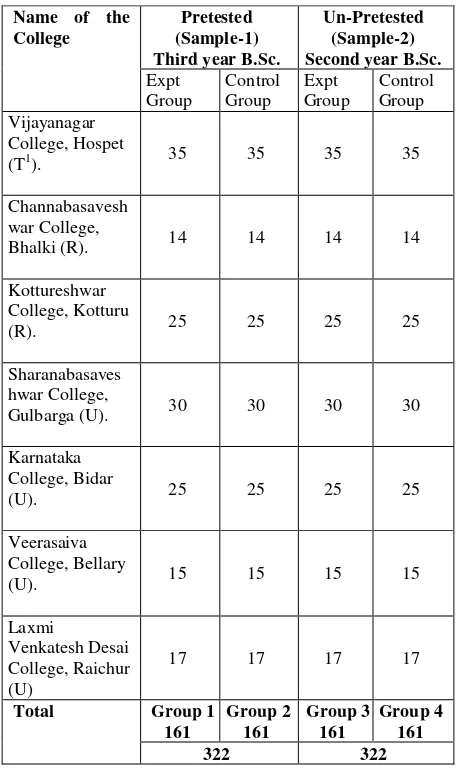
Each semester consists of a minimum of 24 hours of laboratory work. The innovative experiments were conducted on the students of 7 colleges across the geographical jurisdiction of Gulbarga University, Gulbarga (Table I). The sample-1 was the subset of the sample used in the survey during the first phase of the study and the students had completed four semester laboratory course of B.Sc. physics. Students of sample-2 did not participate in the pretest (As they were newly admitted to the course and
hence were excluded) and had completed only two semester laboratory course of B.Sc. physics. The innovative experiments developed by the researchers were conducted on the students during August-September 2010. In order to facilitate analysis, four groups with equal strength were made.
TABLE I. Sample used for conducting experiments.
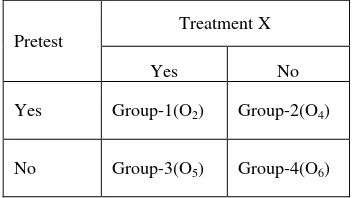
Name of the single treatment experimental method of research. It shows Solomon four group design used by us as well as the pre- and post-test control group design and the post-test only control group design.
Each of these designs is adequate to assess the effect of the treatment and is immune from most threats to internal
Teaching-learning through innovative experiments: An investigation of students’ responses
Lat. Am. J. Phys. Educ. Vol. 6,No. 3, Sept. 2012 349 http://www.lajpe.org
sensitization. Pretest sensitization means that "exposure to the pretest increases or decreases the Samples'Sensitivity to the experimental treatment, thus questioning the validity of generalization of results from the pretested sample to an un-Pretested population" [12]. Thus, the Solomon four-group design adds a higher degree of external validity in addition to its internal validity, and hence, according to Helmstadter, it is "the most desirable of all the basic experimental
designs” [13].
TABLE II. Three One-Treatment Condition Experimental Designs.
Design Group Pre-test Treatment Post-test
Solomon
In the initial phase of the analysis, we determined whether or not the evidence of pretest sensitization existed. That is,
whether X affects O only when a pretest measure is
administered. If this were the case O2should be higher than
04 (otherwise it would mean that the treatment and pretest
are working incoherently), but O5 should not be higher than
O6. (O5 higher than O6 would suggest a negative impact of
pretest).
The test for this is a 2
2 between-groups analysis ofvariance (ANOVA) on the four posttest scores, as indicated in Table III.
TABLE III. 2X2 Analysis of posttest scores.
Pretest no). Evidence demonstrating pretest sensitization is
detected by the interaction effect. An interaction effect is said to exist when the effect of one independent variable on the dependent variable changes depending on the level of another independent variable. In addition, there should be a
significant main effect for treatment in the first row but not
in the second. A “main effect” is the effect of one of the
independent variables on the dependent variable, ignoring the effects of all other independent variables. If the preceding pattern is present, the analysis terminates with the conclusion that there is evidence of a treatment effect, but it occurs only for pretested groups; there is thus pretest sensitization (a result unlikely to be welcomed by the investigator). Huck and Sandler (1973) modified Campbell and Stanley's (1963) analysis by noting that if the main effect in the second row is also significant, there is evidence
that pretest sensitization is present but that merely enhances
the effect of the treatment, which is detectable as well even in an un-Pretested sample. If the interaction is not different to attribute to sampling error. It would be possible
to use a number of t tests to determine the significance of
the difference between the means, two at a time, but it would involve a number of separate tests. ANOVA makes it possible to determine with a single test. Another advantage lies in the fact that computing a number of separate t tests will increase the overall Type I error rate for the experiment.
C. ANOVA
The analysis of variance consists of:
i. The variance of the scores for four groups is
combined into one composite group known as the
total group variance (Vt).
ii. The mean value of the variances of each of the four
groups, computed separately, is known as the
within-group variance (Vw).
Lat. Am. J. Phys. Educ. Vol. 6,No. 3, Sept. 2012 350 http://www.lajpe.org
variance, the researcher would conclude that the difference between the means is probably only a reflection of sampling error. If the F ratio were substantially greater than 1, it would seem that the ratio of the between-groups variance and the within-groups variance was probably too great to attribute to sampling error [16].
II.
DEVELOPMENT
OF
INNOVATIVE
EXPERIMENTS
B.Sc.course. To assess the effectiveness of the innovative experiments a posttest was designed. Posttest consisted of thirty one multiple choice questions based on the experiments. (Details of experiments and posttest can behad from the auther1). Pilot testing was done with a small
group of volunteers, who worked later as facilitators at
different colleges. The experiments were conducted on the students during August-September 2010. Innovative experiments were first conducted on the students of Vijayanagar College, Hospet (See Table I). Students representing sample-1 were studying in third year, they had participated in the survey when they were in second year of B.Sc. Out of a total of 71 students, 35 were selected randomly to represent experimental group and the experiments were conducted on them in two consecutive days. On the second day they were asked to complete the posttest. The remaining 36 students, who represented the control group, were asked to respond only to the posttest and let go. Students representing sample-2 were studying in B.Sc. second year. They had not participated in the survey, as they were not exposed to undergraduate laboratory course, when survey was conducted in (August-September) 2009. Out of 82 students who volunteered to partake in the exercise, 40 were put in the experimental group and 42 in the control group. Later for analysis purpose, to have equivalent groups, these numbers were readjusted.
III. ANALYSIS AND RESULTS
In Soloman four group design, treatment and pretest are the
two independent variables and the set of post test scores is
the dependent variable. Variable treatment has two levels:
experimental and control and the variable pretest has two levels: Pretested and un-Pretested.
A. Main effect
We have a total of two main effects in this study: one for
treatment and the other for pretest. The mean marks obtained in the posttest by the four groups for the four possible conditions of this study are given in Table IV.
TABLE IV. Mean test score by Pretest and Treatment.
Treatment Experimental
group Control group Average
Pretested Group-1
Students of experimental group have scored, on an average,
7.81(14.54−6.73) marks more than the students of control
group, which indicates that there is a main effect of
treatment. Similarly, un-Pretested students have scored
0.71(10.28−10.99) marks more than the pretested students.
To determine whether the main effect of pretest and treatment is significant, we need to test whether these differences are greater than that we expect by chance.
B. Interaction effect
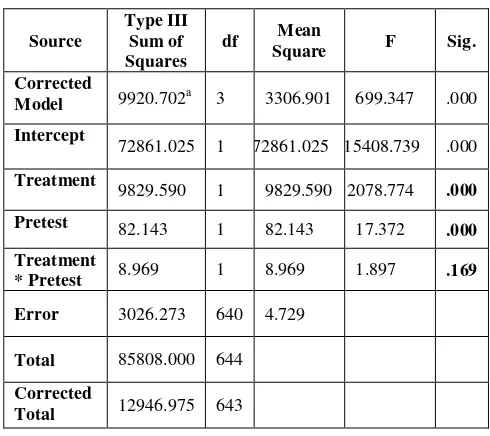
As mentioned earlier, an interaction effect exists when the effect of one independent variable on the dependent variable changes depending on the level of another independent variable (pretest). In the conducted exercise, we had pretest and treatment as two independent variables effect. Table V shows the summary of analysis of variance (ANOVA).
TABLE V. Tests of Between-Subjects Effects (ANOVA).
Source
Since the significance level (p-value) corresponding to
-Teaching-learning through innovative experiments: An investigation of students’ responses
Lat. Am. J. Phys. Educ. Vol. 6,No. 3, Sept. 2012 351 http://www.lajpe.org
level at 95%), there is no interaction effect. The p-values corresponding to the treatment and pretest are zero. There is main effect between control group and experimental group
and also between pretested and un-Pretested groups.
Prima-facie, there is a pretest sensitivity, but from the F-ratio it is
evident that between group variance is not substantially
greater than the within group variance. Hence it can be
concluded that the difference between the means is probably only a reflection of sampling error.
C. Levene’s test
We did Levene’s test to test if samples have equal variances. Equal variances across samples are called homogeneity of variance. While doing the ANOVA tests on the groups it is assumed that the variances are equal across
groups.
TABLE VI. Levene's Test of Equality of Error Variances.
F df1 df2 Sig.
36.121 3 640 0.000
From Table VI it is evident that critical value of F statistics
(36.121>0.000) is greater than the significant value at α
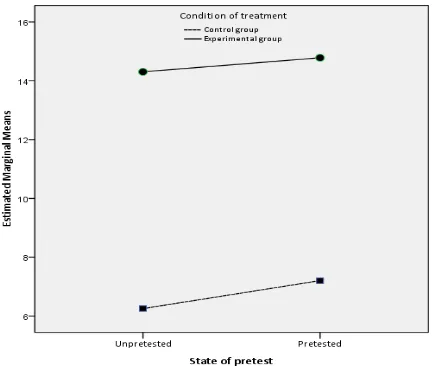
=95%, thus we accept the null hypothesis that variances are equal across the groups. Figs. 1 and 2 provide graphical representations of the mean scores of experimental and control group with and without pretest.
FIGURE 1. Estimated Marginal Means of Marks Scored.
FIGURE 2. Estimated Marginal Means of Marks Scored.
The parallel lines indicate that there is no interaction effect, In other words, the treatment or the posttest scores are unaffected by the pretest. Solid line is above the dotted line which shows that there is main effect of the treatment: the experimental group has performed significantly better than the control group.
IV. CONCLUSION
The strength of the relationship within related aspects of student performance increased from pretest to posttest, suggesting that instruction improved the connection between different measures of the same aspect of student
performance.From the analysis of the posttests we found a
strong evidence suggesting improvement in the conceptual understanding.
REFERENCES
[1] Khoon, K. A. and Othman, M., Some thoughts on the
introductory course in physics, College Student Journal 38, 503(2004).
[2] Boud, D. J., The laboratory aims questionnaire a new
method for course improvement?, Higher Education 2, 81– 94 (1973).
[3] Lazarowitz, R. and Tamir, P., Research on using
laboratory instruction in science, In D. L. Gabel (Ed.) Handbook of Research on Science Teaching and Learning, (Maxwell Macmillan International, New York, 1994).
[4] Millar, R. and Driver, R., Beyond processes, Studies in
Higher Education 14, 33–62 (1987).
[5] AAPT American Association of Physics Teachers, Goals of the introductory physics laboratory, The Physics
Teacher 35, 546–548 (1997).
[6] Reif, F. and St. John, M., Teaching physicists’ thinking
skills in the laboratories, American Journal of Physics 47,
Lat. Am. J. Phys. Educ. Vol. 6,No. 3, Sept. 2012 352 http://www.lajpe.org
[7] Agrest, M. M., Physics Labs withFlavor,The Physics
Teacher47, 297–301 (2009).
[8] Pattar, U., Raybaghkar, V. H. and Garg, S., Assessing
the Effectiveness of Learning-Teaching Physics Through Traditional Laboratory Experiments, Lat. Am. J. Phys. Educ. 5, 517-523 (2011).
[9] Best, J. W. and Kahn, J. V., Research in Education,
10th Ed. (Pearson Education, India, 2008), pp. 165-192.
[10] Kothari, C. R., Research Methodology Methods &
Techniques, 2nd Ed. (New Age International (P) Limited, 2006) 31-69.
[11] Clark, A. M., The qualitative-quantitative debate:
Moving from positivism and confrontation to post-positivism and reconciliation, Journal of Advanced Nursing 27, 1242–1249 (1998).
[12]Huck, S. & Sandler, H. M., A note on the Solomon
4-group design: Appropriate statistical analyses, Journal of
Experimental Education 42,54-55 (1973).
[13] Helmstadter, G. C., Research concepts in human
behavior: Education, psychology, sociology, (Appleton-Century-Crofts, New York, 1970), p. 110.
[14] Campbell, D., & Stanley, J. (1963). Experimental and
quasi-experimental designs for research. Chicago: Rand McNally.
[15] Braver, M. C. W. & Braver, S. L., Statistical treatment
of the Solomon Four-group design: A meta-analytic approach, Psychological Bulletin104, 150-154 (1988).
[16] Best, J. W. and Kahn, J. V., Research in Education,