Scopin g Ou t :
I n don e sia n Blu e Sw im m in g Cr a b Fish e r ie s
Su st a in a ble Fish e r ie s Pa r t n e r sh ip
N ove m be r 2 0 0 9
H igh ligh t s:
•
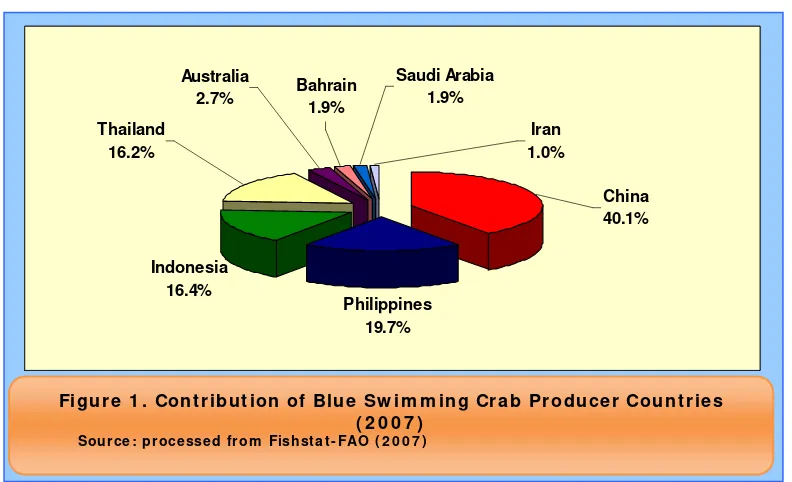
I n 2007, I ndonesia cont ribut ed t o 16.3% or 28 t housands t of t ot al global blue swim m ing crab landings, m aking it t he t hird biggest producer of blue swim m ing crab in t he world, following China ( 41% ) , and Philippines ( 20% ) . Thailand is following closely wit h t ot al 27.8 t housand t product ion ( FI SHSTAT- FAO) .1•
Nort h Java has been t he m aj or cat ching areas for blue swim m ing crab inI ndonesia, cont ribut ing t o about 28% of t ot al product ion in period 1990- 2006, followed by East Sum at ra ( 21% ) , Sout h Sulawesi ( 21% ) and Malacca St rait ( 14% ) [ MMAF- DG of Capt ure Fisheries, various years] .
•
The t rend in volum e landed by regions in I ndonesia show clearly t he upward t rend up t o t he m id 90s, and t hen fluct uat ed from t hat point . St art ing t he year 2000 t he fluct uat ion was m ore pronounced, and for som e regions t he t rend was clearly declining (e.g. Malacca St rait ) . The pat t erns of landings have shift ed over t he years. During t he early 1990s, landings from Nort h Java and Sout h Sulawesi dom inat ed, wit h also significant landings in t he Malacca St rait area. During t he m id 1990s up t o 2000, Malacca St rait and East Sum at ra landings gained in volum e, while Nort h Java landings were rem ain st able.•
Blue swim m ing crab ( or locally known as ‘raj ungan’) has been one of t he im port ant fishery export com m odit ies in I ndonesia, despit e no specificm anagem ent yet in place t o regulat e t his fishery. The export of blue swim m ing crab had j ust st art ed around 1994–1998 due t o increase dem and from overseas, especially from t he Unit ed St at es. Prior t o t his year, t his com m odit y was only consum ed locally and t he price was also very low.
•
I n t erm s of export value, crab cont ribut es t o about 8% of t ot al I ndonesian fishery product s export , valued at US$ 178 m illion in 2007, j um ped by 33% frompervious year.2 Crab product s have been t he t hird biggest fishery product t hat cont ribut ed t o t ot al I ndonesian export value, following shrim p ( 46% ) and t una ( 14% ) . Tot al crab export am ount ed t o 21,510 t onnes in 2007. This crab export consist s of non frozen crab ( 82% ) , canned crab ( 11% ) and frozen crab ( 7% ) [ MMAF and JI CA 2009] .
•
Unit ed St at es ( US) has been t he biggest m arket for I ndonesian crab export , cont ribut ing t o m ore t han 50% of t ot al crab export from I ndonesia, followed by Singapore ( 17% ) , Malaysia ( 10% ) , Taiwan ( 7% ) , European Union ( 6% ) , China ( 5% ) and Japan ( 2% ) [ MMAF 2005] .•
Dat a from Globefish ( 2007) shows t hat in 2004, global prepared and preserved crabs export was about 57 t housands t , valued at US$ 473 m illion. China has been t he biggest crab supplier for t his t ype of crab product , cont ribut ing about 37% of t ot al prepared and preserved crab export in t he world, followed by I ndonesia wit h 18% or closed t o 10 t housands t , valued at US$ 41.9 m illion.•
For 2008, t ot al US crab im port from I ndonesia was 9,372 t onnes, a decrease by15% from previous year, which was 11,403 t onnes. However, in t erm of value, US crab im port from I ndonesia increase by 6% from US$ 169 m illion in 2007 t o The biggest crab export ers from I ndonesia are Phillips Seafoods I ndonesia, Tonga Tiur Put ra, Windika Ut am a, Kelola Mina Laut , Mina Global Mandiri, Bum i Menara I nt ernusa, Toba Surim i, Nuansa Cit pt a Magello, Dahlia Mit ra Global and Rex Canning. All t oget her cont ribut e t o m ore t han 80% of t ot al crab export from I ndonesia t o US. I n general, t he export ers are also playing roles as processors. I n 2007, an associat ion of I ndonesian Blue Swim m ing Crab ( BSC) Processors ( APRI ) was form ed, wit h t he goal of sust ainable procurem ent from healt hy st ocks. The m em bers represent over 80% of all crab export ed from I ndonesia.
• Associat ion ( APRI ) has undert aken a Marine St ewardship Council ( MSC) pre-assessm ent using MRAG as t he assessor in April 2009. Based on t he pre-assessm ent , t he I ndonesia Blue Swim m ing Crab is not recom m ended t o m ove t o MSC Full Assessm ent by now due t o: insufficient inform at ion of st ock st at us, no sufficient inform at ion regard t o im pact s of t his fishery t o ot her species or ecosyst em and lack of m anagem ent .
•
A com prehensive populat ion st ock assessm ent is not available for Blue Swim m ing Crab ( BSC) at all geographic scale level ( nat ional or sub- nat ional level) . Most of biological research have focused on t he individual life- cycle of t he species, as well as aspect s of environm ent al condit ion and breeding, all geared t oward t heim proving t he pot ent ial for BSC cult ure.
per kg) are being caught and harvest ed. Anecdot al evidence indicat e t hat during t he lat e 1990s fisherm en in t he nort hern coast of West Java can capt ure 100- 200 kg each day, whereas in 2006 t hey obt ain m uch less, only 5 t o 10 crabs even t hough t hey have placed an equivalent of 5 km of net t ing ( Ant ara, 2006) . Sim ilar condit ion is faced by fisherm en in Takalar, Sout h Sulawesi. I n 2000 t hey were able t o obt ain larger sizes ( 4- 5 crabs per kg) , in 2004 t he com m on pract ice is 7-10 crabs per kg ( Kom pas, 7-10 May 2006) .
•
Declining com posit ion can also be seen at t he export er or wholesale buyer level. The special and, m ost not ably, lum p m eat s have increased in proport ion of t ot al m eat s being processed. This is a rough indicat ion t hat m eat s are com ing from sm aller sized crabs, which, in t urn, show t hat harvest s consist of roughly sm aller sized crabs t han in previous years.•
I n I ndonesia, t he crab is m ost ly caught by t he collapsible t raps and bot t om t herefore t hese species have relat ively high survival rat es. I n bot t om gillnet s, t he fishers discard t heir bycat ch on shore upon landing, at t his point , discards have a low chance of surviving.I n 2007, I ndonesia cont ribut ed t o 16.4% or 28 t housands t of t ot al global blue swim m ing crab ( BSC) landings, placed I ndonesia as t he t hird biggest BSC producing count ry, following China ( 40% ) and Philippines ( 20% ) based on official FAO dat a – Figure 1.
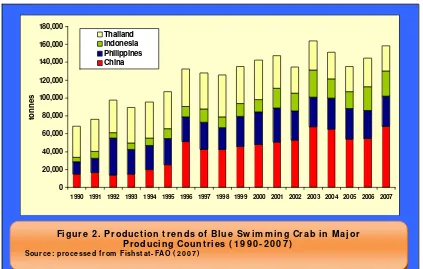
I n general, blue swim m ing crab product ion experienced upward t rend in period 1990 t o 2003. Tot al product ion of four m aj or producing count ries peaked t o 163,843 t in 2003. However, since 2004, t he global product ions t end t o decline, alt hough it st art ed t o rebound again in 2006 and t he product ion am ount ed t o j ust over 158,000 t in 2007.
H ist or y of Blu e Sw im m in g Cr a b Fish e r y in I n don e sia
There are t wo m ain crab species com m ercially capt ured in I ndonesia, nam ely blue swim m ing crab (Port unus pelagicus) and I ndo- pacific swam p crab or also known as m ud crab (Scylla serrat a) . I n 2007, t ot al crab product ion in I ndonesia reached 52,880 t onnes. Blue swim m ing crab cont ribut ed t he biggest port ion of t ot al crab harvest ed from I ndonesia wit h 53% where m ud crab cont ribut ed about 47% – Figure 3.
Blue swim m ing crab ( or locally known as ‘raj ungan’) has been one of t he im port ant export com m odit ies from fishery sect or in I ndonesia. The export of blue swim m ing crab has j ust st art ed in 1994- 1998 due t o increase dem and from overseas, especially from t he Unit ed St at es of Am erica. First export of blue swim m ing crab t o U.S.
m arket from I ndonesia st art ed in 1994 by PT. Phillips Seafood I ndonesia. Before t his year, t his com m odit y was only consum ed locally and t he price was also very low. I n I ndonesia, t he crab is m ost ly caught by t he collapsible t raps and gillnet s.
Figu r e 2 . Pr odu ct ion t r e n ds of Blu e Sw im m in g Cr a b in M a j or Pr odu cin g Cou n t r ie s ( 1 9 9 0 - 2 0 0 7 )
Sou r ce : pr oce sse d fr om Fishst a t - FAO ( 2 0 0 7 )
0 20,000 40,000 60,000 80,000 100,000 120,000 140,000 160,000 180,000
1990 1991 1992 1993 1994 1995 1996 1997 1998 1999 2000 2001 2002 2003 2004 2005 2006 2007
tonn
e
s
Con t r ibu t ion of Blu e Sw im m in g Cr a b in I n don e sia n Ex por t Va lu e
I n 2004, global prepared and preserved crabs export was about 57 t housands t , valued at US$ 473 m illion. China has been t he biggest crab export ing count ry, cont ribut ing about 37% of t ot al prepared and preserved crab export in t he world, followed by I ndonesia wit h 18% or t ot aled 9,800 t , valued at US$ 41.9 m illion. Thailand followed wit h 15% cont ribut ion. Meanwhile, Unit ed St at es and Canada cont ribut ed t o 6% and 5% of t ot al global prepared and preserved crab export
respect ively . All t oget her, t hey cont ribut ed m ore t han 80% of t ot al crab export in t he world – Figure 5.
I n don e sia n Blu e Sw im m in g Cr a b a t US M a r k e t
U.S. per capit a consum pt ion of fish and shellfish was 16.0 pounds ( edible m eat ) in 2008. This t ot al was 0.3 pounds less t han t he 16.3 pounds consum ed in 2007. Per capit a consum pt ion of fresh and frozen finfish account ed for 6.2 pounds while fresh and frozen shellfish consum pt ion was 5.6 pounds per capit a. U.S. im port s of edible fishery product s in 2008 were valued at $14.2 billion, $0.5 billion m ore t han in 2007. The quant it y of edible im port s was 2.37 m illion t onnes, a decrease of 54 t housand t onnes ( 0.4 percent ) from t he quant it y im port ed in 2007. Shellfish cont ribut ed t o over 50% of t ot al im port value, valued at US$ 7.3 billion. Crab was t he second biggest im port ed shellfish product , aft er shrim p, cont ribut ing t o 18% of t ot al shellfish im port volum e or 110.7 t housand t onnes in 2008, valued at US$ 1.36 billion.
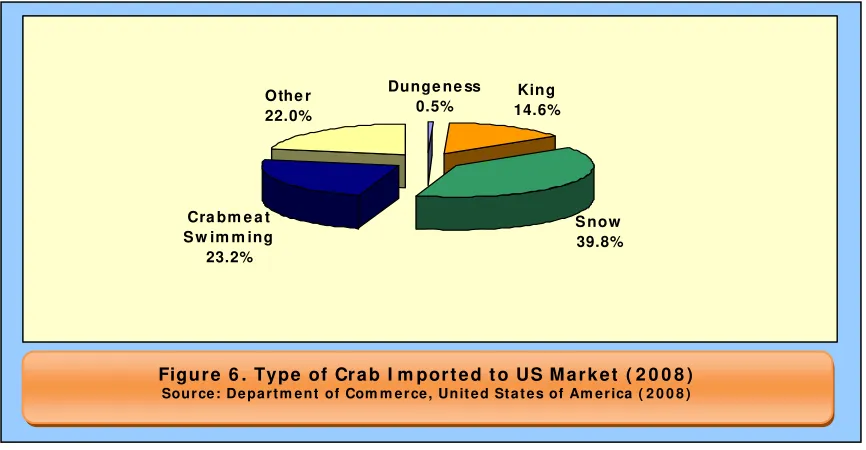
About 70% of crabs im port ed t o Unit ed St at es are in t he form of fresh and frozen, and canned crab cont ribut ed t o alm ost 30% . The favored species in t he U.S. m arket are t he red king crab (Paralit hodes cam t schat icus) , t he snow or queen crab
(Chionoecet es spp., in part icular: C. bairdi, C. opilio and C. t anneri) , t he blue swim m ing crab (Port unus pelagicus) , t he blue crab (Callinect es sapidus) and t he Dungeness crab (Cancer m agist er) [ Urner Barry Publicat ion 2008] .
Dunge ne ss 0.5%
King 14.6%
S now 39.8% Cra bm e a t
S w im m ing 23.2%
Othe r 22.0%
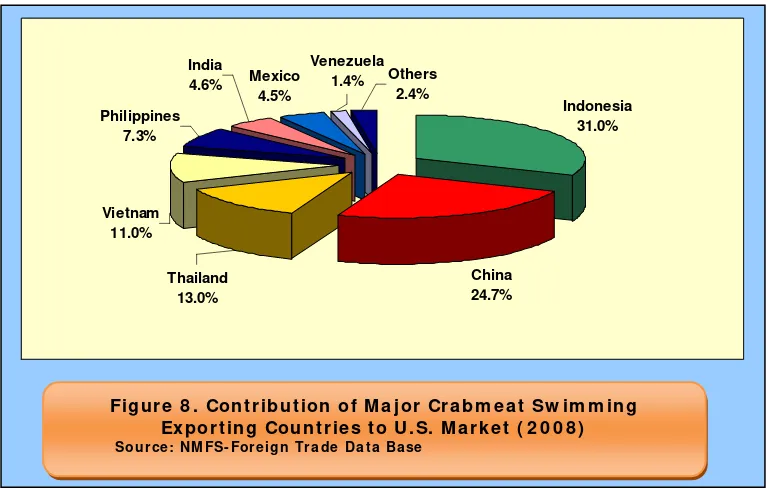
More t han 90% of crabm eat swim m ing export ed t o US from I ndonesia is in ATC ( Air Tight Cont ainer) . I ndonesia’s export of crabm eat swim m ing t o US m arket decreased by 10% from 8,896 t onnes in 2007 t o 7,950 t onnes in 2008. However, in t erm of value, I ndonesia’s crabm eat swim m ing export t o US m arket increased by 10% , from US$ 141 m illion in 2007 t o US$ 156,637 in 2008.
I n don e sia Blu e Sw im m in g Cr a b Su pply Ch a in
I n general, four com ponent s are involved in t he blue swim m ing crab fishery. These are: 1) fisherm en; 2) collect or (bakul) ; 3) m iniplant / peeler; 4) processor/ export er; 5) dist ribut or/ cent ral m arket ; 6) ret ail/ superm arket / seafood rest aurant – Figure 9.
Fisherm en sell t he crabs t o bakul, who plays t he role as t he collect or, which m ay or m ay not be lender or t engkulak t o t he fisherm en. Then bakul sells t he crabs t o m iniplant s. Bakul( s) usually t ake Rp 3- 4k m argin profit upon raw m at erial ( RM) ; Rp 5- 10k if already boiled (rebus) . From t he t im e t he crab is caught t o t he t im e it ent ers t he packer’s/ export er’s plant s should not ( and usually is not ) m ore t han 48 hours.
Indonesia 31.0%
China 24.7% Philippines
7.3%
Vietnam 11.0%
Thailand 13.0%
India
4.6% Mexico
4.5%
Venezuela
1.4% Others
2.4%
U.S. cust om report list ed 28 I ndonesian crab export ers t o U.S. m arket in 2008. The biggest crab export ers from I ndonesia are Phillips Seafoods I ndonesia, Tonga Tiur Put ra, Windika Ut am a, Kelola Mina Laut , Mina Global Mandiri, Bum i Menara
I nt ernusa, Toba Surim i, Nuansa Cit pt a Magello, Dahlia Mit ra Global and Rex Canning. All t oget her cont ribut e t o m ore t han 80% of t ot al crab export from I ndonesia t o US. I n general, t he export ers are also playing roles as processors. I n 2007, an
associat ion of I ndonesian Blue Swim m ing Crab ( BSC) Processors ( APRI ) was form ed, wit h t he goal of sust ainable procurem ent from healt hy st ocks. The m em bers
represent over 80% of all crab export ed from I ndonesia.
Dat a from t he sam e year not ed t hat at least t here are about 65 U.S. crab im port ers t hat im port crab from I ndonesia. Som e biggest US crab im port ers from I ndonesia are Phillips Foods, John Keeler & Co, Twin Tails Seafood, Lawrence St reet Seafood, Crab Associat ion, Triways Shiping Lines, Met om pkin Bay Oyst er, Quirch Foods, Tam co and Bost on Bay Brokers. All t oget her cont ribut ed t o alm ost 75% of crab im port from I ndonesia in 2008.
St ock Asse ssm e n t of I n don e sia n Blu e Sw im m in g Cr a b
A com prehensive populat ion st ock assessm ent is not available for Blue Swim m ing Crab ( BSC) at all geographic scale level ( nat ional or sub- nat ional level) . Most of biological research have focused on t he individual life- cycle of t he species, as well as
aspect s of environm ent al condit ion and breeding, all geared t oward t he im proving t he pot ent ial for BSC cult ure. A lim it ed num ber of st ock densit y est im at es have been conduct ed as t he base for evaluat ing t he ut ilizat ion/ harvest ing level of Blue
Swim m ing Crab. However, t here is a growing int erest from t he Associat ion ( APRI ) t o undert ake a Marine St ewardship Council ( MSC) pre- assessm ent for a pilot locat ion, and init ial effort s are being undert aken t o fill dat a gaps on populat ion st at us. The associat ion has recent ly support ed an init ial st udy focusing in Jakart a Bay t o define t he st ock st at us in t he area and develop a conservat ion st rat egy for t his st ock.
Cu r r e n t St a t u s a n d Tr e n ds
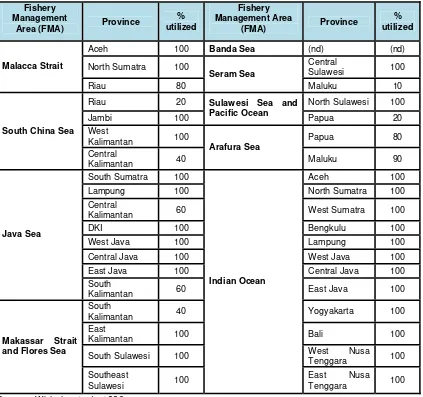
The current sit uat ion shows t hat as for m ost of I ndonesia, t he ut ilizat ion level of Blue Swim m ing Crab has m et t he Maxim um Sust ainable Yields ( MSYs) . However, given t he lack of biom ass and yield dat a at t he nat ional level it is unclear how t hese est im at es have been calculat ed.
Ta ble 1 . Blu e Sw im m in g Cr a b ut iliza t ion le ve l by Fish e r y M a na ge m e n t Ar e a
North Sumatra 100 Central Sulawesi 100
Malacca Strait
South Sulawesi 100 West Nusa
Tenggara 100
Makassar Strait and Flores Sea
The t rend in volum e landed by region (Figure 10) show clearly t he upward t rend up t o t he m id 90s, and fluct uat es from t he one. St art ing t he year 2000 t he fluct uat ion was m ore pronounced, and for t he regions t he t rend is clearly declining (e.g. Malacca St rait ) . The pat t erns of landings have shift ed over t he years. During t he early 1990s, landings from Nort h Java and Sout h Sulawesi dom inat e, wit h also significant landings in t he Malacca St rait area. During t he m id 1990s up t o 2000, Malacca St rait and East Sum at ra landings gained in volum e, while Nort h Java landings are rem ain st able. Since 2000, East Sum at ra cont ribut es t he largest volum e of landings, while Malacca St rait landings declined in relat ive proport ion. West Sum at ra, Maluku- Papua,
Sout h/ West and East Kalim ant an are st art ing t o cont ribut e larger proport ions. The Maluku and Papua region are part icularly rem ot e, t herefore any harvest ing and processing of BSC will be m ore cost ly and difficult com pared t o ot her part s of
I ndonesia. Expansion of harvest ing in t hat region, however, is expect ed in t he fut ure as BSC st ocks elsewhere in I ndonesia st art s t o decline.
I t is im possible t o indicat e t he size of t he fleet and t ot al effort being expended each year, however anecdot al observat ions indicat e t hat new fisherm en cont inue t o ent er t he Blue Swim m ing Crab fisheries, including in t he nort hern coast of Cirebon in West Java ( Ant ara, 2006) . The closest fishing ground for t hese fisherm en is Java Sea fishing ground off t he coast of West Java, current ly already fully ut ilized. I t is expect ed t hat at t he nat ional level t he num ber of households dependant on fishing will cont inue t o increase. Bet ween 2002 and 2004, t he num bers of such households have increased by 25% ( CBS, 2006) .
Declining size com posit ion can be observed in m any landing areas. Even sm all crabs ( 150 crabs per kg) are being caught and harvest ed. Anecdot al evidence indicat e t hat
-1990 1992 1994 1996 1998 2000 2002 2004 2006
during t he lat e 1990s fisherm en in t he nort hern coast of West Java can capt ure 100-200 kg each day, whereas in 100-2006 t hey obt ain m uch less, only 5 t o 10 crabs even t hough t hey have placed an equivalent of 5 km of net t ing ( Ant ara, 2006) . Sim ilar condit ion is faced by fisherm en in Takalar, Sout h Sulawesi. I n 2000 t hey were able t o obt ain larger sizes ( 4- 5 crabs per kg) , in 2004 t he com m on pract ice is 7- 10 crabs per kg ( Kom pas, 10 May 2006) .
Declining com posit ion can also be seen at t he export er or wholesale buyer level (Figure 11) . The special and, m ost not ably, lum p m eat s have increased in proport ion of t ot al m eat s being processed. This is a rough indicat ion t hat m eat s are com ing from sm aller sized crabs, which, in t urn, show t hat harvest s consist of roughly sm aller sized crabs t han in previous years.
I m pa ct s on En vir onm e n t a nd Biodive r sit y
There are som e differences in gear effect iveness in t he Blue Swim m ing Crab
Ot her fishes 4 56 3 45 species are caught , including Blue Swim m ing Crabs, ot her crust aceans ( shrim p and ot her crab) , coelent erat e, m ollusks, fishes, seaweed and echinoderm s ( Suadela, 2004) . I n t erm s of rat io t o t ot al, t he com posit ion is sim ilar bet ween using gillnet s or crab pot s/ basket s (Table 3) . There is a difference, however, in t he t reat m ent of by-cat ch, whereby gillnet fishers discard t heir byby-cat ch on shore upon landing. Crabs t hat are of lower qualit y are sold locally, and only about 5% of by- cat ch is ret ained. The
Alt hough President ial Decree No. 85 Year 1982 has banned t rawlers since 1983 in I ndonesia except east of longit ude 130° E ( essent ially east of Tanim bar I slands, and only for single vessel t rawls as pair t rawls are st ill banned) , draggers such as baby t rawlers or shallow bot t om t rawlers are st ill being used in t he Blue Swim m ing Crab fishery. Alt hough relat ively sm all in size, t his t ype of gear is m ore indiscrim inat e t han ot hers because t he net scoops up everyt hing in t he t rawl’s pat h. The m ain negat ive landings of blue swim m ing crab from m ain coast al area in I ndonesia reached 26,686 t . So t he discrepancy bet ween t ot al blue swim m ing crab landings and t ot al crabm eat swim m ing export t o U.S. m arket in 2006 was about 4,800 t . The discrepancy of dat a m ight be bigger since according t o dat a from I ndonesian Fishery Research New s suggest s t hat U.S.
REFEREN CE:
Agat ri, R.F. 2005. Analysis on Environm ent al Friendliness of Blue Sw im m ing Crab ( Raj ungan) Fishing Using Crab Pot ( Bubu Lipat ) in Gebang Mekar, Cirebon. Bogor Agricult ural Universit y. Facult y of Fisheries and Marine Science. Bogor.
Ant ara News Agency. 13 Sept em ber 2006. “ Raj ungan Cirebon Nyaris Punah Akibat Penggunaan Jaring Arad” ( Cirebon Blue Swim m ing Crabs in t he Brink of Ext inct ion due t o Shallow Bot t om Trawl Net ) .
Bisnis I ndonesia daily, 3 August 2004. Generat ing dollars from crabs.
CBS ( I ndonesia Cent ral Bureau of St at ist ics) . 2006. I ndonesia Yearly St at ist ics 2005/ 2006. Jakart a: CBS
FAO. 2007. FI SHSTAT. Global Crab Product ion 1950- 2007.
Foreign Trade I nform at ion (ht t p: / / www.st .nm fs.noaa.gov)
Globefish. 2007. Com m odit y Updat e – Crab. Ext ract from GLOBEFI SH Dat abank Prices - Export s - I m port s - Cat ches – Consum pt ion. February 2007.
Globefish. 2008. Crab Market Report - February 2008.
ht t p: / / www.globefish.org/ index.php?id= 4418
Globefish. 2005. Crab Market Report – Decem ber 2005.
ht t p: / / www.globefish.org/ index.php?id= 2638
Kom pas Daily Newspaper. 10 May 2006. Populasi Kepit ing Raj ungan Mulai Langka ( Swim m ing Crab Populat ion are I ncreasingly Scarce) . Online
ht t p: / / 64.203.71.11/ kom pas- cet ak/ 0605/ 10/ daerah/ 2644077.ht m
MMAF ( Direct orat e General of Marine and Fisheries Surveillance, Minist ry of Marine Affairs and Fisheries I ndonesia) . ( Undat ed) . PowerPoint Present at ion “Sist em dan Mekanism e Pengaw asan Sum berdaya I kan” ( Syst em and Mechanism for m onit oring fishery resources) , Jakart a
MMAF. 2005. St at ist ik Ekspor Hasil Perikanan 2005 ( Export St at ist ics of Fishery Product 2005) .
MMAF. 2007. Kondisi Wilayah Pengelolaan Perikanan I ndonesia ( St at us of t he I ndonesian Fisheries Managem ent Areas) . Unpublished report brief.
NMFS. Undat ed. Foreign Trade Dat a Base.
ht t p: / / www.st .nm fs.noaa.gov/ st 1/ t rade/ index.ht m l
Suadela, P. 2004. Analysis on Environm ent al Friendliness of Blue Sw im m ing Crab ( Raj ungan) Fishing Using Bot t om Gillnet ( Jaring) - A Case St udy in Bant en Bay. Bogor Agricult ural Universit y. Facult y of Fisheries and Marine Science. Bogor.
Urner Barry Publicat ions and U.S. Depart m ent of Com m erce and Census Bureau (ht t p: / / ft d.urnerbarry.com /)
Urner Barry Publicat ions. July 2008. “ Urner Barry’s Seafood Price- Current ” . 31 July 2008.
US I m port s and Export s of Fishery Product s Annual Sum m ary ( 2007)
ht t p: / / www.st .nm fs.gov/ st 1/ index.ht m l
Wart a Penelit ian Perikanan I ndonesia, Volum e 10 Nom or 1, 2004