Summary We compared vertical gradients in leaf gas ex-change, CO2 concentrations, and refixation of respired CO2 in stands of Populus tremuloides Michx., Pinus banksiana Lamb. and Picea mariana (Mill.) B.S.P. at the northern and southern boundaries of the central Canadian boreal forest. Midsummer gas exchange rates in Populus tremuloides were over twice those of the two conifer species, and Pinus banksiana rates were greater than Picea mariana rates. Gas exchange differ-ences among the species were attributed to variation in leaf nitrogen concentration. Despite these differences, ratios of intercellular CO2 to ambient CO2 (ci/ca) were similar among species, indicating a common balance between photosynthesis and stomatal conductance in boreal trees.
At night, CO2 concentrations were high and vertically strati-fied within the canopy, with maximum concentrations near the soil surface. Daytime CO2 gradients were reduced and concen-trations throughout the canopy were similar to the CO2 concen-tration in the well-mixed atmosphere above the canopy space. Photosynthesis had a diurnal pattern opposite to the CO2 pro-file, with the highest rates of photosynthesis occurring when CO2 concentrations and gradients were lowest. After account-ing for this diurnal interaction, we determined that photosyn-thesizing leaves in the understory experienced greater daily CO2 concentrations than leaves at the top of the canopy. These elevated CO2 concentrations were the result of plant and soil respiration. We estimated that understory leaves in the Picea mariana and Pinus banksiana stands gained approximately 5 to 6% of their carbon from respired CO2.
Keywords: boreal forest, BOREAS, carbon dioxide gradients, carbon isotope discrimination, carbon refixation, photosyn-thesis.
Introduction
Boreal forests are among the largest biomes on earth and are believed to exert a significant influence on global water and carbon fluxes. Tans et al. (1990) presented evidence that terres-trial ecosystems in the northern and temperate latitudes are large carbon sinks that influence atmospheric carbon
dynam-ics. The Boreal Ecosystem--Atmosphere Study (BOREAS) was established to investigate internal carbon and water dy-namics of the boreal forest biome and to provide information to estimate the boreal forests’ impact on global environmental change (Sellers et al. 1995).
Three main factors govern dynamics of CO2 within a forest canopy: turbulent mixing with the atmosphere above the can-opy, photosynthesis and respiration. Carbon dioxide released by respiration is either lost from the forest through turbulent mixing or refixed by photosynthesis within the canopy. Stern-berg (1989) defined CO2 recycling as the percentage of re-spired carbon refixed by the entire canopy. Past estimates for tropical rainforests have ranged between 3 and 26% (Sternberg 1989, Broadmeadow and Griffiths 1993, Buchmann et al. 1996). In this study, we determined the amount of carbon from respired sources that was refixed by foliage at different canopy levels. Calculating leaf CO2 refixation requires detailed infor-mation on the spatial and temporal patterns of the δ13C of leaves and source CO2 within the canopy, gas exchange and CO2 concentrations ([CO2]). Fluctuations in [CO2] will affect the δ13C of source CO
2 for the leaves because a relationship exists between δ13C and [CO
2] (Keeling 1961). As a result, the source CO2 for photosynthesis will change both diurnally and spatially within the canopy. How [CO2] patterns vary with forest species and canopy structure, and how they interact with the patterns of gas exchange, will determine the extent of CO2 refixation within forests.
The temporal and spatial dynamics of foliage gas exchange are influenced by environmental factors. Vertical gradients in photosynthesis (A) are driven by light availability (Schulze et al. 1977, Reich et al. 1990, Brooks et al. 1996). Patterns of variation in stomatal conductance (g) and transpiration (E) are complex because they change with light, boundary layer con-ductance, and the vapor pressure deficit of the air (Leverenz et al. 1982, Beadle et al. 1985, McNaughton and Jarvis 1991). The interplay of photosynthesis and stomatal conductance (A/g) can be inferred by ci/ca, which is defined as the ratio of intercellular [CO2] to ambient [CO2] (Farquhar et al. 1989). Gradients of ci/ca can be used to describe the balance between
Vertical gradients in photosynthetic gas exchange characteristics and
refixation of respired CO
2
within boreal forest canopies
J. RENÉE BROOKS,
1,2LAWRENCE B. FLANAGAN,
3GREGORY T. VARNEY
3and
JAMES R. EHLERINGER
11 Department of Biology, Stable Isotope Ratio Facility for Environmental Research, University of Utah, Salt Lake City, UT 84112, USA 2
Current address: Department of Biology, University of South Florida, Tampa, Fl 33620 , USA
3 Department of Biology, Carleton University, 1125 Colonel By Drive, Ottawa, Ontario K1S 5B6, Canada
Received December 13, 1995
carbon and water exchange within the canopy. In addition, ci/ca is the physiological parameter driving carbon isotope discrimi-nation (Farquhar et al. 1989). The patterns of gas exchange and [CO2] vary with the structure and species composition of the canopy. In central Canada, the boreal forest is largely com-posed of monodominant and mixed stands of Populus tremu-loides Michx., Pinus banksiana Lamb. and Picea mariana (Mill.) B.S.P. These species differ in canopy structure and productivity rate. The characteristics of these forests also change between the southern and northern boreal boundaries. Stands in the northern part of the range are generally less productive and smaller in stature than stands in the southern part of the range (Sellers et al. 1995). Our goal was to under-stand how forest structure and species composition affect gas exchange characteristics and CO2 dynamics within the canopy. We examined these processes in each of three forest ecosys-tems at their northern and southern boundaries. We also esti-mated the extent that leaves in the understory refix respired CO2 based on the δ13C of the foliage and the interplay of gas exchange and CO2 dynamics.
Materials and methods Site description
This study was conducted in association with the Boreal Eco-system--Atmosphere Study (BOREAS). Two study areas were located at the northern and southern limits of the boreal forest in central Canada. The Southern Study Area (SSA) was located 40 km north of Prince Albert, Saskatchewan and extended a further 90 km north and 130 km east--west. The Northern Study Area (NSA) was 100 km east--west and 80 km north--south and included the town of Thompson, Manitoba. In both the SSA and the NSA, we studied stands dominated by each of the target species: Picea mariana, Pinus banksiana, and Popu-lus tremuloides.
In the Southern Study Area, the Picea mariana site (BOREAS site: SSA-OBS, 53.985° N and 105.12° W) was located on poorly drained, sandy-clay soil. The stand was approximately 150 years old with 4300 stems per hectare. Tree heights ranged up to 12 m, with a leaf area index (LAI) of 2.3 (Rich et al. 1995, hemispherical photograph estimates) or 6.2 (S.T. Gower, unpublished allometry data). The large difference between LAI estimates resulted from the clustered nature of Picea mariana foliage. Ground cover was an almost continu-ous layer of Pleurozium schreberi (Willd. ex Brid) Mitt with patches of Sphagnum spp. The Pinus banksiana site (BOREAS site: SSA-OJP, 53.916° N and 104.69° W) was located in a well drained, sandy area. Stand age was 60--75 years and stand density was about 1300 trees per hectare. Tree heights ranged from 11 to 15 m, with a leaf area index of 1.4 (S.T. Gower, unpublished data) or 2.5 (Rich et al. 1995). Alnus crispa (Ait.) Pursh was the dominant shrub in the understory, and the ground cover was comprised predominantly of lichens, with patches of feather moss. The Populus tremuloides site (BOREAS site: SSA-OA, 53.629° N, and 106.20° S) was located on a well-drained clay-loam soil. Stand age was ap-proximately 60 years and stand density was about 900 trees per
hectare. Tree heights ranged from 12 to 20 m with a leaf area index of 3.0 (Rich et al. 1995, S.T. Gower, unpublished data). The understory was dominated by Corylus cornuta Marsh. and Rosa woodsii Lindl.
In the Northern Study Area, the Picea mariana site (BOREAS site: T6R5S, 55.908° N and 98.519° W) was lo-cated in an upland area with poorly drained clay soils. The stand was around 50 years old and was very dense (about 9300 trees ha−1), with an LAI of 8.4 (S.T. Gower, unpublished data). Tree heights ranged from 6 to 9 m. The ground was covered with a deep layer of feather moss. The Pinus banksiana site (BOREAS site: NSA-OJP, 55.928° N, 98.622° W) was similar to the southern pine site in that the soils were sandy and well drained with an understory of Alnus crispa and a lichen ground cover. The stand was 40--60 years old and had a density of 2000--3000 trees per hectare. Trees were shorter (8--11 m) than pines in the Southern Study Area but LAI was similar (1.6, Rich et al. 1995; 2.3, S.T. Gower, unpublished data). The Populus tremuloides site (BOREAS site: T2Q6A, 55.888° N, 98.676° W) was approximately 60 years of age and had a dense understory of Alnus crispa. Tree heights ranged from 7 to 18 m and stand density was about 2000 trees per hectare. Leaf area index estimates ranged from 2.3 (S.T. Gower, unpublished data) to 3.2 (Rich et al. 1995).
Field measurements
Field measurements were made in three intensive field cam-paigns (IFCs) during the 1994 growing season. The IFC-1 was from May 24 through June 12, at the time of bud break for both conifer species and early leaf expansion for Populus tremu-loides. The IFC-2 was at the peak of the growing season, between July 26 and August 8. The IFC-3 was at the onset of dormancy, from August 30 to September 15. During each IFC, we measured gas exchange of the dominant species, photosyn-thetic photon flux density (PPFD), air temperature, soil respi-ration, daily profiles of [CO2], and the δ13C of the foliage for the dominant species. During IFC-1, photosynthesis was measured only at the conifer sites. The most extensive data set was collected during IFC-2, when photosynthesis was meas-ured at all six sites. In September (IFC-3), photosynthesis was measured only in the southern conifer sites. All other parame-ters were measured at all six sites during each field campaign, except [CO2] profiles, which were not collected at the Populus tremuloides site in the SSA during IFC-1.
only upper canopy measurements were taken. For the conifer sites, gas exchange was measured on mature 1-year-old foliage. For the Populus tremuloides sites, gas exchange was measured on fully expanded leaves. Gas exchange measurements were taken two to six times for each sample during a day (between 0900 and 2000 h), covering a range of irradiances for each foliage sample. Values of Amax (photosynthesis at light satura-tion) and gmax (conductance at light saturation) were calculated by averaging photosynthesis measurements when PPFD was greater than 1000 µmol m−2 s−1. Air temperature and PPFD were measured at 9 and 0.5 m above ground and recorded by a data logger (CR-21X, Cambell Scientific, Logan, UT) at 30-min intervals. Photosynthetic photon flux density was measured with either a quantum sensor (LI-190, Li-Cor Inc., Lincoln, NE) or a photodiode (GaAsP 1118, Hamamatsu, Bridgewater, NJ) which was calibrated against a quantum sensor. Air temperature was measured with copper-constantan thermocouples shielded from direct beam radiation but open to air flow. Leaf area for conifers was measured by the volume displacement method. Gas exchange data are presented based on half the total leaf surface area (BOREAS Experimental Plan, J. Norman, personal communication). Projected leaf area was used for Populus tremuloides.
To examine directly the effects of light limitation in the lower canopy, an LED light source (QB6200, Quantum De-vices Inc., Barnsveld, WI) was used to provide supplemental light for a subset of gas exchange measurements taken at the conifer sites in the SSA. After measuring gas exchange under ambient conditions, the foliage was exposed to supplemental light (1200 mol m−2 s−1) and the chamber was flushed with ambient air. Once the [CO2] in the chamber returned to ambi-ent values, a measuremambi-ent of gas exchange in the supplemambi-ental light was made.
Soil respiration Soil respiration was measured with a port-able photosynthesis system (LI-6200) equipped with a soil respiration chamber (LI-6000-09S, Li-Cor Inc.). Twenty-four hours before measuring respiration, two PVC tubes (9.5 cm in diameter, 24 cm in length), which served as soil collars for the chamber, were inserted into the soil such that 5 cm of each collar remained above the soil surface. Two respiration meas-urements were made on each collar as described by Li-Cor (Publication No. 9311-69, 1993).
Carbon dioxide concentrations Canopy [CO2] was moni-tored continuously over a 2--5-day period at each site for each field campaign. Carbon dioxide concentrations were measured at six canopy heights: 9, 3, 1, 0.5, 0.25 and 0.05 m, and monitored every 10 min at the NSA and every 30 min at the SSA. Switching between canopy heights was controlled by a relay driver (A6Rec-12, Campbell Scientific) and a series of solenoid valves. Carbon dioxide was drawn from tubing at-tached to a rohn mast at the rate of 10 ml s−1 and pumped through an infrared gas analyzer (LI-6262, Li-Cor Inc.). The CO2 concentration was recorded by a data logger (CR-21X in the NSA, and CR-10 in the SSA, Campbell Scientific). Carbon isotope ratios Leaf carbon isotope ratios (δ13C) were measured on the foliage samples used for gas exchange
meas-urements. For the conifers, current-year foliage growing just beyond the photosynthesis sample was also measured in IFC-2 and IFC-3. Because these samples contained carbon fixed in 1994, they were used to calculate ci/ca. Leaf samples were dried at 70 °C for 24 h and ground to a fine powder with a mortar and pestle. Two-mg samples were combusted and the resulting CO2 was analyzed by isotope mass spectrometry (Delta S, Finnigan Mat, Bremen, Germany) for δ13C, as described by Boutton (1991).
Data Analysis
All statistical analysis was conducted with JMP 3.0.2 software (SAS Inc. Cary, NC). Analysis of variance was used to test the overall models, and if the ANOVA was significant, the Tukey-Kramer Honestly Significant Differences test was applied to test all combinations of means. To test for canopy gradients in continuous [CO2] data, we used a split-plot design with time as the main factor and tested for effects of height within time. The ratio of intercellular CO2 to ambient CO2 (ci/ca) was estimated both from direct gas exchange measurements and from carbon isotope data. We used δ13C of current-year (1994) leaves to calculate ci/ca based on the equations of Farquhar et al. (1989). The δ13C of the source CO
2 was calculated from the continuous [CO2] data (see below).
In addition to reporting actual [CO2], we weighted [CO2] by photosynthetic rates to calculate an average [CO2] for carbon assimilated by leaves at the four canopy levels where photo-synthesis was measured. Gas exchange data were used to develop a photosynthetic PPFD response curve for each spe-cies and canopy level. These curves were fitted with a logarith-mic equation, and the photosynthetic weights were calculated using the diurnal PPFD data. When photosynthetic rates were negative (nighttime respiration), the weight was set to zero so that [CO2] at night was not included in the weighted average. Each observation of [CO2] was multiplied by the photosyn-thetic weight, and daily weighted means were calculated.
We used two independent techniques to calculate the pro-portion of carbon in foliage that came from respired CO2. The final step for both techniques involved solving the following mass-balance equation for x, the percentage of respired CO2 in air surrounding the foliage: estimated by the two techniques outlined below. The δ13C
surface layer above the vegetation (≈ 350 ppm and −8, respec-tively). For all sites, δ13C
respired was approximately −26. Gas exchange method We used the gas exchange method to calculate δ13C
canopy based on leaf carbon isotope data (δ13Cleaf) and diurnal gas exchange data. From the diurnal gas exchange data, we calculated a daily weighted ci/ca value for each canopy level by weighting each ci/ca measurement with the corre-sponding photosynthesis measurement and averaging over the day. We used the equation of Farquhar et al. (1989) to calculate carbon isotope discrimination (∆) from the weighted ci/ca:
∆=a+(b−a)(ci/ca). (2)
We used the values of ∆ and δ13C
leaf to calculate δ13Ccanopy for each canopy level (Farquhar et al. 1989):
∆=(δ13C
canopy− δ13Cleaf)/(1 +δ13Cleaf). (3)
Carbon dioxide profile method The CO2 profile method used the daily mean [CO2] weighted by photosynthesis to calculate the average δ13C
canopy of CO2 fixed by leaves. There is a linear relationship between 1/[CO2 ] and δ13C (Keeling 1961), which we calculated for each site for each IFC. Based on these linear relationships, we determined the corresponding δ13C
canopy for a particular canopy level and used that value in Equation 1 to calculate leaf CO2 refixation. We also used this δ13C value to calculate ci/ca from the leaf carbon isotope data.
Results
Comparison between northern and southern limits of the boreal forest
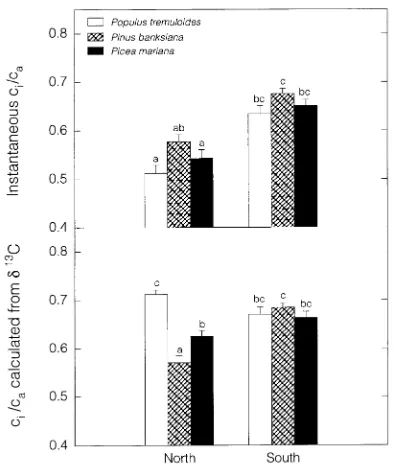
In the SSA, light-saturated photosynthesis (Amax) of foliage at the top of the canopy was approximately twice that measured in the NSA for the same species (Figure 1). These intraspecific differences were significant for Populus tremuloides and Pinus banksiana, but not for Picea mariana. Stomatal conductance at light saturation (gmax) followed a similar geographical trend, but the magnitude of the difference was greater than for Amax: conductances in the SSA were approximately three times higher than those in the NSA. This difference in magnitude between the fluxes also meant that ci/ca was lower in the NSA than in the SSA when foliage was light saturated (Figure 2).
Gas exchange also differed significantly among the three species (Figure 1). Stomatal conductance and photosynthetic rate at light saturation in Populus tremuloides had values twice those in Pinus banksiana, which had values twice those in Picea mariana for both northern and southern study sites. All three species had similar ci/ca values at light saturation (instan-taneous ci/ca, Figure 2). In the SSA, the mean ci/ca for all three species was 0.65 ± 0.04, compared with a mean of 0.55 ± 0.07 in the NSA. However, ci/ca values calculated from carbon isotope data differed from these results because carbon isotope ci/ca represents the average ci/ca for all carbon fixed by the leaf, not just light-saturated ci/ca as represented by the instantaneous data. In the SSA, carbon isotope ci/ca was similar for all species
Figure 1. Mean values of photosynthesis (Amax) and stomatal conduc-tance (gmax) at light saturation at the northern and southern sites. Measurements were taken from fully sunlit foliage (PPFD > 1000 µmol m−2 s−1) at the top of the canopy in July 1994. Error bars represent standard error of the means. Means marked by the same letter are not significantly different (α = 0.05, Tukey-Kramer Honestly Significant Difference test comparing all means).
and the average value (0.68 ± 0.03) was comparable to the instantaneous ci/ca mean. In the NSA, carbon isotope ci/ca differed significantly among species. Populus tremuloides had the highest ci/ca value and Pinus banksiana had the lowest. For Populus tremuloides and Picea mariana, carbon isotope ci/ca values were significantly higher than instantaneous ci/ca values (0.71 versus 0.51, P < 0.001, and 0.63 versus 0.54, P < 0.01, respectively for species, t-test).
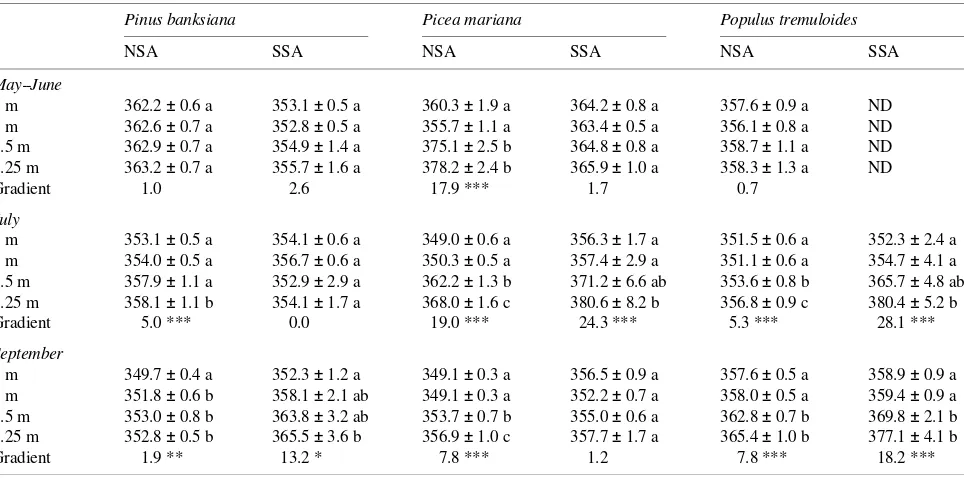
The δ13C of foliage at the top of the canopy showed some seasonal variation among species and location, but leaf δ13C was more constant than expected (Table 1). In the early season (May--June), δ13C values were similar among species in both the NSA and the SSA (overall May--June mean: −27.2 ± 0.8). Because we measured 1-year-old foliage for conifers and newly flushed leaves for Populus tremuloides, which are usu-ally formed from carbohydrates stored from the previous year, the early season values represented δ13C of carbon fixed in 1993. As the season progressed, δ13C in the SSA remained stable for all species, with a mean of −26.9 ± 0.5, whereas δ13C values in the NSA were more variable. During midsummer, new foliage of Pinus banksiana in the NSA had significantly less negative δ13C values than those of the other species, but by September these differences were less apparent. Throughout the season, for both the NSA and SSA, δ13C in Populus tremu-loides (−27.7 ± 0.8) was significantly more negative than δ13C for the conifers (Tukey-Kramer HSD, P < 0.05, Pinus bank-siana −26.3 ± 1.1, Picea mariana −26.6 ± 0.8), and this difference was most evident in September.
Gas exchange gradients within NSA forest canopies
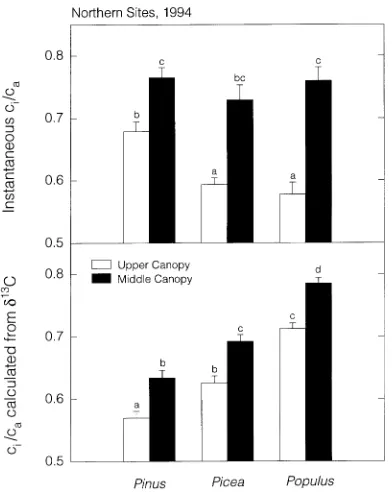
Rates of photosynthesis decreased as light was attenuated, but the magnitude of the reduction varied among species (Fig-ure 3). Photosynthetic rates in the middle canopy (lower part of the main canopy) of Populus tremuloides were approxi-mately 25% of the rates measured at the top of the canopy. Neither of the coniferous species showed such a large reduc-tion, and in Picea mariana, in which rates were low at the top of the canopy, there was no significant difference between the top and middle canopy. Differences in photosynthetic rates
among species were related to the degree of light attenuation in the canopies. Light attenuation was greatest in Populus tremuloides and Picea mariana canopies (about 80%) and least in the Pinus banksiana canopy (about 55%). Stomatal conductance was similar in the upper and middle canopies of the conifers, but conductance values were decreased by half in the middle canopy of Populus tremuloides compared to the upper canopy. The lack of stomatal response to light in conifers was also indicated by photosynthetic measurements made in the presence of supplemental light in the lower canopy
(Ta-Table 1. Mean δ13C ± SE of (n) measurements at the top of the canopy for foliage of the three dominant species at the NSA and the SSA through the 1994 growing season. May--June values for the conifers were for foliage formed in 1993, because 1994 foliage had not emerged. Means within an IFC followed by the same letter are not significantly different (α = 0.05, Tukey Kramer Honestly Significant Difference test of all combinations within an IFC).
Pinus banksiana Picea mariana Populus tremuloides
May--June
NSA −27.0 ± 0.29 a (6) −26.4 ± 0.17 a (6) −27.7 ± 0.47 a (5) SSA −27.0 ± 0.11 a (5) −27.6 ± 0.22 a (5) −27.6 ± 0.48 a (2) July
NSA −24.7 ± 0.30 a (6) −25.9 ± 0.24 b (6) −27.7 ± 0.20 d (9) SSA −27.1 ± 0.22 cd (5) −26.7 ± 0.28 bc (5) −26.2 ± 0.32 bcd (4)
September
NSA −25.6 ± 0.22 a (5) −26.6 ± 0.32 ab (5) −28.4 ± 0.43 c (5) SSA −26.6 ± 0.20 ab (5) −26.5 ± 0.30 ab (5) −27.8 ± 0.21 bc (4)
ble 2). Increasing light availability for understory foliage in-creased photosynthesis but did not significantly affect stomatal conductance.
Because photosynthesis decreased more than stomatal con-ductance from the top to the bottom of the canopy, ci/ca in-creased from the upper to middle canopy. In the middle canopy, all three species had similar values of instantaneous ci/ca (0.75 ± 0.13). In the upper canopy, ci/ca values were similar between Populus tremuloides and Picea mariana, but significantly higher for Pinus banksiana. Estimates of long-term integrated ci/ca based on carbon isotopes revealed species differences as well as canopy gradients in ci/ca (Figure 4).
Estimates of ci/ca at both canopy levels were lowest in Pinus banksiana, followed by Picea mariana, and then P. tremu-loides. Carbon isotope estimated ci/ca values increased consis-tently from the upper to middle canopy and this increase was of the same magnitude (mean ci/ca difference of 0.07 between upper and middle canopy) for all three species.
CO2 Profiles within forest canopies
Daily variation in [CO2] within the canopy was similar for the three ecosystems in both the NSA and the SSA (Figure 5). At night, [CO2] reached a daily maximum and was stratified within the canopy. From 0300 to 0600 h, [CO2] was highest at the soil surface, sometimes exceeding 1000 ppm, although average values were closer to 550 ppm. At 9 m above the soil surface, nighttime [CO2] was only slightly greater than [CO2] in the well-mixed surface layer. Between 0600 and 0900 h, [CO2] rapidly decreased in the lower canopy, thereby reducing the magnitude of the canopy gradient. This reduction occurred earliest in the Pinus banksiana canopies and latest in the Picea mariana canopies. Between 0900 and 1800 h, [CO2] through-out the canopy remained stable. In both the Picea mariana and Populus tremuloides stands, the CO2 concentration at the top of the canopy was less than the concentration in the well-mixed layer above the canopy. Between 1800 and 2100 h, canopy CO2 gradients began to build again. Even though daytime concentrations were considerably lower than those at night, significant CO2 gradients existed during daylight hours when plants were actively photosynthesizing (Figures 6 and 7). In the Populus tremuloides canopies, the greatest differences oc-curred between 0.05 and 0.5 m above ground in both the SSA and NSA, and in the SSA, soil surface [CO2] always remained above 400 ppm. Pinus banksiana stands maintained only a small CO2 concentration gradient during the day; concentra-tions near the soil surface were only a few ppm higher than at the top of the canopy. Picea mariana canopies maintained a larger gradient within the canopy during the day, when the CO2 concentration close to the soil surface was near 370 ppm in both the NSA and SSA sites, approximately 10 ppm higher than CO2 concentration at the top of the canopy.
To determine the average daytime [CO2] for photosynthesis at different heights in the canopy, we weighted the observed Table 2. Changes in gas exchange parameters of lower canopy foliage in response to supplemental light. Initial measurements were made under ambient conditions, and then measurements were repeated using supplemental light. Data were collected in July 1994 at the SSA. Asterisks indicate significant differences between ambient and supplemental light values using a paired t-test (* P > 0.05, ** P > 0.01, and *** P > 0.001, SAS).
Pinus banksiana Picea mariana
Ambient light Supplemental light Ambient light Supplemental light
PPFD (µmol m−2 s−1) 40 ± 15 1200 420 ± 540 1200
Temperature (°C) 19.3 ± 2.7 18.5 ± 0.7 27.2 ± 1.2 27.5 ± 1.3 **
A (µmol m−2 s−1) 0.51 ± 0.27 3.74 ± 0.69 ** 1.7 ± 1.0 2.7 ± 1.0 ***
g (mol m−2 s−1) 0.07 ± 0.01 0.08 ± 0.01 0.03 ± 0.01 0.03 ± 0.01
ci/ca 0.95 ± 0.03 0.77 ± 0.03 ** 0.67 ± 0.17 0.54 ± 0.11 ***
diurnal changes in [CO2] by observed changes in photosyn-thetic rates for each canopy height (Table 3). Early in the growing season (May--June), CO2 gradients within the cano-pies were small and not statistically significant,with the excep-tion of the Picea mariana canopy in the NSA, where under-story foliage was exposed to a [CO2] 18 ppm higher than foliage at the top of the canopy. In the middle of the growing season (July), almost all of the stands had significantly higher understory [CO2] compared to the top of the canopy. In Sep-tember, the gradients were generally smaller, although still significant for most sites. Throughout the growing season, gradients were smaller in Pinus banksiana stands than in Picea mariana stands. The Populus tremuloides stand in the SSA and the Picea mariana stand in the NSA had consistently larger gradients than the other stands; the [CO2] in the understory of
these two stands was 10--30 ppm greater than the concentra-tion in the upper canopy. At the other sites, the canopy gradient rarely exceeded 10 ppm. Throughout the season, changes in [CO2] at the top of the canopy reflected the annual cycle of [CO2] in the well-mixed surface layer (surface layer concentra-tions: 363 ppm May--June, 354 ppm July, 349 ppm September, for Mould Bay, Canada, provided by T. Conway NOAA/CMDL).
Soil surface concentrations of CO2 were always higher than CO2 concentrations at any other canopy level (Figure 5). Soil respiration in the three forest ecosystems had distinct tempera-ture response curves (Figure 8), and soil temperatempera-tures were also variable among sites. In July, mean soil temperatures at a depth of 10 cm in the NSA and SSA, respectively, were 6.7 and 9.9 °C for Picea mariana stands, 12.1 and 13.2 °C for Populus Figure 5. Daily patterns of [CO2] at six heights in the canopy for all stands in the NSA and SSA. Means of values over 2--5 days ± SE are presented. The dashed line represents tropospheric CO2 concentration in Mould Bay, Canada (354 ppm, July 1994, provided by T. Conway, NOAA/CMDL). Split-plot ANOVAs were calculated for each stand with time as the main factor and height within time as the split-plot factor. For
Populus, the r2 of the ANOVA model was 0.80 (F = 243, P < 0.0001) in the NSA and 0.72 (F = 31, P < 0.0001) in the SSA. For Pinus, r2 = 0.50 (F = 55,
P < 0.0001) in the NSA and 0.76 (F = 33, P < 0.0001) in the SSA. For
Picea, r2 = 0.71 (F = 140, P < 0.0001) in the NSA and 0.59 (F = 16.5,
tremuloides stands, and 13.2 and 15.6 °C for Pinus banksiana stands. As a result, soil respiration rates only varied by 4 to 6
µmol m−2 s−1 among sites.
Refixation of respired CO2
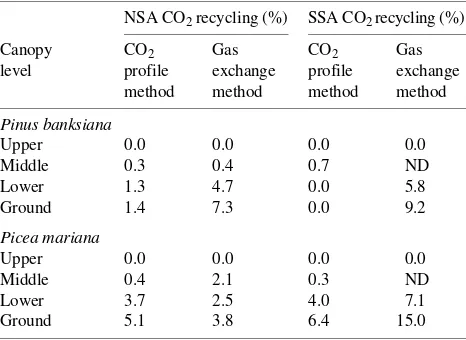
We used two methods to estimate the amount of CO2 refixed within the canopy (Table 4). We excluded Populus tremuloides stands from these estimates because our sampling masts were below the top of the canopy in these stands and because P. tremuloides was not present in the understory. Refixation at the top of the canopy was assumed to be zero. Refixation of respired CO2 increased in lower canopy positions (Table 4). Leaves in the middle canopy generally fixed less than 1% of the carbon from respired sources. The highest rates of refixa-tion were found in seedlings 0.10--0.25 m above the forest floor. Estimated rates ranged from 0 to 15% refixation, with an average of 6% at 0.25 m. Estimates varied as much between methods as between forest ecosystems and locations. In gen-eral, the CO2 profile method predicted lower rates of refixation than the gas exchange method. Within a method, Picea
mari-ana stands had higher refixation rates (7.5% average) than Pinus banksiana stands (4.5% average), with no apparent difference between northern and southern sites.
Discussion
The gas exchange rates reported here for boreal tree species are similar to previously published values (Lawrence and Oechel 1983, Ceulemans et al. 1987 for Populus; Stewart and Hoddi-nott 1993 for Pinus banksiana; Hom and Oechel 1983 for Picea mariana). Although differences in Amax existed among species, these were largely explained by variation in leaf nitro-gen concentrations. Foliage nitronitro-gen concentrations (per dry weight) in the NSA were 2.0 ± 0.03% in Populus tremuloides, 1.1 ± 0.1% in Pinus banksiana, and 0.7 ± 0.09% in Picea mariana (H. Margolis and Q. Dang, unpublished data). For Pinus banksiana and Picea mariana, values of Amax were lower in the NSA than in the SSA, but nitrogen differences between locations did not sufficiently explain this photosynthetic dif-ference (M. Ryan and M. Lavigne, unpublished data). Lower Figure 6. Daytime canopy profiles of [CO2] for sites in the NSA. Data
are a subset of the data presented in Figure 5.
gas exchange rates in the NSA may have been the result of differences in precipitation as well as differences in nitrogen content. In 1994, the northern sites were drier than the average summer (200 mm in 1994 versus 270 mm mean precipitation from May through August for Thompson, Manitoba, Atmos-pheric Environment Service, Canada), whereas the southern sites were wetter than average (255 mm for 1994 versus 220 mm mean precipitation for Prince Albert, Saskatchewan, Atmospheric Environment Service, Canada). Consistent with
water availability differences, stomatal conductances were sig-nificantly lower in the NSA. Intraspecific differences in sto-matal conductance between the NSA and the SSA were greater than Amax differences, supporting the idea that water was lim-iting in the NSA.
Instantaneous measures of ci/ca, which are related to intrinsic water-use efficiency, also support the idea that photosynthesis in the NSA was limited by water stress during midsummer (Figure 2). However, long-term integrated measures of ci/ca indicated that water availability was low for a sufficient period of time to influence leaf δ13C values only in midsummer in the NSA Pinus banksiana canopy. This finding is consistent with the observation that Pinus banksiana grows on sandy sites with limited capacity to retain water (Stangel et al. 1995).
We found minimal differences in sunlit foliage δ13C values among the dominant boreal tree species; in contrast, previous studies from other ecosystems at lower latitudes have demon-strated large variation among dominant species (Farquhar et al. 1989, Ehleringer et al. 1992). In May--June, all three species had similar δ13C, but in September, Populus tremuloides had more negative δ13C values than the conifers. Because the δ13C of foliage can be related to the internal balance of water and carbon fluxes or intrinsic water-use efficiency (WUE) (Far-quhar et al. 1989), we speculate that Populus tremuloides had lower WUE compared to the conifers. Similar differences in WUE between deciduous and coniferous trees have been re-ported by others (Garten and Taylor 1992, Valentini et al. 1992, Marshall and Zhang 1994). Bonan (1993) noted that differ-ences between evergreen and deciduous trees were more im-portant than species differences in regulating carbon balances Table 3. Concentration of CO2 weighted by photosynthesis to represent the average [CO2] for photosynthesizing leaves at different canopy levels. Each mean (± SE) represents the weighted average of two to five CO2 diurnals. Weighted averages within each gradient followed by the same letter are not significantly different (α = 0.05, Tukey-Kramer Honestly Significant Differences Test). Asterisks denote significantly different canopy [CO2] gradients (* P > 0.05, ** P > 0.01, and *** P > 0.001); ND indicates no data available.
Pinus banksiana Picea mariana Populus tremuloides
NSA SSA NSA SSA NSA SSA
May--June
9 m 362.2 ± 0.6 a 353.1 ± 0.5 a 360.3 ± 1.9 a 364.2 ± 0.8 a 357.6 ± 0.9 a ND 3 m 362.6 ± 0.7 a 352.8 ± 0.5 a 355.7 ± 1.1 a 363.4 ± 0.5 a 356.1 ± 0.8 a ND 0.5 m 362.9 ± 0.7 a 354.9 ± 1.4 a 375.1 ± 2.5 b 364.8 ± 0.8 a 358.7 ± 1.1 a ND 0.25 m 363.2 ± 0.7 a 355.7 ± 1.6 a 378.2 ± 2.4 b 365.9 ± 1.0 a 358.3 ± 1.3 a ND
Gradient 1.0 2.6 17.9 *** 1.7 0.7
July
9 m 353.1 ± 0.5 a 354.1 ± 0.6 a 349.0 ± 0.6 a 356.3 ± 1.7 a 351.5 ± 0.6 a 352.3 ± 2.4 a 3 m 354.0 ± 0.5 a 356.7 ± 0.6 a 350.3 ± 0.5 a 357.4 ± 2.9 a 351.1 ± 0.6 a 354.7 ± 4.1 a 0.5 m 357.9 ± 1.1 a 352.9 ± 2.9 a 362.2 ± 1.3 b 371.2 ± 6.6 ab 353.6 ± 0.8 b 365.7 ± 4.8 ab 0.25 m 358.1 ± 1.1 b 354.1 ± 1.7 a 368.0 ± 1.6 c 380.6 ± 8.2 b 356.8 ± 0.9 c 380.4 ± 5.2 b
Gradient 5.0 *** 0.0 19.0 *** 24.3 *** 5.3 *** 28.1 ***
September
9 m 349.7 ± 0.4 a 352.3 ± 1.2 a 349.1 ± 0.3 a 356.5 ± 0.9 a 357.6 ± 0.5 a 358.9 ± 0.9 a 3 m 351.8 ± 0.6 b 358.1 ± 2.1 ab 349.1 ± 0.3 a 352.2 ± 0.7 a 358.0 ± 0.5 a 359.4 ± 0.9 a 0.5 m 353.0 ± 0.8 b 363.8 ± 3.2 ab 353.7 ± 0.7 b 355.0 ± 0.6 a 362.8 ± 0.7 b 369.8 ± 2.1 b 0.25 m 352.8 ± 0.5 b 365.5 ± 3.6 b 356.9 ± 1.0 c 357.7 ± 1.7 a 365.4 ± 1.0 b 377.1 ± 4.1 b
Gradient 1.9 ** 13.2 * 7.8 *** 1.2 7.8 *** 18.2 ***
in boreal forest ecosystems. The coniferous species had similar
δ13C and WUE values, despite differences in habitat. Picea mariana inhabits the very wet nutrient-poor sites, whereas Pinus banksiana occupies the dry sandy sites. Marshall and Zhang (1994) also noted minimal differences between Pinus and Picea species growing over a range of environments. The similarity in δ13C among species across a wide geographical area implies that these boreal trees balance water and carbon fluxes in a similar manner throughout their range.
The decline in photosynthesis from the top to the bottom of the canopy was related to light attenuation within the canopy. In Populus tremuloides, photosynthesis decreased by 75% within the canopy and light was attenuated by 80%. Light attenuation was similar in the Picea mariana stands, but be-cause photosynthetic rates were low at the top of the canopy, we did not find significant differences in photosynthesis within the canopy. In the Pinus banksiana canopy, 55% of the light was attenuated and photosynthesis declined by 35%. Despite differences in light and photosynthetic decline among the species, all three canopies showed a similar increase in ci/ca with lower canopy position (Figure 4). Because the canopies differed in light attenuation but not in the pattern of change in ci/ca, it appears that the integration of gas exchange activities within the canopy was not regulated solely by light attenu-ation. Light affected ci/ca (Table 2), but other factors also seemed to play a role in determining ci/ca gradients. Gutiérrez and Meinzer (1994) found a similar change in carbon isotope ci/ca within the canopy over a wide range of LAI in coffee hedgerow plants. Doley et al. (1988) noted a strong relation-ship between stomatal conductance and photosynthesis within a rainforest canopy, but this relationship was only weakly related to irradiance. Ehleringer et al. (1986) found that the change in carbon isotope discrimination from the top to the bottom of the canopy differed for different species in a mixed tropical forest, even though the light attenuation was the same. Discrimination changed the least in the dominant
shade-intol-erant trees (1--2‰), whereas the shade-tolshade-intol-erant species exist-ing lower in the canopy changed discrimination by more than 6‰. In addition to light attenuation, some intrinsic charac-teristic of the species, such as shade-tolerance, may influence ci/ca changes within the canopy.
Three factors cause canopy [CO2] profiles to be dynamic: turbulent mixing with air above the canopy, inputs from re-spired CO2 and uptake of CO2 by photosynthesis (Wofsy et al. 1988, Sternberg 1989, Fan et al. 1990). At night, soil CO2 effluxes resulted in a build-up of canopy CO2 to a maximum concentration (Figure 5). Nighttime CO2 concentrations were greater in the SSA than in the NSA, reflecting the higher soil temperatures in the southern ecosystems. In the morning, can-opy CO2 mixes with CO2 above the nocturnal boundary layer as canopy air heats up (Wofsy et al. 1988, Fan et al. 1990). During the day, turbulent mixing dominated the flux processes, but respiration and photosynthesis also influenced canopy [CO2]. In both the Populus tremuloides and Picea mariana stands, CO2 at the top of the canopy (346 ppm) was reduced to a concentration below that of the well-mixed layer above the canopy (354 ppm, July 1994 in Mould Bay Canada, provided by T. Conway, NOAA/CMDL; Figure 6). This was a direct result of photosynthesis, because the well-mixed surface layer CO2 concentrations for a location do not vary more than 1 to 2 ppm during a summer month (Conway et al. 1994). The boreal forests studied maintained a small [CO2] gradient during the day because soil respiration rates increased until mid to late afternoon as soil temperatures reached their maximum. These daytime gradients were largest in the densest stands, probably because of stand structure effects on turbulent mixing within the canopy. The open Pinus banksiana stands had CO2 concen-trations similar to the concentration of the well-mixed surface layer above the canopy and had relatively small daytime CO2 gradients. In the dense Picea mariana stands, CO2 concentra-tions were below surface layer values and had relatively large daytime gradients. Buchmann et al. (1996) also noted in-creased daytime canopy CO2 gradients with increased stand LAI.
Photosynthesizing foliage within the canopies experienced CO2 enrichment from respired CO2 (Table 3). This elevated [CO2] can influence understory growth; for example, Bazzaz and Miao (1993) found that shade-tolerant species were re-sponsive to elevated CO2 under low light conditions. This growth response could be the result of increased quantum yield (Ehleringer and Björkman 1977). The greatest understory CO2 enrichment occurred during midsummer when soil tempera-tures and respiration rates were high and when plant growth rates were high.
The elevated [CO2] within canopies was a direct result of respiration; thus, a certain amount of CO2 that was fixed by the canopy came from respired sources. We calculated that ap-proximately 6% of the carbon in understory foliage originated from respired CO2 (Table 4). Both Picea mariana and Pinus banksiana stands refixed respired CO2 to a similar extent, even though they differed in [CO2] gradients and gas exchange rates. This similarity occurred because refixation by a leaf is determined by both the photosynthetic rate and the daily pat-Table 4. Recycling in boreal coniferous forests at northern (NSA) and
southern boundaries (SSA) estimated by two independent methods. Recycling is definded as the amount of carbon in leaves that is derived from respired CO2. The data were collected in July 1994.
NSA CO2 recycling (%) SSA CO2 recycling (%)
Canopy CO2 Gas CO2 Gas
tern of [CO2] within the canopy. Although CO2 concentration gradients were greater in the Picea mariana stands, less light penetrated to the understory than in the Pinus banksiana stand, thus limiting photosynthesis and refixation. In the Pinus bank-siana stand, light penetrated into the canopy for longer periods during the day; therefore, despite lower daytime [CO2] gradi-ents, understory foliage was fixing carbon during the early morning draw-down and late afternoon build-up of CO2.
Sternberg et al. (1989) estimated that, in a tropical forest on Barro Colorado Island, Panama, leaves in the understory ob-tain between 13 and 18% of their carbon from respired sources. Vogel (1978) estimated a value of 15% for a mixed deciduous forest in Southern Germany, but did not account for ci/ca effects on δ13C in leaves, so this value should be lower. In our study, much of the vertical gradient in δ13C of leaves was a result of physiological differences (ci/ca,Figure 4), but a por-tion was a result of the δ13C of source air. For these boreal forests, the isotopic composition of source CO2 accounted for 20% of the gradient in leaf carbon isotope values. A small amount of respired CO2 can make a large difference in leaf isotopic values because above-canopy source CO2 and respired CO2 vary in δ13C by about 20 (respired CO2δ13C = −26 to
−27‰; well-mixed surface layer CO2δ13C = −7.5 to −8‰, M. Trolier, University of Colorado-INSTAAR). Sternberg et al. (1989) estimated that, for a tropical forest, source CO2 could account for roughly 30--70% of the difference in leaf carbon isotope values between the top and bottom of the canopy.
Sternberg (1989) estimated that between 7 and 8% of the respired carbon dioxide in the Barro Colorado Island stand was refixed by the canopy. Lloyd et al. (1996) modeled leaf refixa-tion for entire canopies in both tropical and boreal ecosystems. They estimated that the tropical canopy refixed twice as much CO2 (4% daily average) as the boreal canopy (2% daily aver-age), and related this difference to ecosystem respiration. Both leaf refixation and canopy recycling estimates indicate that most of the carbon fixed by the canopy came from the atmos-phere above the canopy, and most carbon respired from the ecosystem was lost to the atmosphere. Thus, the internal cy-cling of carbon within the stand is a relatively small component of the carbon cycle. Although these canopy-level recycling estimates were similar to the estimates of leaf refixation re-ported here, they represent different events. Our leaf refixation describes how much of the carbon fixed by a specific leaf came from respired sources, whereas Sternberg (1989) estimated the percentage of respired CO2 refixed by the entire canopy as opposed to being lost to the atmosphere through turbulent mixing.
Although the boreal forest is a diverse mosaic of different ecosystems, the six stands studied were comparable in carbon refixation and in the way they internally balanced water and carbon fluxes. This similarity allows the physiological control over carbon and water fluxes to be considered at the regional scale. For example, it has been found that boreal forests exert strong stomatal control over regional water vapor fluxes and that the boreal vapor fluxes (less than 2 mm day−1) are gener-ally lower than those in temperate regions (Sellers et al. 1995). Our results suggest that stomatal closure will also limit carbon
assimilation at these sites. Sellers et al. (1995) found that the photosynthetic capacity of boreal forests was much lower than that of temperate forests. This tight physiological control over water and carbon fluxes and the similarity among forest eco-systems across their range will facilitate linking models that predict net primary production (Melillo et al. 1993) and atmos-pheric processes on a global scale.
Acknowledgments
We thank S. Berry, N. Buchmann, D. Kubien, K. Rapp, L. Sperry, and S. Veltman for help with data collection. Special thanks to N. Buch-mann for stimulating discussions and comments on early versions of this manuscript. Thanks to D. Maguire for statistical advice. Isotope analysis was conducted at the Stable Isotope Ratio Facility for Envi-ronmental Research (SIRFER) with help from C. Cook and C. F. Kitty. This research was supported by a grant from NASA BOREAS to JRE, and by grants from the Natural Sciences and Engineering Research Council of Canada to LBF.
References
Bazzaz, F.A. and S.L. Miao. 1993. Successional status, seed size, and responses of tree seedlings to CO2, light and nutrients. Ecology 74:104--112.
Beadle, C.L., R.E. Neilson, H. Talbot and P.G. Jarvis. 1985. Stomatal conductance and photosynthesis in a mature Scots pine forest. I. Diurnal, seasonal and spatial variation in shoots. J. Appl. Ecol. 22:557--571.
Bonan, G.B. 1993. Physiological controls of the carbon balance of boreal forest ecosystems. Can. J. For. Res. 23:1453--1471. Boutton, T. W. 1991. Stable carbon isotope ratios of natural materials:
1. Sample preparation and mass spectrometric analysis. In Carbon Isotope Techniques. Eds. D.C. Coleman, and B. Fry. Academic Press, New York, pp 155--171.
Broadmeadow, M.S.J. and H. Griffiths. 1993. Carbon isotope dis-crimination and the coupling of CO2 fluxes within forest canopies.
In Stable Isotopes and Plant Carbon--Water Relations. Eds. J.R. Ehleringer, A.E. Hall, G.D. Farquhar. Academic Press, San Diego, pp 109--129.
Brooks, J.R., D.G. Sprugel and T.M. Hinckley. 1996. The effects of light acclimation during and after foliage expansion on photosyn-thetic function of Abies amabilis foliage within the canopy. Oecolo-gia 107:21--32.
Buchmann, N., J.R. Ehleringer and W.-Y. Kao. 1996. Carbon dioxide concentrations within forest canopies----Variation with time, stand structure and vegetation type. Global Change Biol. 2:421--432. Ceulemans, R., I. Impens and V. Steenackers. 1987. Variations in
photosynthetic, anatomical and enzymatic leaf traits and correla-tions with growth in recently selected Populus hybrids. Can. J. For.
Res. 17:273--283.
Conway, T.J., P.P. Tans, L.S. Waterman, K.W. Thoning, D.R. Kitzis, K.A. Masarie and N. Zhang. 1994. Evidence for interannual vari-ability of the carbon cycle from the National Oceanic and Atmospheric Administration/Climate Monitoring and Diagnostics Laboratory Global Air Sampling Network. J. Geophys. Res. 99:22831--22855. Doley, D., G.L. Unwin and D.J. Yates. 1988. Spatial and temporal distribution of photosynthesis and transpiration by single leaves in a rainforest tree, Argyrodendron peralatum. Aust. J. Plant Physiol.
15:317--326.
Ehleringer, J.R., S.L. Phillips and J.P. Comstock. 1992. Seasonal variation in the carbon isotopic composition of desert plants. Funct. Ecol. 6:396--404.
Ehleringer, J.R., C.B. Field, Z. Lin and C. Kuo. 1986. Leaf carbon isotope and mineral composition in subtropical plants along an irradiance cline. Oecologia 70:520--526.
Fan, S.-M., S.C. Wofsy, P.S. Bakwin and D.J. Jacob. 1990. Atmos-phere-biosphere exchange of CO2 and O3 in the central Amazon Forest. J. Geophys. Res. 95:16851--16864.
Farquhar, G.D., J.R. Ehleringer and K.T. Hubick. 1989. Carbon iso-tope discrimination and photosynthesis. Annu. Rev. Plant Physiol. Mol. Biol. 40:503--537.
Garten, C.T. and G.E. Taylor, Jr. 1992. Foliar δ13C within a temperate deciduous forest: spatial, temporal, and species sources of variation. Oecologia 90:1--7.
Gutierrez, M.V. and F.C. Meinzer. 1994. Carbon isotope discrimina-tion and photosynthetic gas exchange in coffee hedgerows during canopy development. Aust. J. Plant Physiol. 21:207--219. Hom, J.L. and W.C. Oechel. 1983. The photosynthetic capacity,
nutri-ent use efficiency of differnutri-ent needle age-classes of black spruce (Picea mariana) found in interior Alaska. Can. J. For. Res.
13:834--839.
Keeling, C.D. 1961. The concentration and isotopic abundances of carbon dioxide in rural and marine air. Geochim. Cosmochim. Acta 24:277--298.
Lawrence, W.T. and W.C. Oechel. 1983. Effects of soil temperature on the carbon exchange of taiga seedlings. II. Photosynthesis, respira-tion and conductance. Can. J. For. Res. 13:850--859.
Leverenz, J., J.D. Deans, E.D. Ford, P.J. Jarvis, R. Milne and D. Whitehead. 1982. Systematic spatial variation of stomatal conduc-tance in a Sitka spruce plantation. J. Appl. Ecol. 19:835--851. Lloyd, J., B. Kruijt, D.Y. Hollinger, J. Grace, R.J. Francey, S.-C.
Wong, F. Kelliher, A.C. Miranda, G.D. Farquhar, J.H.C. Gash, N.N. Vygodskaya, I.R. Wright, H.S. Miranda and E.-D. Schulze. 1996. Vegetation effects on the isotopic composition of atmospheric CO2 at local and regional scales: theoretical aspects and a comparison between rain forest in Amazonia and a boreal forest in Siberia. Aust. J. Plant Physiol. 23:371--399.
Marshall, J.D. and J. Zhang. 1994. Carbon isotope discrimination and water-use efficiency in native plants of the North-Central Rockies. Ecology 75:1887--1895.
McNaughton K.G. and P.G. Jarvis. 1991. Effects of spatial scale on stomatal control of transpiration. Agric. For. Meteorol. 54:279--301.
Melillo, J.M., A.D. McGuire, D.W. Kicklighter, B. Moore III, C.J. Vorosmary and A.L. Schloss. 1993. Global climate change and terrestrial net primary production. Nature 363:234--240.
Reich, P.B., D.S. Ellsworth, B.D. Kloeppel, J.H. Fownes and S.T. Gower. 1990. Vertical variation in canopy structure and CO2 ex-change of oak-maple forest: influence of ozone, nitrogen, and other factors on simulated canopy carbon gain. Tree Physiol. 7:329--345. Rich, P.M., R.A. Fournier, Y.R. Alger, N.M. August and V.L. Peterson. 1995. A hierarchical sampling approach for characterizing canopy architecture of boreal forests. Bull. Ecol. Soc. Am., 142 p. Schulze, E.-D., M.I. Fuchs and M. Fuchs. 1977. Spatial distribution of
photosynthetic capacity and performance in a mountain spruce forest of northern Germany I. Biomass distribution and daily CO2 uptake in different crown layers. Oecologia 29:43--61.
Sellers, P., F. Hall, H. Margolis, B. Kelly, D. Baldocchi, G. Den Hartog, J. Cihlar, M.G. Ryan, B. Goodison, P. Crill, K.J. Rason, D. Lettermaier and D.E. Wichland. 1995. The boreal ecosystem--at-mosphere study (BOREAS): An overview and early results from the 1994 field year. Bull. Am. Meteorol. Soc. 76:1549--1577. Stangel, D.E., R.H. Cuenca and S.F. Kelly. 1995. BOREAS soil water
monitoring and soil hydraulic properties. (Abstract) EOS, Transac-tions, American Geophysical Union, Vol. 76, No. 17, Supplement, p. S118.
Sternberg, L. 1989. A model to estimate carbon dioxide recycling in forests using 13C/12C ratios and concentrations of ambient carbon dioxide. Agric. For. Meteorol. 48:163--173.
Sternberg, L., S.S. Mulkey and S.J. Wright. 1989. Ecological interpre-tation of leaf carbon isotope ratios: influence of respired carbon dioxide. Ecology 70:1317--1324.
Stewart, J.D. and J. Hoddinott. 1993. Photosynthetic acclimation to elevated atmospheric carbon dioxide and UV irradiation in Pinus banksiana. Physiol. Plant. 88:493--500.
Tans, P.P., I.Y. Fung and T. Takahashi. 1990. Observational constraints on the global atmospheric CO2 budget. Science 247:1431--1438. Valentini, R., G.E. Scarascia Mugnozza and J.R. Ehleringer. 1992.
Hydrogen and carbon isotope ratios of selected species of a medi-terranean macchia ecosystem. Funct. Ecol. 6:627--631.
Vogel, J.C. 1978. Recycling of carbon in a forest environment. Oecol. Plant. 13:89--94.

![Figure 5. Daily patterns of [CO2] at sixheights in the canopy for all stands inthe NSA and SSA](https://thumb-ap.123doks.com/thumbv2/123dok/1010206.922614/7.612.79.422.67.526/figure-daily-patterns-sixheights-canopy-stands-inthe-nsa.webp)
![Figure 6. Daytime canopy profiles of [CO2] for sites in the NSA. Dataare a subset of the data presented in Figure 5.](https://thumb-ap.123doks.com/thumbv2/123dok/1010206.922614/8.612.317.539.73.445/figure-daytime-canopy-profiles-dataare-subset-presented-figure.webp)