119
The Correlation between Happiness Level andThe Sustainibility
of Urban Kampung in Malang
Ratih Ikawaty
1*, Surjono
21 Department of Civil Engineering, Faculty of Engineering, University Brawijaya, Malang, Indonesia*
2 Department of Regional Planning Engineering, Faculty of Engineering, University Brawijaya, Malang, Indonesia
Abstract
Indonesian happiness index was released in 2013 being the representation of happiness of the Indonesian population. Indonesia conforms that sustainable development is a future development objective is the goal of future development as the happiness achievement of Indonesian society is supported by several economic, social and environmental indicators which are the main components of the sustainable development concept. Significantly the happiness index has a positive relationship with the sustainability achievement, cities that meet the criteria of sustainable development can provide greater opportunities for the community to achieve happiness. This study evaluated the happiness of the villagers with the happiness index and fuzzy logic approach, then analyzed the relationship between the level of happiness of the villagers using sustainability of the kampung. The result of this study indicates that the level of happiness has a linear relationship with the sustainability, this can be seen from the happiness level of Kampung Sukun at 0.51 (happy) correlates with the sustainability level at 0.68 (medium high sustainability) while for Kampung Kebalen has a happiness level at 0.48 (less than happy) with sustainability level at 0.45 (medium sustainability). These two values indicate the linearity of the relationship between the happiness index and the levels of sustainability of the kampungs.
Keywords: happiness index, level of sustainability, fuzzy logic.
INTRODUCTION(Calibri 10 Bold, Left, Capslock)
The goal of the development in Indonesia has been set nationally in accordance with Constitution of the Republic of Indonesia which is creating prosperity for Indonesian.The level of prosperity can be measured with two ways, by using the similar standard (objective indicator) and by using different standard (subjective indicator). To date, economics indicator become one of the important indicator that is considered as a description to the level of prosperity of community. However, since 2005, Gross National Happiness approach that was initiated by Buthan as a benchmark in viewing the nation prosperity, become a reference in the creation of happiness index in many nations, including Indonesia. Happiness index in Indonesia was first released in 2013 which is used as an illustration or estimation of Indonesian happiness level nationally as well as in each region in Indonesia. The achievement of the community happiness level is supported by several economics, social,
Correspondence address: (Calibri 8 Bold, Left)
Ratih Ikawaty
Email : [email protected]
Address : Jl. Mayjend Haryono No. 167, Malang, 65145, Indonesia
and environmental indicators which are the main component of the sustainable development concept [1]. In 2000, The United Nations Development Program (UNDP) and 108 nations in the world agreed on Sustainable Development Goals (SDGs) as the goal of the future development. The third goal of SDGs is to ensure a healthy life and encourage prosperity for people in all ages and create cities and human settlements that are safe and sustainable [2]. A sustainable city can be defined as a form that enable a city to function based on the capacity of natural and artificial support which can ease the activity of its inhabitants by several components which are compactness, density, mix use, diversity, greening [3]. Physical components is the essential elements in achieve the sustainability because of the strong correlation between the development of social factor and environmental quality improvement.
120 environment which makes the residential
environment and area tend to be slum due to the limited land and the limited chance of the low-income people to get habitable home [4]. In accordance to the Medium Term Development Plan of Malang City 2013-2018, Kampung Kebalen Kelurahan Sukoharjo RW 1 is included in the delineation of slum area, which identifies that there are physical quality degradation in Kampung Kebalen. Meanwhile for RW 3, Kampung Terapi Sukun is a winner of clean and green competition and a child-friendly village. Both of the Kampung are chosen as the research location in order to give the description of
villagers’ perspective about physical sustainable
components and happiness level from two villages that have different characteristics. Happiness index have a positive correlation with a sustainable achievement significantly. The result of the research shows that the city that seek sustainable development (the one that have a high score in sustainability index) can bring bigger opportunities to the community to achieve happiness [5]. In the case of cities in the United States, the emphasis of the sustainable urban characteristic will lead to the achievement of happiness. Happy citizen have a level of participation in the community and engage in activities related to sustainable development. The previous research has explained that the positive correlation between happiness and the sustainable achievement, sustainable which consists of social, economics, and environmental aspects. Thus, this research is aimed to analyze whether happiness index correlate with sustainable level.
MATERIAL AND METHOD(Calibri 10 Bold, Left, Capslock)
Happiness index is included as composite index that measured with weighted basis and include individual satisfaction towards ten essential domain/aspects. 10 aspects of happiness are health conditions, education and skills, employment, household income, security conditions, social relations, leisure time availability, home conditions, environment, and family harmony.
1. Value Conversion Life Satisfaction Index
The value of life satisfaction index is the value of satisfaction of each individual in every aspect of happiness, which is converted on a scale of 0-100 with the following formula.
IKH =
where life satisfaction index of scale 0-100 (IKH), life satisfaction index of scale 1-10 (i) and differences between the largest and smallest values on the measurement scale (range). 2. Happiness Index Calculation
IK=
where happiness index (IK), the value for the variable, the loading factor derived from the factor analysis method (bi), and the value of the variable i to j (Xij)
According to the Central Bureau of Statistics Year 2014, On a scale of 0-100, If the index is 0-100, the scale is divided into four groups, namely 0-25.00 (unhappy), 25.01-50.00 (less happy), 50.01-75.00 (happy) and 75.01-100 (very happy). 3. Fuzzy Logic
The mamdani method is used with the consideration that weight of each aspect of happiness is taken into account. The triangular curve for the membership function in fuzzy logic uses linear membership up functions:
where membership value (x), lower limit value (a), and upper limit value (b)
while the linear membership function down functions:
where, membership value (x), lower limit value (a), and upper limit value (b)
The membership function of the triagle curve is a combination of linear membership, can be seen in Figure 1, while membership function of the triangle use the formula:
where, membership value (x), lower limit value (a), and upper limit value (b)
Figure 1. FLL Tringle Curve
0
a
b x
c
121 The use of ordinal scales in the normalization
of a happiness level assessment is done with the consideration that this scale has proven to be very useful in assessing a very complex and varied level of happiness. Normalization of values into ordinal scale will be done in the range 0-100. This is done in accordance with the output of the assessment results of each assessment method of happiness level that mostly are in the range of 0-100 values.
Data Collection (Calibri 10 Bold, Left)
The data collection method that is used is primary survey, supported by interview and questionnaire. The questionnaire consists of series of questions that is related with the research in order to find the answer about the life aspect that represent the level of happiness in Kampung Sukun and Kampung Kebalen.
RESULT AND DISCUSSION (Calibri 10 Bold, Left, Capslock)
Happiness Index of Kampung Sukun
The calculation of happiness index according to BPS determines the value of each variable based on the result of the value of loading factor from the factor analysis method. The weight of each variable on the happiness index is calculated proportionally based on the distribution of data with factor analysis.
Table 1. Loading factor value
Variable Loading Factor
Health conditions 1.379 Education and skills 1.161
Employment 1.060
Household income 1.555 Security condition 1.582 Social relations 1.572 Leisure time availability 1.005
Home conditions 1.499 equal to 1 will be retained and factors having an eigen value of less than 1 will not be included in
the model because the variable whose value is less than 1 is not better than the original variable. Seeing from the percentage of the result of the variance, the total value of variance is 66.21% which means that the four components formed can already represent the overall variable happiness index because it is more than 50% in total. Furthermore, the index is measured and it includes individual satisfaction indicators of the ten essential variables.
Table 2. Happiness Index of Kampung Sukun
No. 5 Security condition 93.06% 6 Social relations 98.68% 7 Leisure time availability 77.79% 8 Home conditions 91.14%
9 Environment 96.27%
10 Family harmony 96.63%
The higher the happiness index value indicates an even happier life level. Every aspect of happiness will have different contributions to the level of happiness of each individual. Table 2 show three aspects of the highest contribution to the happiness index Kampung Terapi which are social relations with 98.68, family harmony with 96.63%and environmental conditions of 96.27%. Social relations among fellow citizens is something that is always maintained by Kampung Terapi Sukun residents, this social relations is intertwined from a lot of activities or events that can build cooperation and good relations among fellow citizens. In addition, to the high level of participation of residents in the activities or events arealways greatly accomplished.
Happiness Index Kampung Kebalen
The calculation of happiness index according to BPS determines the value of each variable based on the value of loading factor generated from the factor analysis method.
Table 3. Loading factor value
Variable Loading Factor
Health conditions 1.165 Education and skills 1.152
Employment 1.061
122
Variable Loading Factor
Security condition 1.607 Social relations 1.188 Leisure time availability 1.398 Home conditions 1.099
Environment 1.378
Family harmony 1.487
Table 3 show the factor loading values of each
aspect that will be entered for the happiness index calculation. The percentage of the variance result, the total value of the variance is 65.30% which means that the four components formed can already represent the overall variables happiness index because the value is more than 50%. Furthermore, the index is measured and it includes individual satisfaction indicators of the ten essential variables. Result of calculation of happiness index of Kampung Kebalen residents can be seen in Table 4
Table 4.Happiness Index of Kampung Kebalen
No. Variable Index Happiness Value
1 Health conditions 92% 2 Education and skills 83.65%
3 Employment 65.33%
4 Household income 93.19% 5 Security condition 93.06% 6 Social relations 98.68% 7 Leisure time availability 77.79% 8 Home conditions 91.14%
9 Environment 96.27%
10 Family harmony 96.63%
The higher the happiness index value indicates an even happier life level. Every aspect of happiness will have different contributions to the level of happiness of each individual. Three aspects of the highest contribution to the happiness index Kampung Kebalen which are social relations with 98.68, family harmony with 96.63%and environmental conditions of 96.27%. Social relations among fellow citizens is something that is always maintained by Kampung Kebalen this social relations is intertwined from a lot of activities or events that can build cooperation and good relations among fellow citizens.
Happiness Level based on Fuzzy Analysis Validity Test
The validity test indicates the extent to which a measuring instrument is valid in measuring the measured variable. The validity of a measuring
instrument depends on whether or not the measuring instrument achieves the desired measurement objectives appropriately. Prior to analysis, variables need to be selected and selected. Furthermore, the feasibility test of the variable by testing the validity of the initial variables.
Table 5. Validity Result
Variable Tcount Result
Health conditions 0.371 Invalid Education and skills 0.543 Valid
Employment 0.708 Valid
Household income 0.708 Valid Security condition 0.266 Invalid Social relations 0.543 Valid Leisure time availability 0.388 Invalid Home conditions 0.151 Invalid
Environment 0.537 Valid
Family harmony 0.506 Invalid
Table 5 describes the results of the validity test, found valid variables of education, employment, household income, social relations, and environment. Valid variables are considered as variables as a measuring instrument capable of achieving the desired measurement objectives. So in identifying the level of village happiness using fuzzy analysis using valid variables of the validity test results.
Fuzzy Logic
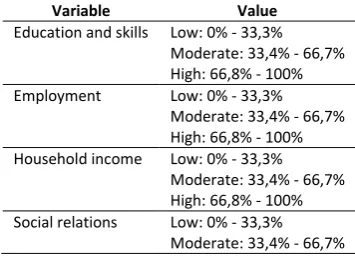
Fuzzy analysis is used to get an idea of how the level of happiness for each village. Based on the assessment of happiness level according to the Central Bureau of Statistics, the values for each aspect of happiness are education, income, occupation, income, social, and environment. The value obtained from the calculation results into input to determine the level of happiness with fuzzy analysis can seen in Table 6
Table 6. Happiness Aspect Interval for Fuzzy Analysis Input
123
Variable Value
High: 66,8% - 100% Environment Low: 0% - 33,3%
Moderate: 33,4% - 66,7% High: 66,8% - 100%
Fuzzification
Happiness variables were assessed by using
three memberships: μ [Low], μ [Medium], and μ
[High]. The membership set μ [Low] will use the linear curve equation down, the membership set
μ [High] will use the linear curve equation rise,
while the membership set μ [Medium] uses the
equation of the triangle curve. The equations for each set of membership variables of happiness are:
μ[Low] =
The membership setμ[Moderate] uses the equation of the triangle curve as follows:
μ[Moderate] =
The membership setμ[ouses the equation of the triangle curve as follows:
μ[High] =
Aspect of Happiness Fuzzification
Aspects of happiness will be assessed by using three memberships which are μ [Unhappy], μ
[Less happy], μ [Happy], μ [Very happy]. The membership set μ [Unhappy] will use the linear curve equation down, the membership set μ
[very happy] will use the rise linear curve equation, while the membership set μ [less
happy] and μ [happy] will use the equation of the
triangle curve. Membership adjusted for normalization of assessment results of each aspect can be seen in Table 7
Table 1. Membership Function Each Aspects of Happiness
Happiness Aspects Membership Function
Unhappy 0-25,00
Less happy 25,01-50,00
Happy 50,01-75,00
Very happy 75,01-100
The equation for each set of membership of the urban sustainability level is:
μ[Unhappy]=
μ[Less happy] =
μ[happy] =
μ[Very happy]=
Inference System (Rule base) Happiness Level The rule base of happiness level in the urban vilages is one of the step that is need to be determined for the criteria based on fuzzy analysis.
Table 2. Rule Base Criteria
Category Condition
Unhappy If none of the variable is in high and moderate category.
Less happy
If in maximum 2 variables are included as high and low category.
Happy If in minimum three variables are in the high level and none of the variable is in low level. Very
Happy
If none of the variable is in low level and have minimum 4 variable in high level.
Table 8 expalin about rule base for happiness level in this study is obtained from Delphi method, based on the opinion of the interviewe.
Defuzzification of A Village Happiness Level
124
Figure 2. Kampung Sukun defuzzification
Table 3. Defuzzification Result of A Village Happiness Level
Village Defuzzification values
Happiness Level
Sukun 0.674 Happy
Kebalen 0.48 Less happy
The Correlation of Happiness Level and Village Sustainablility
The sustainability of a development is not only influenced by economics and physical factors but also social factor. The development have to be seen as one of a multidimensional process, that involve several aspects which are educational, economics and social aspects as a whole. Besides the increasing of an income and output, the development process also deals with a series of fundamental changes to institutional, social structures.From the result of the calculation of happiness level using fuzzy logic, the happiness level obtained for each villages are Kampung Sukun 0.67 in happy category, and Kampung Kebalen 0.48 in the less happy category. Furthermore, the correlation between happiness level and the sustainability level that is obtained from the result of a study entitled
“Evaluation of Sustainability of a Village Using
Fuzzy Logic in 2016” can be seen below [6].
Kelurahan sukun is one of best pratice in environmental management in Kota Malang because it is included as its pilot village with
some programs of development of a village that has been implemented starting from 2009 with its waste-sorting program, in 2011 with the recharge program, in 2012 the construction of a Biopori, andthey continue to organize the village development programs such as medicinal plants, composter, and reading garden.As there were a lot of programs implemented in Kampung Sukun, the village was awarded the national level award as pilot village. The value of its sustainability level was not measured in the study "Sustainable Village Evaluation Using Fuzzy Logic Approach, 2010". Figure 3 show the level of happiness Kampung Sukun for 0.67 and supported by a program that continues to run well, then the level of Kampung Terapi Sukun sustainability is considered as a high sustainability.
Figure 3. The Correlation of Happiness and Sustainability Level in Kampung Sukun
125
Figure 4. Kampung Kebalen defuzzification
environment that contributes 86.06%, income 80.23%, social relationships 66.15%, education 65.98% and 65.57% work.From that aspect, the happiness level of Kampung Kebalen citizen is 0.48 which is included in the less happy category. Apart from the level of happiness, it can be seen the sustainability of Kampung Kebalen is 0.45 and included in the medium sustainability category which is assessed from compactness, accessibility, density, entropy, poverty, and community participation.
Figure 5. The Correlation of Happiness Level and Sustainability Level of Kampung Kebalen
From the analysis of the level of happiness and sustainability of the village, it can be seen that the level of happiness has a linear correlation with the sustainability level. Figure 4 show the happiness level of Kampung Sukun in 0.62 (medium high sustainability) while Kampung Kebalen has the happiness level of 0.48 (less happy) with the sustainability level of 0.45 (medium sustainability). From the previous explanation, it can be concluded that if the happiness have a high value, then the level of sustainability of the village also went up because it has a direct proportional correlation. If the
urban villagers have a high level of happiness from the aspect of their lives, it is also expected that the urban village also has a good level of economic, social, and environmental sustainability.
CONCLUSION
1. The happiness index set by BPS in 2014 is a subjective indicator used to measure the level of community welfare. Indonesia's happiness level is seen from 10 aspects of life, namely health condition, education and skills, occupation, household income, security condition, social relations, leisure time availability, house and asset condition, environmental condition, and family harmony. The things that can be concluded from the research results are: The value obtained from each of happiness aspects based on BPS in Kampung Sukun are the health condition is 92%, education and skill aspect is 83,65%, occupation aspect is 65,33%, household income aspect is 93,19%, and security condition is 93,06%, social relations is 98,68%, the availability of leisure time is 77,79%, house and asset condition aspect is 91,14%, environmental condition is 96,27%, and the harmony of family aspect is 96,63%.
126 75,06%, environmental condition is 86,06%, and
the harmony of family aspect is 97,25%.
3. The result of the analysis of urban village happiness and sustainability level is that the two have a linier correlation. It can be seen from the happiness levelof Kampung Sukun is in the number of 0.51 and belongs to happy category and the level of sustainability is identified as 0.68 (medium high sustainability). Meanwhile, Kampung Kebalenhas 0.48 as the number of the happiness level that belongs to less happy category and has asustainability level in 0.45 (medium sustainability). From those two values, it can be concluded that the ifthe value of happiness is high then the level of sustainability is also goes up because they have a linier correlation.
ACKNOWLEDGEMENT
Author gratefully acknowledges the valuable suggestion created by faculty who collaborate with this research
REFERENCES
[1]. Duran, C Dan; Gogan, M Luminita; Artene, Alin; Duran, Vasile. 2015. The components of sustainable development-a possible approach. World Conference on Business,
Economics and Management, WCBEM:
806-811. Romania.
[2]. Cloutier, S., Larson, L., & Jambeck, J. (2014).
Are sustainable cities ‘‘happy’’ cities?
Associations between sustainable development and human well-being in urban areas of the United States. Environmental
Development Sustain. 16: 633-647.
[3]. Jabareen, Y. R. (2006). Sustainable Urban
Forms: Their Typologies, Models and
Concepts. Massachusetts: Association of
Collegiate Schools of Planning.
[4]. Wijaya, D. W. (2016). Perencanaan penanganan kawasan permukiman kumuh studi penentuan kawasan prioritas untuk peningkatan kualitas infrastruktur pada kawasan pemukiman kumuh di Kota Malang.
Jurnal Ilmiah Administrasi Publik (JIAP) , Vol
2: 1-10.
[5].
Verdugo, V. C., Acosta, J. M., Fonllem, C. T., & Sing, B. F. (2011). Happiness as Correlate of Sustainable Behavior: A Study of Pro-Ecological, Frugal, Equitable and AltruisticActions That Promote Subjective Wellbeing.
Research in Human Ecology , Vol 18: 95-104.