QUANTITATIVE AND
QUALITATIVE METHODS
FOR POVERTY ANALYSIS
PROCEEDINGS OF THE WORKSHOP HELD
ON 11 MARCH 2004, NAIROBI, KENYA
Edited by
Kenya Institute for Public Policy Research and Analysis
Bishops Garden Towers, Bishops Road PO Box 56445, Nairobi, Kenya
tel: +254 20 2719933/4, 2714714/5, 2721654, 2721110 fax: +254 20 2719951
email: [email protected] website: http://www.kippra.org
ISBN 9966 949 81 X
derived was facilitated by the Kenya Institute for Public Policy Research and Analysis (KIPPRA) and sponsored by USAID’s Strategies and Analysis for Growth and Access (SAGA) project. The project was directed by Prof. Chris Barrett of Cornell University (USA).
QUALITATIVE METHODS
FOR POVERTY ANALYSIS
Proceedings of the Workshop Held on 11
March 2004, Nairobi, Kenya
Edited by
Walter Odhiambo
John M. Omiti
David I. Muthaka
Published 2005
© Kenya Institute for Public Policy Research and Analysis Bishops Garden Towers, Bishops Road
PO Box 56445, Nairobi, Kenya
tel: +254 20 2719933/4; fax: +254 20 2719951 email: [email protected]
FOR POVERTY ANALYSIS
CONTENTS
Acknowledgements ... vii
Abbreviations and acronyms ... viii
I Background ... 9
II Introduction and Official Opening Session ... 11
III Session 1: Methods for Poverty Analysis ... 14
1. Quantitative poverty analysis (Prof. G. Mwabu) ...15
2. Bridging the qualitative-quantitative methods in poverty analysis (Prof. E. H. N. Njeru) ...23
3. Mixing qualitative and quantitative methods in analyzing poverty dynamics (Prof. C. Barrett) ...37
Observations and Comments from Participants ...57
IV Session 2: Case Studies ... 58
4. Researching poverty in rural Kenya: Methodological concerns arising from methods adopted (Dr. Mary Omosa) ...59
5. Poverty mapping: The case of Kenya (A. K. M. Kilele) ... 69
6. Social aspects of dynamic poverty traps: Cases from Vihiga, Baringo and Marsabit Districts, Kenya (N. Mango et al.) ...85
7. Indices and manifestations of poverty: Informing anti-poverty policy choices (Prof. W. Oluoch-Kosura et al.) ...111
8. Poverty in Kenya: A review of quantitative and qualitative studies (Dr. D. K. Manda) ...125
Observations and Comments From Participants ...151
Acknowledgements
The workshop from which these proceedings are derived was facilitated by the Kenya Institute for Public Policy Research and Analysis (KIPPRA) and sponsored by USAID’s Strategies and Analysis for Growth and Access (SAGA) project. The project was directed by Prof. Chris Barrett of Cornell University (USA).
Strategies and Analysis for Growth and Access (SAGA) is a project of Cornell and Clark Atlanta Universities, funded by cooperative agreement No. HFM A 00 01 00132 00 with the United States Agency for International Development (USAID). In Kenya, SAGA is implemented through a collaboration among Cornell and Clark Atlanta universities, the Institute of Policy Analysis and Research, the Kenya Institute for Public Policy Research and Analysis, Tegemeo Institute of Agricultural Policy and Development, and the University of Nairobi Department of Agricultural Economics.
We acknowledge the contribution of Dr Walter Odhiambo of KIPPRA, Dr John M. Omiti of IPAR, and David I. Muthaka of KIPPRA in compiling and editing these proceedings. We would also like to acknowledge the contribution of Felix Murithi of KIPPRA in the editorial production of these proceedings, and Janet Hou, a student at Cornell University, for the editorial input during preparation of these proceedings.
Finally, we sincerely thank all those who contributed to the success of this project, and especially the participants of the workshop held on 11 March, 2004 at the Grand Regency Hotel, Nairobi.
All views, interpretations, recommendations, and conclusions expressed in this volume are those of the authors and not necessarily those of the supporting or cooperating organizations.
KIPPRA
Abbreviations and Acronyms
ASAL Arid and semi-arid lands
BASIS Broadening Access and Strengthening of Input Systems CBS Central Bureau of Statistics
CBN cost of basic needs
CRSP Collaborative Research Support Program ERS Economic Recovery Strategy
FEI food-energy-intake
FEMNET African Womens Development & Communication Network ICRAF International Centre for Research in Agro-Forestry
IDS Institute for Development Studies
IFPRI International Food Policy Research Institute ILRI International Livestock Research Institute IPAR Institute of Policy Analysis and Research KARI Kenya Agricultural Research Institute ETRI Kenya Typanosomiasis Research Institute
KIPPRA Kenya Institute for Public Policy Research and Analysis OECD Organization for Economic Cooperation and Development PARIMA Pastrol Risk Management (project)
PPA Participatory poverty assessment PRSP Poverty Reduction Strategy Paper
SAGA Strategies and Analysis for Growth and Access SFR Soil Fertility Replenishing
SLF Sustainable Livelihoods Framework UoN University of Nairobi
USAID United States Agency for International Development WAU Wagenigen Agricultural University
Poverty is an intractable challenge for most African countries. It is not only spreading fast, but it is also becoming severe in many locations. In response, governments and development partners have renewed their interests and re-committed themselves to poverty reduction. A number of things symbolize this commitment. Most countries have, with the support of development partners, formulated poverty reduction strategy papers (PRSPs) and have embarked on far-reaching programmes for economic growth and poverty reduction. And as part of a global process, a number of these countries have also committed themselves to the realization of Millennium Development Goals (MDGs), the first of which calls for substantial poverty reduction. While experiences differ from country to country, there is no doubt that most African countries are tackling poverty head-on.
Success on poverty reduction in most developing countries will, however, depend on the availability of reliable, accurate and timely information on the nature and causes of poverty. Policy makers and development partners require information on the poor, especially their population sizes and location.
Issues of the severity and dynamics of poverty are also receiving increasing attention in analysis, and there is also a growing urge to understand the causes of poverty as a step in formulating strategies for helping people out of poverty or to avoid it. All these demand a rethinking of the methods that social scientists use in the analysis of poverty. Fortunately, there have been significant advances in these methods in recent times. Economists have predominantly utilized quantitative household data obtained from structured surveys. While these approaches are able to quantify crucial dimensions of poverty, they fail to convey other less readily measurable dimensions such as
the texture of poverty (i.e. the pain of deprivation, acute tensions, violence and emotions associated with poverty, etc). Other social scientists, mainly sociologists, anthropologists and psychologists have advanced other approaches using participatory methods, ethnographic and social analyses. These methods predominantly use qualitative data. However, one could similarly critique qualitative methods used by non-economists.
The seemingly differing positions of practitioners and professionals in the analysis of poverty suggest that there is no single perfect approach to poverty analysis. It would appear, however, that the approaches are not in conflict, but are complementary in as much as they attempt to capture the many dimensions of poverty. This calls for efforts to integrate qualitative and quantitative approaches or to “sequentially” or “simultaneously” mix the approaches.
It was against this background that Cornell University and Kenya Institute for Public Policy Research and Analysis (KIPPRA), with the support of USAID’s Strategies and Analysis for Growth and Access (SAGA) project, organized a one-day workshop in Nairobi to discuss issues on qualitative and quantitative poverty analysis. The workshop sought answers to the following key questions:
(i) How do quantitative and qualitative approaches differ? What are the similarities?
(ii) How can the gap between quantitative and qualitative approaches be bridged?
(iii) What are the experiences in using quantitative and qualitative approaches in Kenya?
Forum participants included policy makers, senior government officers, researchers from public and private universities and institutions, and representatives from the private sector and civil society. The format of the meeting comprised presentation of papers (eight papers were presented) and discussions.
There were three main sessions as follows: Session 1: Methods for poverty analysis Session 2: Case studies
The Chairman called upon the Acting Executive Director of KIPPRA, Dr. Hezron Nyangito, to make welcoming remarks. Dr. Nyangito formally welcomed participants to the workshop and gave some brief remarks about KIPPRA’s involvement with other research organizations and its participation in SAGA projects. He then invited Prof. Christopher Barrett to give a brief of the SAGA project. The Permanent Secretary, Ministry of Planning and National Development, Mr. David S. Nalo, then gave his speech as the Chief Guest.
Welcoming remarks: Dr. Hezron Nyangito, Acting Executive Director, KIPPRA
Dr. Nyangito started by thanking all participants for attending the workshop and thanked all the institutions collaborating on the SAGA projects. These institutions include Cornell University, the Institute for Policy Analysis and Research (IPAR), Kenya Institute for Public Policy Research and Analysis (KIPPRA), Tegemeo Institute (Egerton University), and the University of Nairobi. He highlighted KIPPRA’s involvement in poverty analysis since the inception of the Institute in June 1999, and underscored the importance of collaboration between institutions, citing KIPPRA’s benefits from collaboration with the Central Bureau of Statistics (CBS), IPAR, the African Economic Research Consortium (AERC), and Cornell University, among others. He noted that the Permanent Secretary, Ministry of Planning and National Development, who was the chief guest, helped in poverty mapping while he was at the Central Bureau of Statistics, and which was done together with KIPPRA. The Acting Director finally thanked the Permanent Secretary for attending the workshop.
II: INTRODUCTION AND OFFICIAL
OPENING SESSION
SAGA Project brief: Prof. Chris Barrett, Cornell University
In his remarks, Prof Barrett gave a brief of the SAGA project. SAGA (Strategies and Analyses for Growth and Access) is a project of the United States Agency for International Development (USAID), created by its Africa Bureau with an intention of linking American researchers with their counterparts in Africa, especially through the Secretariat for Institutional Support for Economic Research in Africa (SISERA). It is through SISERA that SAGA has established partners in African countries including Ghana, Kenya, Madagascar, Mali, Senegal, South Africa, and Uganda.
The SAGA project involves four themes: Education; Health and Nutrition; Empowerment and Institutions; and Vulnerability and Poverty Dynamics. SAGA organizes its presentations around these themes. Therefore, the purpose of this particular workshop was to share with the participants on where the efforts of poverty analysis are: integrating qualitative and quantitative methods for data collection in poverty research and analysis.
Speech by the Chief Guest, Mr. David S. Nalo, Permanent Secretary, Ministry of Planning and National Development, Kenya
The Permanent Secretary started by thanking the workshop organizers for inviting him to address and officiate over the workshop. He commended the re-union between institutions and researchers in sharing their works, saying that such a culture was good for the continuity of knowledge as there had been decay in knowledge, and the integration of research work in policy making. He highlighted the poverty and income inequality status in Kenya as revealed by different reports, including the Kenyan Human Development Report. The Permanent Secretary noted that the poor have real needs that could not be easily captured using statistical surveys alone.
if that person is deprived of love from the community at large. This, he said, provides a dilemma for researchers and statisticians, and wondered how such different dimensions could be quantified into meaningful categories.
III: SESSION 1
METHODS FOR POVERTY ANALYSIS
Chair: Prof. W. Oluoch
Department of Agricultural Economics
Introduction
Poverty is a complex human phenomenon associated with unacceptably low standard of living. It has multiple dimensions, manifestations and causes (World Bank, 2000). Poverty analysts from a variety of disciplines have been constantly asking questions about this phenomenon, sometimes out of curiousity, but often with the aim of providing information that can be used to overcome it. Quantitative methods help provide answers only to certain questions about poverty and can only provide partial information about it. Needless to say, no single approach to poverty appraisal can capture all the essential aspects of poverty.
Choice of methods of poverty analysis is dictated by the issues of interest to a researcher and his/her research skills. Because of the complexity of the poverty phenomenon, researchers have come to appreciate the need to specialize in acquiring skills that are necessary for understanding only certain dimensions of poverty, and to concentrate their work on areas of poverty appraisal in which they have comparative advantage. As Barrett (2001) has observed, the type of poverty appraisal that has been undertaken over the past decades has been subject-driven, and researcher-directed. This is of course no accident; the concept of comparative advantage suggests that there is efficiency to be gained from specializing in certain approaches to poverty appraisal. Quantitative poverty analysis is a particular area of
1 This is a revised version of the paper prepared for the KIPPRA-Cornell SAGA Workshop on “Quantitative and qualitative methods for poverty analysis”, 11 March, 2004, Nairobi. I am very grateful to Paul Kimalu of KIPPRA and workshop participants for helpful comments.
1.
QUANTITATIVE POVERTY ANALYSIS
1Prof. Germano Mwabu
poverty research in which investigators with quantitative skills specialize.
In view of efficiency gains from specialization, it is noteworthy that recent literature has strongly advocated mixing of qualitative and quantitative skills in poverty appraisal (Kanbur, n.d). Two types of mixing have been suggested, namely, sequential and simultaneous mixing. Sequential mixing is consistent with the idea of specialization in poverty appraisal along disciplinary lines because it entails separate applications of quantitative and qualitative skills in an attempt to understand the same or different aspect of poverty. The outcome of sequential mixing of quantitative and qualitative skills is essentially a comparative appraisal of poverty, whereby results from different approaches are compared and synthesized. This would be precisely the outcome of comparing or synthesizing results from specialized poverty research across disciplines.
The advantage of specialization is a better understanding of a particular dimension of poverty; the disadvantage of specialization is that it facilitates only a superficial understanding of the overall poverty phenomenon. To a certain extent, simultaneous mixing overcomes this problem by providing different perspectives on the same dimension of poverty or a better perspective on different dimensions.
Simultaneous mixing is another way of saying that researchers have convex preferences over quantitative and qualitative approaches to poverty appraisal. In other words, researchers consider a combination of quantitative and qualitative methods to be more effective than specialized methods in the analysis of poverty. As a positive matter, this view is not an accurate description of the practice of poverty analysis. Wherever it is found, simultaneous mixing is often a case of incomplete or imperfect specialization. In practice, the dominant mode of poverty analysis is either quantitative or qualitative. The advantages of comparative advantage dictate that simultaneous mixing occurs only at the extreme ends of the qualitative-quantitative spectrum.
In what follows, I outline questions or issues that can best be addressed by quantitative or predominantly quantitative methods.
Questions related to poverty measurement
Quantitative approaches are best suited to answering questions related to poverty measurement. These are inherently quantitative issues, in the sense that they must be addressed using numerical information derived from sample surveys. Such data are analyzed using statistical techniques, with the interpretation of the results being guided by a discipline-specific perspective, rather than by a broad social science model (Kanbur, n.d.). Although qualitative (non-numerical) data can also be used to supplement the work of poverty measurement, they are not the main focus in this type of poverty analysis. Further, even when such data are collected, they are often converted into numerical data, amenable to statistical analysis.
The key questions related to poverty measurement include the following:
• What is the magnitude of poverty in the population? • What is the trend of this magnitude over time? • Who in the population is most vulnerable to poverty?
• Given that the determinants of poverty are known (perhaps through qualitative approaches), to want extent would poverty change if each of the determinants were to be modified by public policy? • Who would benefit from particular antipoverty programmes, and
to what extent?
These and similar questions are best addressed using statistical techniques applied to data derived from probability household sample surveys. The key to answering the above questions quantitatively lies in the choice of a convenient metric for measuring the standard of living, and in using the same metric to devise a yardstick for determining who is poor and who is not poor.
Economists use income as the preferred metric of standard of living so that a person with a higher income is deemed to enjoy a higher standard of living, ceteris paribus. A cut-off level of income (e.g., one
The setting of the poverty line provides an excellent example of thorough simultaneous mixing of qualitative and quantitative methods in poverty analysis. Although the poverty line is a numerical parameter, calculated using statistical methods, it is subjectively chosen; for example, value judgments are used to declare that a standard of living based on
less than one dollar a day is socially unacceptable. The same value judgements can be used to choose other poverty lines, such as two
dollars a day, or a median income. However, beyond this, the rest of the work in poverty measurement is inherently quantitative, in the sense that numerical data and statistical techniques are heavily used. To concretize the discussion, I briefly review the main statistical approaches to poverty measurement in relation to specific questions raised above. Among the various methods of quantifying poverty, the FGT formula (Foster, Greer and Thorbecke, 1984) is the most widely used. The formula has been successful in providing a quantitative description of the spread, the depth and severity of income poverty in populations. The inter-temporal trends in these various measures of poverty indicate, in a simple way, the changes in a population’s standard of living over time. The spatial and social profiles of poverty measures show regions and social groups that are most vulnerable to poverty, and therefore suggest appropriate targets for anti-poverty programmes.
In addition to describing poverty, researchers and policy makers are interested in understanding the causes of poverty, and in isolating its main causes. Econometric techniques are appropriate for this purpose. Using these methods, lack of human capital has been identified as the main source of poverty in Kenya and in other African countries (Kimalu et al., 2001). Although qualitative assessment can also successfully identify human capital as the main determinant of poverty, it lacks the policy precision of econometric techniques, and cannot be used to show how changes in various factors would affect a given poverty magnitude. For example, econometric methods can be used to simulate how provision of free education or social health insurance would affect poverty across regions and social groups.
poverty, including those that appear to be inherently qualitative, such as ill health, malnutrition, and lack of capabilities.
I provide below a brief example of a concern of policy makers that can be addressed only via quantitative poverty analysis. Policy makers might be interested in knowing the future effect on poverty reduction of current public programmes (e.g. free primary education or subsidized primary healthcare). The policy makers’ problem in this case is to determine the current poverty status and its trend if certain policy measures are implemented. However, data are typically lacking to make such an assessment. In particular, household survey data for the current period may not be available for computation of the poverty status of the population because such data is only occasionally collected. What is usually available to policy makers is a household survey collected in a previous period. It can be shown that if planners’ projections of future income inequality and growth are available, survey data from a previous period can be used to estimate poverty for the current and future periods.
Indeed, most statistical government agencies routinely make projections of trends in per capita income over the next 2-5 years. Although, projection for trend in income inequality is typically not done, its extrapolation from existing information is straightforward. Projections in income statistics are based on presumed effects of public policies that are programmed for implementation during the plan period. Without the aid of quantitative methods, effects of such programmes on poverty cannot be assessed. Consequently, effective poverty reduction policies may never be implemented and ineffective ones may be executed. To concretize the discussion, consider the following equation (Mwabu et al., 2003).
Poverty_2007Ri = Poverty_2002Ri*(1 + τi) (1) where
Poverty_2007Ri is the head-count index for region i (province or district) in 2007 (the current or future period); Poverty_2002Ri is the head-count index for region i (province or district) in 2002 (the previous period); τi
is the percentage change in the poverty index for region i (nation, province or district) over the period 2002–2007. The term τ, is obtained from econometric estimates of the effects of growth and inequality on poverty (Mwabu et al., 2003) as shown in equation (2).
Poverty rate for year j = α + β (GDP growth) +
where
β and δ are the effects of growth and distribution, respectively, on poverty for year j; α is a constant term, and ε is the error term.
Typically, equation (2) is estimated using data for countries other than the country for which poverty is being assessed; for example, if changes in poverty in Kenya are being assessed, growth and inequality effects derived from Africa-wide data can be used. Therefore, simplicity in measuring poverty using equation (1) is based on the strong assumption that effects of growth and inequality on poverty in one country are applicable in another. Under this assumption Mwabu et al., (2003) used equation (1) to track changes in Kenyan poverty quite well between 1994 and 2000, therefore illustrating its usefulness as a poverty monitoring tool. In other words, the changes in poverty predicted using equation (1) were very close to actual changes computed from survey data.
Therefore, quantitative data and methods can be used to inform policy making in poverty concerns in which qualitative analysis would not be very helpful. There is need also to indicate that there are areas of poverty concerns in which quantitative methods and data would not be of much use to policy makers. For example, if policy makers are interested in measuring non-income dimensions of poverty such as powerlessness and voicelessness (World Bank, 2000) or loneliness, regression methods or the FGT index would not be suited for that purpose primarily because these aspects of deprivation are inherently hard to quantify. Instead, subjective information would be a better reflection of the extent of such deprivations. Moreover, quantitative data may not portray as accurately as the qualitative data, why people like or dislike certain antipoverty programmes.
Conclusion
may be concluded that poverty analysis will continue to be subject-driven and researcher-directed.
References
Barrett, C. (2001). "Integrating Qualitative and Quantitative Approaches: Lessons from the Pastoral Risk Management Project", in Kanbur, Ravi (Ed.). Q-Squared, New Delhi: Permanent Black.
Foster, J., Greer J., and Thorbecke, E. (1984). "A Class of Decomposable Poverty Measures." Econometrica, 52, pp761-765.
Kanbur, Ravi (Ed.). Q-Squared: Qualitative and Quantitative Methods of Poverty Appraisal, New Delhi: Permanent Black (not dated). Kimalu, P. K., Nafula, N., Manda, D.K. and Mwabu, G. (2002). A
Situational Analysis of Poverty in Kenya. KIPPRA Working Paper No. 6., Nairobi: Kenya Institute for Public Policy Research and Analysis. Mwabu, G., Kimenyi, M.S., Kimalu, P., Nafula, N. and Manda, D.K. (2003). “Predicting Household Poverty: A Methodological Note with a Kenyan Example", African Development Review, June. World Bank (2000). World Development Report, Oxford: Oxford University
Press.
Sahn, David and Stephen Younger (2000). "Making Multidimensional Poverty Comparisons", Cornell University, WP No. 98.
Introduction
Poverty is primarily a social problem; as such it requires meticulous definition, identification of constituent parameters and verifiable and measurable indicators. The constituent parameters should essentially single out the major causal factors. Knowledge of the latter, in effect, serves as good basis for identification of perceived solutions and methodologies to guide implementation of the proposed remedial strategies.
Definition
Social scientists have looked at poverty from three broad definitional approaches, viz. absolute, relative and subjective poverty.
Absolute poverty
This refers to subsistence poverty, based on assessment of minimum subsistence requirements, involving a judgement on basic human needs and measured in terms of resources required to maintain health and physical efficiency. The resources in question include quality and quantity of food, clothing and shelter, all perceived as necessary for a healthy life. These basic life necessities are then priced and the total figure or price constitutes the poverty line. Those with incomes below the poverty line are the poor. Poverty begins below and ends above the poverty line in question.
2. BRIDGING THE
QUALITATIVE-QUANTITATIVE METHODS IN
POVERTY ANALYSIS
Prof. Enos H.N. Njeru
Operationalization and measurement of absolute poverty has been based on a number of indicators such as “Level of living index”, focusing on such basic needs as:
• Nutrition: Indicated mainly by caloric and protein intake.
• Shelter: Reflected by the quality of dwelling and absence or presence and the degree of overcrowding.
• Health: As reflected, for example, by the health status of the population, which includes the overall physical, mental and the social well-being of the individuals in the population, and other trends indicated by infant mortality rates, access to and quality of available medical facilities.
The basic human needs have also been broadened beyond physical survival to include “basic social and cultural needs”, such as the need for education, security, leisure and recreation:
• Education: As indicated by the proportion of the population enrolled in schools.
• Security: The number of violent deaths relative to the population size and also cases and types of theft, mugging, rape, etc have been taken to reflect the socio-cultural and security status of the resident populations.
• Leisure: The amount of leisure time, relative to work time has been considered as a good indicator of life consolations away from propensities towards socio-economic inadequacies.
The concept of absolute poverty has been widely criticized especially against its assumption of universal applicability. It assumes, for example, that there are minimum basic needs uniformly applicable to all social and economic categories in all societies.
Relative poverty
This refers to the use of relative standards in both time and place in the assessment of poverty, viewed as an improvement over the concept of absolute standards. In application, relative poverty is based on judgments of members of particular societies, regarding what they see as reasonably acceptable standards of living and styles of livelihoods. The notion of relative poverty is therefore elastic and receptive to conventional and rapid changes. In some cases, people might be viewed as relatively poor because they lack running water, washing machines, modern medical facilities, higher educational institutions such as universities, tourist and holiday facilities, and cars for personal use. Yet, these are luxuries to some sectors of the population.
Acceptable standards are in themselves problematic between inter-societal, ethnic, religious and other social groups. Relatively acceptable standards of life style to slum dwellers are not acceptable to higher residential class area residents. To engage in meaningful comparison of relative poverty, there may be need to differentiate between local, national and international levels of poverty measurement.
Subjective poverty
Closely related to relative poverty, subjective poverty has to do with whether or not individuals or groups actually feel poor. This is because those defined as poor by the standards of the day will probably have low self-esteem, and therefore see themselves as poor.
The poverty debate
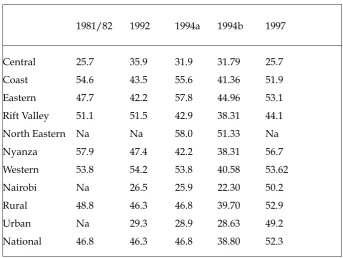
Poverty debate and analysis is understood to incorporate various dimensions. According to OECD (2001), for example, poverty is multidimensional in that it encompasses deprivations that relate to human capabilities, including consumption and food security, health, education, rights, voice, security, dignity and decent work. As such, any poverty reduction efforts should incorporate environmental sustainability and reduced gender inequality, both viewed as integral in any meaningful treatment of poverty. In making proposals for poverty reduction, OECD lays emphasis on sound government policies coherently applied to development, focusing on the key policy areas with strong poverty reduction impacts. The areas in question include debt relief, trade, investment, agriculture, environment, migration, health research, security and arms sales. In the case of Kenya, poverty incidence is said to have increased from 44.8 per cent in 1992 to 45.0 per cent (1994) and to 52.3 in 1997 (Government of Kenya, 2000). The poor in this case experience difficulties in accessing such human capabilities as education and health, which constitute critical aspects of human security, freedom and overall empowerment.
Substantivists among cultural anthropologists and other poverty analysts support the presentation of the relationship between poverty and human security as resulting in social relations that require protection of the affected human beings from abused freedoms. In this case, human security becomes a crucial component in explaining and analyzing different aspects of vulnerabilities and dimensions of poverty in time and space. Therefore, people without socio-economic and politico-civil freedoms cannot access the requisite opportunities and choices for enabling them to escape the poverty trap (UNDP, 2000).
marginal opportunities for peace in such situations, the affected societies lack potential for self-realization and development (Mwagiru, 2000).
Using a gender mainstreaming perspective (the process of ensuring that gender is taken into account in all legislation, policies, processes, practices, and programmes in all areas and at all levels), the African Women’s Development and Communications Network (FEMNET, 2003) advocates incorporation of gender perspectives in poverty analysis. In their view, poverty is multidimensional, encompassing low incomes and consumption, low achievement in education, poor health and nutrition, low asset acquisition and ownership, and other forms of human development. FEMNET takes issue with the traditional conceptualization of poverty in that it tends to concentrate on income poverty as a measure, ignoring other dimensions with immense gender disparities. Here, attention is drawn to the fact that women in Kenya constitute a slightly higher proportion of the total population (50.1%) in comparison to men (49.9%) and that the national poverty rate estimated at 52.3 per cent in 1997, increased to 56.8 per cent by the year 2000. Yet, despite the numerous policies, poverty remains widespread in Kenya, afflicting disproportionately more women than men. The Welfare Monitoring Survey of 1997 (Government of Kenya, 2000) noted that prevalence of poverty among female-headed households was relatively higher than in male-headed households, while still slightly more severe for female-headed households where husbands were away.
Conceptualizing poverty and human security
from want”. Implied here is the need to match freedom from physical and psychological insecurity with freedom from insecurity of livelihoods, and therefore poverty.
Civil society organizations play a crucial role in eradication and prevention of violent conflicts and poverty, leading to increased human security, strengthening of people’s aspirations, and helping to take the concept of human security one notch higher by removing the security debate from its traditional focus on “state security” to encompass issues of well being, livelihoods and overall improvement in people’s lives (Sen, 2002; Mark and Dewit, 2002). The Japanese Ministry of Foreign Affairs looks at poverty and human security using a “protection-empowerment” model, therefore, providing a useful framework for understanding not only conflict prevention and transformation, but also the need for institutions, norms and processes for shielding people from pervasive and critical threats and vulnerabilities. States are therefore challenged to develop “top-down” structures and systems that guarantee the rule of law, accountable and transparent institutions, and protective infrastructures. In initiating and facilitating “bottom-up” systems that give citizens an opportunity to participate in defining their priorities and setting up initiatives to better their lot, states make a key contribution to poverty reduction efforts. We now know that participatory processes for local level development work best in situations where the actors are protected against threats to their lives and resources.
participation, and improvement of the welfare of the poor and vulnerable clearly constituting key policy and development emphasis. This latter position tallies well with the Human Development Report’s definition of poverty as denial of opportunities and choices most basic to human development, which include choice to lead a long, healthy and creative life and enjoy a decent standard of living, freedom, dignity and self-respect (UNDP, 2001). The poverty of choices and opportunities, which focuses on empowerment and actions to enhance opportunities, is referred to as human poverty and captures poverty beyond income and expenditure, as distinguished from poverty of income. Similar parameters in assessing poverty are used in presenting poverty as existing where the basic material needs of an individual or a household are not adequately met, and a poverty line used to distinguish between the poor and non-poor, as the proportion of the population lying below the poverty line is categorized as poor, and the poverty is either absolute or relative.
Qualitative research
Qualitative research is good for social science research/data gathering. Qualitative techniques act as complementary, or even alternatives, to conventional quantitative approaches. Qualitative research enables a researcher to gain empathic understanding of social phenomena, to facilitate recognition of subjective aspects of human behaviour and experiences, and to develop insights into group’s lifestyles and experiences that are meaningful, reasonable and normal to those concerned (e.g. hospital inmates when a researcher gets close to them through qualitative approaches). Below is a presentation of selected key qualitative approaches.
Key informant interviews
Key informants are knowledgeable and other persons strategically positioned to provide specific types of information on particular situations, depending on their status in society or organizational hierarchies, with respect to the purpose of the assessment. They could be experts, with required knowledge on particular issues and situations. The key informants can be carefully identified in the project areas, ensuring gender equity, and in consultation with area representatives.
• Prestige and respect commanded within the community, often taking into account socio-metric networks enjoyed by the individual, and
• Knowledge and willingness to discuss poverty issues with the assessing team.
After the selection, issues of poverty to be presented for analysis and discussion include:
• Definition of poverty and its causes,
• Identification of key behavioural characteristics of the poor, • Impact of poverty,
• Access to resources and trends in the quality of services, and • Explanation of mechanisms used by target communities in coping
with poverty challenges.
In-depth interviews
These are usually undertaken where analysts/researchers have previously studied the situation; for alertness and sensitivity to inconsistencies, and for notes on omissions and problems for clarification. They facilitate collection of in-depth data not otherwise known, advancing deeply into personality structure of target groups (through interviewer guided and discussion-based experiences). Subject characteristics include involvement in particular experiences, and ability to express oneself with liberty.
Participant observation
Narrative interviews
This is the analysis of personal accounts and situations through narratives or free “story telling”. It allows researchers to develop vivid insights into segments of target group’s lives, and it involves life stories with more narrative and less interviewing. There is little interviewing through “question-answer interviews”; facilitator/interviewer is passive but stimulating, friendly, permissive, and not authoritarian.
Case study analysis
This involves selection of a typical case (poverty-stricken in this case) within the study area and using any of the above suitable methods to make a comprehensive analysis of the poverty situation in question. This approach can be good as a prelude to main research, post-research analysis and explanations and supplementary information. It helps gain more insight into structure and process, formulate suitable hypotheses, operationalize research variables, develop suitable research designs, provide more detail explanation, beef up quantitative findings, and help ascertain feasibility of planned studies.
Case study analysis is good for description and evaluation of causality (especially where complex researches are not ideal for survey or experimental study designs). Units of analysis/study include whole units (e.g. community and single unit such as family and household).
Triangulation
As a methodology, this involves application of as many of the above methods as are suitable for the tasks in question.
Participatory poverty assessment methodologies
gathering methodologies, leaving none of the tasks exclusively in the hands of the “experts”. As such, there are no experts.
Participatory approaches simply imply equitable incorporation of the target group representatives in the delivery process, without undue dominance on the part of the facilitators. Participatory analysis or research promotes collaborative action between communities and other target groups with governments, donors and resource persons. It promotes ownership for intervention, promotes collaboration and co-operation between researchers, practitioners and lay people.
Common participatory approaches to poverty assessment, among others, include the following:
Focus Group Discussions (FGDs)
This approach begins with selection of social groups, with specific social category delineation. Participants’ composition is guided by homogeneity, cohesiveness and knowledge of the issues involved. Examples of these groups include: groups of women only; groups of men only; groups of youth (girls or boys only); groups of female elders; and, groups of male elders, among others.
It is important to separate the groups in order to pertinently capture and reflect the views and experiences of particular social categories such as sexes and age-groups, as will be found in given poverty set-ups. Ideal group size is 10, but can vary between 5 and 12. Discussion topics include identification of major problems in the area (e.g. poverty in terms of definition and coping strategies) and proposed solutions.
Timelines
These are lists of key events in the history of the communities or target groups that facilitate identification of the past trends and problems facing the group, focusing more on those related to poverty. Key among these would include droughts, famines, and unpredictable commodity price fluctuations and inflation. Useful timelines for the last 30 years or so in the history of the areas in question could be reconstructed with facilitation of key informants and talented community members.
Trend analysis
These differ from timelines in the sense that they address the key changes that have taken place in the area in question, in relation, for example, to affordability of essential goods and services. Participating group members should also be asked to provide underlying reasons for such variations. This helps in identification of goods and services important to them and how the changes relate to poverty onset, experiences and outcomes.
Gender analysis
This approach can take the form of visuals depicting household properties and roles performed by women and men, such as cultivation, baby care, herding, shoe repair, laundry, carpentry, tailoring, ploughing and house construction. More telling would be ownership visuals depicting farming tools (pangas, jembes, shovels and axes), houses, ornaments, cattle, land, radio, children, money, utensils, cattle and money. The reasons given for different associations and categorization of ownership, use and roles are important for inferences regarding gender differentials in terms of poverty and its impacts.
Social mapping
facilities. The combined visual impacts and analysis tells a lot about poverty presence or absence.
Seasonal calendar
This consists of community or village-based seasonal calendars drawn by the community representatives, indicating seasonal variations on an annual/12 month calendar, with specific reference to poverty or other strongly notable community livelihood features. The seasonal calendars can be used to indicate visual appearances of when the highest and lowest supplies regarding rainfall, certain or all food commodities, incomes, diseases, and other acute problems are/were recorded, followed by poverty-related analysis based on the information extracted from the exercise.
Wealth ranking
This is often based on social mapping, following which households are identified alongside various socio-economic groups. The households or individuals owning them are therefore ranked according to community perceptions of wealth and the lack of it, to identify the rich, poor and the very poor individuals and households.
6 Overall assessment
References
African Women’s Development and Communications network (FEMNET, 2003).
Fiske, D. W. (1 986). “Specificity of Method and Knowledge in Social Sciences” in Galtung, J. (1999) “Cultural Violence”, Journal of Peace Research, Vol. 27, pp291-305.
Mark, A. and Dewit, D. (2002). “CCHS and Human Security.” Human Security Bulletin, Vol. 1. No. 2., July 2002.
Mwagiru, M. (2000). Conflict, Theory, Processes and Institutions of Management. Nairobi: Watermark Printer.
Government of Kenya (2000). Welfare Monitoring Survey 1997. Nairobi: Central Bureau of Stastics.
Government of Kenya (2000). The Interim Poverty Reduction Strategy Paper 2000-2003.
Sadato, O. (2003). Empowering People for Human Security. Payne Lecture, Stanford University, 28th May 2003.
Sen, A. (2002). Basic Education and Human Security. Statement delivered in Kolkata, 2-4 January 2003.
UNDP (2000). Human Development Report. New York: Oxford University Press.
Overview
Persistent poverty has plagued rural Africa for generations and, by some accounts, is becoming more widespread and entrenched. As a consequence, governments and donors have renewed and intensified their commitment to poverty reduction. This is reflected around the continent in poverty reduction strategy papers (PRSPs), efforts at decentralizing public goods and service delivery and the rise of participatory poverty appraisals intended to empower the poor, and a range of other policy changes. In some cases, one can legitimately wonder about the extent to which these reforms are heartfelt, rather than merely rhetorical and political, and the extent to which national and international elites are prepared to make sacrifices to advance an authentic poverty reduction agenda. But as one who has worked on problems of African poverty for two decades now, I feel quite comfortable asserting that there has been a palpable increase in recent years in the attention paid and sincerity surrounding questions of poverty reduction on the part of policy makers and development partners.
3. MIXING QUALITATIVE AND
QUANTITATIVE METHODS IN
ANALYZING POVERTY DYNAMICS
1Christopher B. Barrett Cornell University
Increased attention paid to the blight poverty leaves on society places an onus on researchers to generate relevant, accurate and timely analysis of the nature and causes of persistent poverty. Policy makers and donors need to know who are the poor, how large are their numbers, how deep is their poverty, and where they can be found. These questions have been probed in depth for decades, typically using cross-sectional methods of data collection and analysis. What is new and exciting is the question of poverty dynamics: who among the poor will naturally pull themselves up by their bootstraps and exit poverty; and who will stay poor for a long period—a lifetime or more—unless communities, governments and development partners take appropriate interventions. There seems to be a fundamental difference between short-term deprivation—transitory poverty (where the poor have every expectation of becoming non-poor reasonably soon)—and long-term deprivation (the chronic or persistent poverty that too often brings hopelessness). While any sort of poverty is plainly undesirable, persistent poverty strikes most of us as especially odious. Widespread concern nonetheless falls short of offering a clear and sensible strategy for combating persistent poverty. This requires careful study of the etiology of persistent poverty—its correlates and causes—and rigorous evaluation of alternative means of helping people avoid or escape persistent poverty. This demands rethinking of the methods social scientists deploy in studying poverty.
To be sure, there have been notable advances in recent years in the toolkit analysts use in studying poverty. Economists have made important advances in studying African poverty over the past decade, due in no small part to broad-scale use of the rigorous Foster-Greer-Thorbecke (1984) class of poverty measures, the increasing availability of nationally representative survey data—even panel data offering multiple longitudinal observations on individuals and households and important efforts at disseminating cutting edge analytical methods through the African Economic Research Consortium (AERC) and several leading universities around the continent, including the University of Nairobi. At the same time, social scientists coming from
anthropological and sociological traditions have likewise pushed forward the frontiers of our understanding of poverty, especially through the development, refinement and dissemination of various participatory methods and careful ethnographic and social analysis.
The need for rethinking of methods arises not due to any failure on the part of researchers analyzing poverty to develop their disciplinary toolkits. Rather, the need for some rethinking of methods arises from the complex, multidimensional nature of the concept of poverty itself. Poverty reflects at once (i) resource insufficiency, commonly manifest in low incomes and expenditures, (ii) vulnerability to adverse shocks such as illness, violence and loss of livelihood, and (iii) powerlessness in the political, social and economic life of one’s community and country (World Bank, 2001). No single measure, no matter how cleverly designed nor carefully measured, could ever provide an encompassing treatment of so complex a concept.
As a result, all the different measures and methods we presently use are flawed, even when practised skilfully. Consider, for example, some of the flaws of the metrics economists commonly use. Household expenditures increase with purchases of alcohol, firearms and tobacco and with the need to pay for medical treatment for ill or injured family members or for reconstruction of homes damaged in civil unrest or natural disasters. Since we commonly interpret higher expenditures to reflect a higher level of well-being, expenditures are vulnerable to increased payments for “bads” rather than “goods”. Similarly, income measures of well-being can rise as people substitute work for leisure in response to increased stress, a phenomenon I previously termed “immiserized growth” (Barrett, 1998). Yet because longer hours worked translate into higher income, our conventional inference that higher incomes means superior welfare runs afoul of reality. One could similarly critique qualitative methods used by non-economists. And there has indeed been much inter-disciplinary sniping over the years about the shortcomings of different methods.
Therefore, there exists some inherent complementarity between qualitative and quantitative methods. The situation is rather like the parable of the blind men and the elephant. One, holding the trunk believed the beast to be a mammoth python, while another, touching an enormous leg, thought it a tree, and a third, feeling the thick hide of the animal’s torso, was sure he had hold of a rhinoceros. Each had discovered an important but incomplete truth. Without sharing their findings, they could never divine the majesty of the complex beast, the elephant. So too must we learn how to integrate methods in field-based research—what Kanbur (2003) terms “simultaneous mixing”—or to iterate between methods—“sequential mixing”—so as to significantly improve the quality of our analyses of poverty, perhaps especially poverty dynamics.
This paper outlines my current thinking and recent experience in mixing qualitative and quantitative methods of data collection and analysis so as to gain a firmer and more useful understanding of poverty dynamics, especially in rural Kenya. The next section explores the very real differences between qualitative and quantitative poverty analysis methods. These differences make them useful complements. Then I briefly discuss key lessons I have learned from four multi-year research projects in Kenya, in which I have tried to implement mixed qualitative and quantitative research methods with a range of colleagues from animal science, anthropology, economics, geography, range science, sociology and soil science.
Real and false differences
Qualitative and quantitative methods differ in important ways, but one must be careful to identify precisely the dimensions of those differences. My contention is that the differences between qualitative and quantitative methods are commonly misunderstood and that this misunderstanding impedes fruitful mixing of methods.
So what are the important dimensions of difference between the methods? Kanbur (2003) goes into this issue in far greater detail than I have space for here. But let me emphasize four key differences between qualitative and quantitative methods.
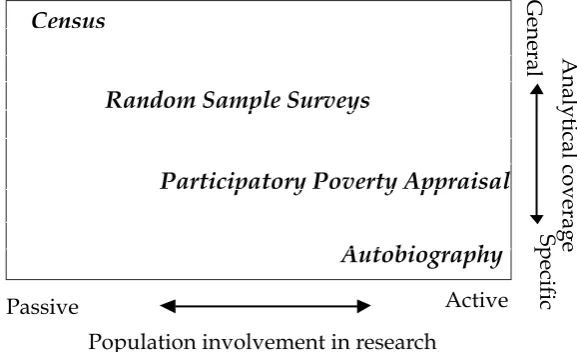
to general coverage on one axis and from passive to active population involvement in the research on the other axis, as depicted in Figure 3.1. Qualitative autobiography would occupy one corner (specific/active) of that box, a quantitative census the opposite corner (general/passive), with considerable opportunity for creative combination of qualitative and quantitative methods in between. Where one locates one’s work within that grid ought to depend upon the objectives of the research, the nature of the subjects, and the human and financial resources available to do the job.
The second dimension along which important differences arise concerns the type of data one collects. There exist three basic data types: (i) categorical data, including such data as identifying characteristics (e.g. gender, race, religion, clan, ethnicity), explanations and histories, can be distinguished from (ii) ordinal data—have things improved, stayed the same or gotten worse? What are your greatest fears for which a clear ordering exists among categories but there is no measurable “distance” between categories, and (iii) cardinal data (e.g. incomes in monetary units, children’s weight or height measures) for which numeric ratios and intervals hold precise meaning. Note that the difference is not between the numeric and the non-numeric. Categorical and ordinal variables can be given numeric representation. Quantitatively-minded social scientists do this all the time using dummy variables. But those of us who like to use relatively more
Passive Active
G
eneral
Sp
ec
ific
A
naly
tic
al c
ov
erag
e
Population involvement in research
Figure 3.1: Differences according to data collection method
Census
Random Sample Surveys
Participatory Poverty Appraisal
sophisticated econometric techniques in analysis tend to depend more heavily on cardinal data.
The third dimension of important difference concerns the method of analysis one applies to data of whatever sort, collected by whichever means. The deductive tradition of economics differs markedly from the inductive tradition of anthropology. This difference is of course closely related to the specific-general data collection methods distinction drawn earlier, for one tends to collect data according to the analytical methods one plans to employ later. Where the general-to-specific deductive approach most economists follow emphasizes the universally applicable signal in a given data set and has desire aggregability properties, the specific-to-general, inductive approach followed by most ethnographers and historians allows for fresh insights and honours the idiosyncratic elements of any given person or community’s experience. Finally, and closely related to the preceding three differences, quantitative analysts commonly rely on deductive methods and general, random sampling to be able to speak to larger-scale decision-making units: national governments and international donors. Policy-oriented poverty economists like to try to capture “the big picture” and attempt to “speak truth to power”. Qualitatively-oriented researchers, meanwhile, are far more likely to be concerned about returning research findings directly to the population under study and to using the research experience to empower the poor directly, rather than trusting that policy changes on high might filter down to improve the lot of the poor within a reasonable period of time. The ultimate audience for research therefore commonly differs somewhat between poverty researchers from the qualitative and quantitative traditions. Of course, this also helps account for the primacy of economic analysis in high-level policy debates about poverty and the striking under-representation of good qualitative analysis in those forums.
qualitative nor quantitative methods can defensibly claim ethical superiority over the other). There is much good and bad practice on both sides.
Nor is one approach necessarily more contextual than another. Quantitative researchers can probe extensively as to the history and genesis of current conditions. I already took issue with the mistaken perception that “qualitative” research is inherently non-numerical. The best social analysis uses numbers to reflect inherently cardinal concepts, whether or not it uses statistical methods to make inferences about key hypotheses. Finally, and relatedly, math does not equal rigor. It is erroneous, yet I believe a common hubris of economists that analyses based on careful statistical methods are somehow more “rigorous” than equally careful textual, historical or ethnographic analysis.
In short, bad practice is bad practice, whatever the method. There is no unconditional superiority of one class of methods, be they qualitative or quantitative, over another. Rather, the germane questions appear to be:
• When and how is good practice within a given class of methods still wanting?
• Does another class of methods, well applied, fill in the blanks? and • How can one method validate the findings of another?
these are inherently quantitative pursuits. It is equally true that “power” is a terribly elusive concept to operationalize quantitatively and therefore studies of power relations and how individuals and communities organize politically to meet their basic needs and to advance their economic interests are best done qualitatively. Just because it is feasible to mix methods and desirable to do so in many circumstances does not mean that bread-and-butter disciplinary methods are outdated. Indeed, they are the bedrock of mixed methods of poverty analysis.
Examples from research in rural Kenya
For the remainder of this paper, I wish to share with you some of the lessons I have learned about mixing methods from four ongoing, multi-year collaborative research projects funded by the US government, three by the United States Agency for International Development (USAID) and one by our National Science Foundation. The results from these projects remain preliminary at this point, so I do not focus on core research findings so much as on the process sequential or simultaneous mixing of qualitative and quantitative research methods.
The PARIMA Project
The Pastoral Risk Management (PARIMA) project, funded by the Global Livestock Collaborative Research Support Program (GL CRSP), operates in southern Ethiopia and northern Kenya. It is an interdisciplinary project with four lead investigators drawn from four separate academic fields (anthropology, economics, range science and sociology) and a variety of local and external collaborators across several disciplines. The project began in 1997 and is presently funded through 2006. PARIMA set out to improve understanding of the etiology of vulnerability among pastoralists in arid and semi-arid lands (ASAL) of East Africa and, derivatively, what sorts of policies, projects and technologies might best reduce that vulnerability.
opportunities and vulnerability, and on interactions among these. In complex adaptive systems such as East African pastoralism, vulnerability can lead to sudden shifts in the opportunities faced by individuals, households or communities and, reciprocally, new opportunities can fundamentally reshape the risks these peoples face. Indeed, through multiple research methods the project has begun to uncover, if not yet fully explain, the stochastic poverty traps that appear to characterize these systems (Barrett and McPeak, 2003; Barrett et al., forthcoming; Lybbert et al., 2004; McPeak and Barrett, 2001).
PARIMA has employed what Kanbur (2003) terms “simultaneous mixing” or “Bayesian integration”, in which we follow an iterative approach, using one method to inform another, then back to the first, etc, keeping multiple methods interactive throughout the research process to update researchers’ priors continuously. We have found that this built-in feedback loop yields a reasonably homeostatic (i.e. self-regulating) research mechanism that keeps pushing us towards our research objective and prevents us from drifting far from relevant or rigorous findings.
The feedback loop depends fundamentally on multi-faceted integration of qualitative and quantitative methods to ask and answer several generic questions:
(1) What does it mean to be poor or vulnerable in this setting? How does this vary across individuals, households, and communities and over time? (i.e., are we asking the right questions of the right people at the right time?)
(2) Derivative from 1), are we measuring the correct variables and in the right manner? (i.e., which data collection method and what data type(s) best fit the question(s) at hand?)
(3) Is our inference of the qualitative and quantitative data on those variables consistent (a) across research methods (a test of robustness) and (b) with local expressions of understanding of the problem(s) (a test of relevance)?
Procedurally, this qualitative-quantitative integration has taken place roughly as follows:
“sampling” in the dictionary. Based on our experiences, I believe that sequencing generally ought to apply in the field, as well. Start by reviewing the relevant ethnographies of the area so as to be able to interpret well the products of participatory methods, then use the tools of survey-based data analysis to explore more precisely hypotheses that emerge from the participatory rural appraisal (PRA) exercises.
We, therefore, began analysis on the basis of ethnographic and participatory rural appraisal (PRA) qualitative data to draw out patterns and explanations from a relatively small sample of non-representative respondents. This helped to clarify oft-misunderstood dynamics, for example with respect to the driving factors behind diversification out of pastoralism (Little et al., 2001), the role of ethnometeorological practitioners in providing climate forecasts in pastoral communities (Luseno et al., 2003), or the absence of classical tragedy of the commons effects in southern Ethiopian rangelands (Lybbert et al., 2004), and to identify issues we had not sufficiently emphasized before, such as human health (Smith et al., 2000). We then presented these findings, our assessments of the extant literatures, and a draft Phase II, survey-led research design to a workshop of largely external stakeholders (donors, local and national governments, NGOs, and local researchers) for their feedback and some on-the-spot revision and re-presentation by our team, with further feedback. For the past four years we have therefore been following up the initial qualitative work with collection and preliminary analysis of quantitative data generated by repeated quarterly surveys among almost 750 individuals in 330 households across 11 sites in southern Ethiopia and northern Kenya. We have used this method effectively to explore whether pastoralists use and might benefit from modern climate forecasting techniques (Luseno et al., 2003, Lybbert et al., 2003), what constrains poor pastoralists from making better use of livestock marketing channels (Barrett et al., 2003; Barrett and Luseno, 2004; Osterloh et al., 2003).
why pastoralists’ sales of livestock are typically weakly responsive to changing market or ecological conditions—and a natural adaptation to the market problem, where breeding stock are largely unavailable for purchase, so communities tie others’ hands to prevent the export of fertile heifers. Similarly, our questionnaires integrate open-ended questions that are designed to explore matters tough to frame precisely through traditional survey instruments (e.g. historical perceptions, indigenous climate forecasting methods).
And we simultaneously pursue studies of livestock marketing through quantitative analysis of price data and household and market-level surveys of transactions data and through intensive participant observation and interviewing of traders so as to understand the social relationships that underpin trader networks. I have found that this ongoing, creative tension between qualitative and quantitative methods helps illuminate both key findings that hold up across disciplinary research traditions and findings that, while interesting, appear fragile and therefore a risky foundation for policy prescription.
Moreover, the research is intended to be integrated with the project’s outreach activities, which include community-level participatory identification of priority needs so as to help spark pilot activities to be accompanied by qualitative action research. We try to follow the traditions of bidirectional research-extension linkages, in which findings flow both from practitioners to researchers and vice versa. We use quantitative evidence derived from past survey rounds to inform focus group and community discussions, returning research findings directly to studied communities. It helps to have the subject groups themselves engaged in attempting reconciliation and explanation of data from different sources and methods. Reconciling individual and group level responses is not always simple. Individuals may either deceive or speak more frankly in private, so one can never really be sure whether privately or publicly collected data offer more reliable representations of elusive truths, and therefore the value of mixing methods and the forums from which we derive data and analyses.
Let me offer a specific example of a mixed qualitative-quantitative tool that has proved quite useful (Smith et al., 2000, 2001). Our team
then subsequently constructed a simple (pseudo-cardinal) index. Having georeferenced all the points using a handheld global positioning system (GPS) unit, the geographer on our team could construct contour maps of risk assessment, polygonal maps of ethnic territories, and link these to extant biophysical data (e.g. rainfall), permitting quite useful and original spatial analysis. For example, we found that perceived vulnerability to drought is positively correlated with mean rainfall because of the differential mobility associated with various chosen activities. This led to a more fundamental, if not entirely original, insight that vulnerability to specific forms of risk is endogenous even when the biophysical shock itself (e.g. low rainfall) is exogenous. We could then also analyze the data using limited dependent variable econometric methods, using the ethnographic notes from the original focus group interviews to provide causal explanations of the observed statistical correlations. This process uncovered important structural patterns of heterogeneous risk assessment between men and women, rich and poor, Ethiopia and Kenya, pastoralists near and far from towns, etc. Since rangelands policies have historically treated pastoralists as a homogeneous population, this analysis has revealed unintended distributional and targeting effects of past policies (e.g. borehole development, and pasture improvement). Of course, the lingering questions from the first round of work concerned the representativeness of risk assessments by purposively selected groups and the intertemporal stability of risk assessments. We therefore built the participatory risk assessment instrument into individual-level questionnaires fielded every three months over the course of two years so as to track more micro-level and temporal variation in risk assessment and to match randomly sampled individuals’ ex-ante risk assessment to their ex post experiences of shocks. We are now analyzing those data and should have results to share within a few months.
The BASIS CRSP Project