DATABASE ORGANISATION IN A WEB-ENABLED FREE AND OPEN-SOURCE
SOFTWARE (FOSS) ENVIRONMENT FOR SPATIO-TEMPORAL LANDSLIDE
MODELLING
Iswar Das a, *, Kapil Oberai a, Partha Sarathi Roy a
a
Indian Institute of Remote Sensing, 4-Kalidas Road, Dehradun, India - (icdas, kapil, psr)@iirs.gov.in
Working Group, Theme or Special Session: IV/5, IV/1, II/IV, IV/8, IV/3: Free and Open Source Web Mapping and Processing
KEY WORDS: Free and open source software’s (FOSS), landslide, susceptibility, Web-GIS, PostgreSQL, PostGIS, India
ABSTRACT:
Landslides exhibit themselves in different mass movement processes and are considered among the most complex natural hazards occurring on the earth surface. Making landslide database available online via WWW (World Wide Web) promotes the spreading and reaching out of the landslide information to all the stakeholders. The aim of this research is to present a comprehensive database for generating landslide hazard scenario with the help of available historic records of landslides and geo-environmental factors and make them available over the Web using geospatial Free & Open Source Software (FOSS). FOSS reduces the cost of the project drastically as proprietary software’s are very costly. Landslide data generated for the period 1982 to 2009 were compiled along the national highway road corridor in Indian Himalayas. All the geo-environmental datasets along with the landslide susceptibility map were served through WEBGIS client interface. Open source University of Minnesota (UMN) mapserver was used as GIS server software for developing web enabled landslide geospatial database. PHP/Mapscript server-side application serve as a front-end application and PostgreSQL with PostGIS extension serve as a backend application for the web enabled landslide spatio-temporal databases. This dynamic virtual visualization process through a web platform brings an insight into the understanding of the landslides and the resulting damage closer to the affected people and user community. The landslide susceptibility dataset is also made available as an Open Geospatial Consortium (OGC) Web Feature Service (WFS) which can be accessed through any OGC compliant open source or proprietary GIS Software.
1. INTRODUCTION
Landslides are the movement of a mass of rock, debris or soil along a downward slope, due to gravitational pull. Landslides exhibit themselves in different mass movement processes and are considered among the most complex natural hazards occurring on the earth surface. This makes it difficult – if not impossible – to define a single methodology to identify and map landslides, to ascertain landslide hazards, and to evaluate the associated risk (Guzzetti et al., 2005). The assessment of landslide hazard has become an important assignment for various interest groups comprising technocrats, planners and others mainly due to an increased awareness of the socio-economic significance of landslides (Devoli et al., 2007). For any kind of landslide study a correct landslide database is the pre-requisite (Varnes, 1984).
Over the past years researchers have developed free and open source software for various GIS applications, resulting in the creation of number of sophisticated GIS software projects, ranging from spatial database management system to store geographic data (e.g. PostGIS), desktop GIS for data editing and analysis e.g.; Quantum GIS (QGIS), Geographic Resources Analysis Support System (GRASS) etc. and Internet map server applications e.g. the Mapserver project. The term “open source software” means that the source code is free and openly distributed for non-commercial purposes (mostly under GNU license); easily accessible, the code can be modified and/or extended for the purposes of benefiting the researchers, academics and other end users. In addition, the FOSS reduces the cost of the project drastically as proprietary software’s are very costly. It also prevents vendor lock in as user with some
programming background can also enhance the software and again give it back to community so the software grows further which in turn benefits other potential users. Also there is no restriction on the number of installation of the software and may be used for either personal or business purposes without licensing terms (Steiniger and Bocher, 2009).Within the earth sciences, the FOSS has been used for landscape ecology (Steiniger and Hay, 2009), environmental modelling and management (Jolma et al., 2008), water resources management (Chen et al., 2010), archaeological studies (Brovelli and Magni, 2003; M. A. Brovelli ), natural resources management (Roppola and Bugg, 2004) and health (Moreno-Sanchez et al., 2007). Making landslide database online via WWW (World Wide Web) promotes the spreading and reaching out of the landslide information to all the stakeholders. Keeping this in mind the aim of this research is to present a comprehensive database for landslide hazard scenario with the help of available historic records of landslides and geo-environmental factors and make them available over the web using FOSS geospatial software’s. The digitalization of landslide spatial locations is done using the Open Source Quantum GIS software and the integration of the landslide attributes are done in spatially enabled open source PostgreSQL database and finally these results were made available over the web using open source UMN Mapserver. Landslide data for last 28 years (1982 to 2009) were compiled along the national highway road corridor in Indian Himalayas. All the databases along with the landslide susceptibility map were served through WEBGIS interface. This dynamic virtual visualization process through a web platform brings an insight into the understanding of the landslides and the resulting damage closer to the affected people and user community. This research is unique in ways that not many applications have been created that are using open source tools for such kind of studies ISPRS Annals of the Photogrammetry, Remote Sensing and Spatial Information Sciences, Volume I-4, 2012
especially related to landslides and all the tasks involved in the project used open source tools right from creating datasets to putting it on the web. Above all the landslide susceptibility layer is made available as OGC complaint WFS service which provides the dataset as GML (Geographic Markup Language) which could be consumed by any OGC complaint desktop or web enabled applications and used for further processing. This is unlike the OGC WMS service wherein user gets only a snapshot of data in the form of an image (png, jpg etc).
2. STUDY REGION: PART OF NATIONAL HIGHWAY CORRIDOR IN THE UTTARAKHAND HIMALAYAS
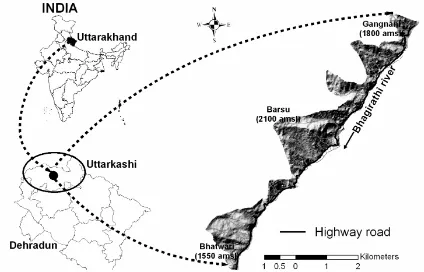
The study area lies between 300 47’ 29”N and 300 54’ 45” N latitude and 780 37’ 41”E and 78044’03”E longitude in the northern Himalayas, India in the catchment of the river Bhagirathi, a tributary of the river Ganges (Fig. 1). The area is traversed by a national highway corridor leading to the famous Gangotri shrine of India in the interior Himalaya (Agarwal and Kumar, 1973). The study area of a 12 km long road corridor is prone to landslides during rainy months. The last three decades of rainfall information between 1982 to 2009 show that the highest (1900 mm) and lowest (600 mm) annual rainfall occurred in years 2003 and 1991, respectively, with an annual average of approx. 1200 mm.(Vinod Kumar et al., 2008). The area receives heavy precipitation during the summer months starting from mid of June to mid of October and moderate rainfall during the winter months from January to March. In the Himalayan region, landslides are recurring annually and are prominent during the summer months between June and October when the seasonal monsoon occurs. Landslides in this area are the result of a combination of geotectonics, adverse natural topography, such as steep slopes, weathered rocks and soils, human influences on the topography and high rainfall (Choubey and Ramola, 1997; Saha et al., 2005).
Figure 1. Location map of study area along the National Highway corridor of NH-108 between Bhatwari and Gangnani
3. GIS AND DATABASE MANAGEMENT SYSTEM
3.1 Landslide Database Generation
A combination of various sources, means and methods have been suggested for landslide inventory mapping, as no single best method for landslide inventorization exists (Galli et al., 2008; van Westen et al., 2008). A detailed landslide inventory for susceptibility assessment requires mainly the following data inputs: the location of a landslide, its frequency, cause of the landslide and type. For the precise landslide identification, accurate landslide mapping and collection of landslide data from reliable sources plays an important role. The major
organizations which keep the updated record of landslides in the Indian Himalayan terrain are the Border Road Organization (BRO) and the Geological Survey of India (GSI). The landslide records of BRO compiled between 1982 and 2009 were used in this study for preparing the inventory. Extensive field verification was carried out in consultation with BRO to map the landslides in the study area. A total of 178 active landslides were mapped at 1:10,000 scale, which were correlated with BRO records for the road corridor occurring along the cut slopes, as well as in the natural slopes of the road corridor. Slide events along these active sites were reported 332 times in the last 28 years in the BRO records, with a maximum of 60 occurrences in 1994. Open source Quantum GIS was exhaustibly used to correlate the temporal information associated with each slide and adding several other attributes related to the dimension, type, state of activity of the slides. After creation of the shape file for landslides the attributes were added. Attributes like position of landslide, slide id, activity, slide type, and number of occurrences are given according to the data collected during pre-field institutional survey and field survey session. The landslides were characterized according to their types of movements, the materials involved and the states or activities of failed slopes (Cruden and Varnes, 1996). The materials found in majority of landslides are a mixture of rocks, pebbles, gravels and cobbles (Fig. 2). Landslide bodies were mapped from crown to toe of rupture, as the detachment zones (zone of depletion) are the true susceptible areas, leaving aside the runout zones. We described landslide types according to Cruden and Varnes (Cruden and Varnes, 1996). Annual summer monsoon in the area during June to September brings out number of fresh as well as reactivated landslides. Change of water level in the main stream, Bhagirathi river, influences toe cutting resulting in few landslides in the road corridor. Landslides on the cut slopes of the road corridor are smaller in size but occur frequently. Record of every landslide affecting the road corridor enters into the log book of BRO record. The mapped landslides cover an area of 0.45 km2, corresponding to 5.6% of the total area (min. 125 m2, max. 40500 m2 and mean 3967 m2).
Figure 2. Photograph of a active landslide in the study area damaging number of houses, part of the road, agriculture land
and infrastructure (14 August, 2010)
3.2 Geo-environmental Factor Map Generation
Efforts were made to carry out a detail mapping of the study area using satellite images and multiple field surveys to ascertain the nature of terrain and the factors that influence landsliding. This is because the geo-environmental factors influencing landsliding are not uniform through out the world. ISPRS Annals of the Photogrammetry, Remote Sensing and Spatial Information Sciences, Volume I-4, 2012
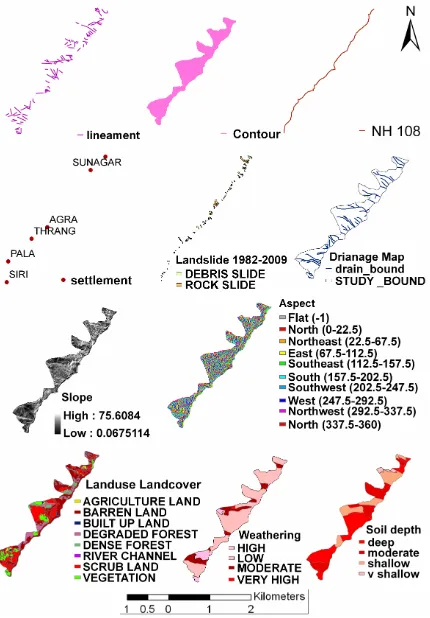
The general consensus is that any geo-environmental variable should have a logical, rational and technical bearing on the landslides in a particular area (Ayalew and Yamagishi, 2005). In the present study we considered ten landslide influencing geo-environmental factors: lithology, slope gradient, aspect, lineament density, drainage density, weathering, geomorphology, road buffer, soil depth and land cover which may affect the occurrence of landslides (Fig.3 (a) and 3(b)). Each factor is divided into possible number of discrete classes that are likely to affect landslide occurrence.
Figure 3(a). GIS database layers of geo-environmental factors like Lineament, Contour, NH 108, Settlement, Landslide, Drainage, Slope, Aspect, Landuse & Landcover, Weathering
and Soil Depth that control landslides
Figure 3(b). GIS database layers of geo-environmental factors like Geomorphology, Lithology and Landslide Susceptibility
map that control landslides
Geotechnical investigations were carried out in the area using slope stability probability classification (SSPC) method (Das et al., 2010). The entire road stretch of 12 km was divided into 32
slope sections and the geotechnical data were collected quantitatively for determining the rock mass parameters required in SSPC system (Das et al., 2010). Rock mass properties such as intact rock strength (IRS), discontinuity spacing and condition, were tabulated in the field. Gneisses constitute 87% of the total study area. A detail observation showed that IRS is higher in migmatite and biotite gneisses in comparison to the calc-silicate and augen gneisses. This may be because of the spacing and orientation of the joints present in these rocks and the degree of weathering. Rocks are jointed and four sets of joints are present in the gneisses with dominant dip directions in 30°, 120°, 140° and 210° from north. Six measurements each were taken in the schists and quartzite areas. The quartzites, white to buff grey/green in colour is thinly to thickly bedded and contains three to five sets of joints (Das et al., 2010). IRS varies between 50-150 MPa and the cohesion is between 15 to 27 KPa. Similarly in schists, IRS varies between 10-100 MPa with the cohesion between 10-20 KPa. Landslide incidences are higher in these rocks except pure quartzites. Terrain parameters were derived from a Cartosat-1 DEM obtained from Indian Institute of Remote Sensing, as part of earlier conducted study. Slope and aspect maps were derived from DEM using GRASS software. The slope angle was divided into six classes of categorical variables i.e. 0–15°, >15°–25°, >25°–35°, >35°–45°, >45°–60° and >60°. It may be argued that the slope can be considered as a continuous variable rather than a six class categorical variable. However in the steep slopes of northern Himalayan road corridor with a complete set of landslides records sufficient knowledge have been gained for optimally classifying the slope conditions. In addition logistic regression model is capable of handling categorical data effectively. We computed the landslide density for each of this class. The slope class >35°-45° had the highest landslide density of 42.67% in the study area. Areas with slope angle between 0-15° had very little landslides in the area. Steep slope areas (>60°) had moderate density of landslides (11.25%). Landslide density analysis in different aspect classes brought out clearly the importance of sun-facing southern slopes that are devoid of vegetation or scantily vegetated, resulting in rapid mass wasting on moderate to steep slopes. The highest density of landslide was observed in southern aspect followed by south-west aspect. Road construction in hilly areas severely alters the slope stability making them prone to slope instability and landslide (Chakraborty and Anbalagan, 2008). The best way to include the effect of a road section in a slope stability study is to make a buffer around them (Ayalew and Yamagishi, 2005; Larsen and Parks, 1997). All slope cuttings due to road construction were mapped using satellite data and field investigation. A road buffer of 50 m was placed around the centre of road that likely influences slope stability. This was guided by our observation that slope alteration due to road construction does not go beyond approximately 50 m on both side of the road as width of the road was very narrow (approx. 7m). Other topographic parameters were derived using ground surveys and interpretation of multi-temporal satellite images as enumerated in (Das et al., 2010).
3.3 WebGIS Application Creation Procedure
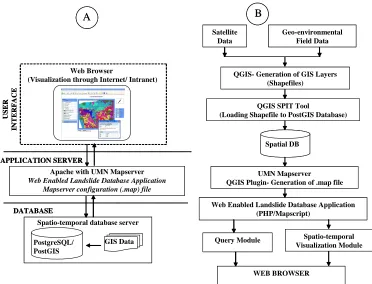
The web enabled landslide database application follows the three tier client/server architecture consisting of three tiers; user interface, application tier and database tier as depicted in Fig. 4A. Open source UMN mapserver was used as GIS server software for developing web enabled landslide database web mapping application with PHP/Mapscript server-side ISPRS Annals of the Photogrammetry, Remote Sensing and Spatial Information Sciences, Volume I-4, 2012
APPLICATION SERVER
Figure 4. System architecture (A) and Methodology (B) followed in the present study for the development of web enabled landslide database web application
application serving as a front-end. Mapserver for windows (MS4W) was used as installer for setting up UMN Mapserver on the Microsoft windows 2003 standard edition platform with apache 2.x as an HTTP server (www.maptools.org/ms4w). The client-tier gets input from the user and displays the final output. It consists of the Maps, Line-chart with embedded JavaScript and HTML PostgreSQL with PostGIS extension serves as a backend spatio-temporal database. Quantum GIS SPIT (import shapefile to PostgreSQL) plug-in was used for loading the various geo-environmental data layers into spatially enabled PostgreSQL which can be visualized through web browser (thin client). The “mapfile” is the main configuration file for the UMN mapserver. It stores details like projection, metadata, connection type (shapefile, PostGIS, raster etc), scale symbology etc about all the different geospatial datasets participating in a project. In this paper Quantum GIS mapserver export plug-in was used for the creation of the mapfile. The detail methodology is explained in Fig. 4B.
4. RESULTS AND DISCUSSIONS
The development of WebGIS on a scientific platform allows integration of data from various sources, means and methods that represents a natural answer to the growing request for dissemination and use of geographic information data. In several field of disaster management such as earthquake, tsunami, cyclone and floods WEB GIS platform is effectively used to disseminate information to the general users and the practitioners. The data type ranges from the base data generation to ground information and modelling outputs. Landslide being a relatively less conspicuous event in comparison to the other hazards, the web-based information dissemination is in its primitive stage. Few authors like (Li et al., 2010) and (Salvati et al., 2009) have shown the utility of WEBGIS in disseminating information on landslide. This
research resulted in the demonstration of a comprehensive database for landslide hazard mapping with the help of available historic landslide records and geo-environmental variables. Historical data can improve the knowledge of landslide process, the date of occurrence, location and magnitude; can give social, economic, and environmental information. Due to various reasons and causes many times historical data are hard to find and it is very conspicuous in developing countries as it is difficult to maintain a systematic chronicle of such records. Records of damage information along with the geo-environmental factors causing landslide brings an insight into the understanding of the earth process that control landslide as well as displaying it through web platform takes it closer to the affected people and user community. The web enabled landslide database application has two main modules namely query and visualization module. By enabling the query option and clicking on the map, user can post queries to the backend spatial database and retrieve results as shown in Fig. 5.
Figure 5. Landslide susceptibility map and contour information displayed on a web browser
The resultant susceptibility map is categorised into 10 classes for visualization with grid code 1-10 representing probability classes between 0.0 to 1.0. The user through the visualization module can browse and interact with the various geo-environmental layers (like lithology, geomorphology, landuse/landcover etc) using the zoom in, zoom out and pan tools available on the right hand-side of the application. User can also toggle the various layers on and off by clicking on the respective checkboxes given under the legend section. For each respective layer selected by the user the dynamic query window shows the combination of all the related attribute details fetched from the spatially enabled PostgreSQL database (Fig. 6).
Figure 6. Dynamic web enabled Query window showing various geoenvironmental layersfetched from spatiallyenabled
PostgreSQL database
The thirteen geo-environmental factor maps used in this study can be displayed interactively using the query module. That helps understanding the causal factors of landslides in that particular area. Thus, it provides an opportunity to the users to know not only the susceptibility potential of a particular area but also the related causal factors that contribute to landsliding. Through the query module user can also visualize a graphical representation of the frequency of landslide occurrences from 1982 to 2009 as depicted in Fig. 7. This helps the user to derive information about the temporal occurrences of landslides in the road corridor.
Figure 7. Frequency of occurrence of landslide in the national highway road corridor generated using open source spice chart
applet (http://sourceforge.net/projects/javacharts)
In the present study, temporal landslide records of 28 years gave a trend of landslide occurrence during entire year and more precisely during the rainy months. Multiple landslide occurrences were recorded. This helps understanding the landslide occurrence pattern in temporal domain. Various geo-environmental factors created in the database combined to
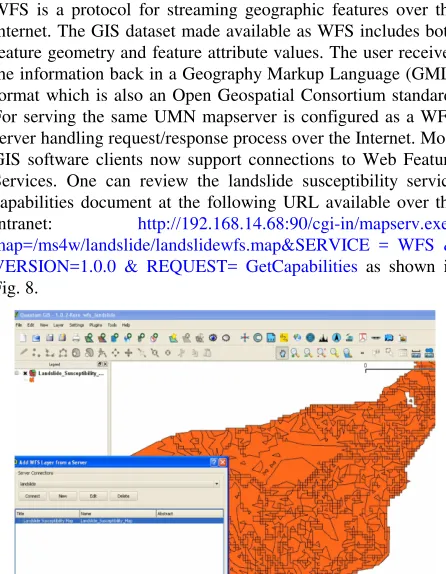
reflect the spatial occurrence and incidence patterns. The landslide susceptibility dataset is also made available as an Open Geospatial Consortium's (OGC) Web Feature Service (WFS) Service. WFS allow users to make queries and retrieve the datasets residing at the server end without the need for making provision for local storage of those features. The OGC WFS is a protocol for streaming geographic features over the internet. The GIS dataset made available as WFS includes both feature geometry and feature attribute values. The user receives the information back in a Geography Markup Language (GML) format which is also an Open Geospatial Consortium standard. For serving the same UMN mapserver is configured as a WFS server handling request/response process over the Internet. Most GIS software clients now support connections to Web Feature Services. One can review the landslide susceptibility service capabilities document at the following URL available over the Intranet: http://192.168.14.68:90/cgi-in/mapserv.exe? map=/ms4w/landslide/landslidewfs.map&SERVICE = WFS & VERSION=1.0.0 & REQUEST= GetCapabilities as shown in Fig. 8.
Figure 8. WFS service of Landslide susceptibility dataset consumed by open source Quantum GIS software
5. CONCLUSIONS
The systematic analysis of historical landslide information brought out the hazard characteristics of the national highway corridor precisely. The sharing of information through open source mapserver can be of help to various interest groups working/intend to work in the field of landslide. The WebGIS technology helps to show the area historically affected by landslide as well as the type of geoenvironmetal variables responsible for landsliding events. The web enabled landslide database application can be easily accessed over IIRS intranet and it is planned to host it on the net to cater to large audience worldwide. The extensive database generated for the preparation of susceptibility map combined through robust modelling technique is displayed in totality to bring out the best possible output of the susceptibility zonation. However, the quality of output of statistical models depends on the quality of the input data sets. Therefore it is essential that the output of the model keeps pace with a priori knowledge for consistency. Using Open Source tools does have some drawbacks like using these tools doesn’t means that there will be no cost factor. Just like there is a training cost involved in learning proprietary software’s, learning FOSS software’s also requires training cost. The installation of FOSS software’s requires specific know-how and for some of these tools very limited documentation is available (Steiniger and Bocher, 2009). Another drawback is the lack of support for such software’s, so a user has to depend on ISPRS Annals of the Photogrammetry, Remote Sensing and Spatial Information Sciences, Volume I-4, 2012
the project community for the resolution of their queries which generally depends on the maturity of the concerned project.
6. REFERENCES
Agarwal, N.C. and Kumar, G., 1973. Geology of the upper Bhagirathi and Yamuna valleys, Uttarkashi district, Kumaun Himalaya. Himalayan Geology, 3: 2-23.
Ayalew, L. and Yamagishi, H., 2005. The application of GIS-based logistic regression for landslide susceptibility mapping in the Kakuda-Yahiko Mountains, Central Japan. Geomorphology, 65: 15-31.
Brovelli, M.A. and Magni, D., 2003. An archaeological Web GIS application based on Mapserver and PostGIS. The International Archives of the Photogrammetry, Remote Sensing and Spatial Information Sciences, XXXIV: part5/W12.
Chakraborty, D. and Anbalagan, R., 2008. Landslide Hazard Evaluation of Road Cut Slopes Along Uttarkashi-Bhatwari Road, Uttaranchal Himalaya. Journal of Geological Society of India, 71: 115-124.
Chen, D., Shams, S., Carmona-Moreno, C. and Leone, A., 2010. Assessment of open source GIS software for water resources management in developing countries. Journal of Hydro-environment Research, 4(3): 253-264.
Choubey, V.M. and Ramola, R.C., 1997. Correlation between geology and radon levels in groundwater, soil and indoor air in Bhilangana Valley, Garhwal Himalaya, India. Environmental Geology, 32: 258-262.
Cruden, D. and Varnes, D.J., 1996. Landslide types and processes. In: A.K. Turner and R.L. Schuster (Editors), Landslides Investigation and Mitigation. Special Report 247. Transportation Research Board, National Academy of Sciences, Washington, DC, pp. 36-75.
Das, I., Sahoo, S., Van Westen, C.J., Stein, A. and Hack, R., 2010. Landslide susceptibility assessment using logistic regression and its comparision with a rock mass classification system, along a road section in the northern Himalayas (India). Geomorphology, 114: 627-637.
Devoli, G., Morales, A. and Hoeg, K., 2007. Historical landslides in Nicaragua—collection and analysis of data. Landslides, 4(1): 5-18.
Galli, M., Ardizzone, F., Cardinali, M., Guzzetti, F. and Reichenbach, P., 2008. Comparing landslide inventory maps. Geomorphology, 94(3-4): 268-289.
Guzzetti, F., Reichenbach, P., Cardinali, M., Galli, M. and Ardizzone, F., 2005. Probabilistic landslide hazard assessment at the basin scale. Geomorphology, 72: 272-299.
Jolma, A. et al., 2008. Free and Open Source Geospatial Tools for Environmental Modelling and Management Developments in Integrated Environmental Assessment. In: A.A.V. A.J. Jakeman, A.E. Rizzoli and S.H. Chen (Editor), Environmental Modelling, Software and Decision Support. Elsevier, pp. 163-180.
Larsen, M.C. and Parks, J.E., 1997. How wide is a road? The association of roads and mass movements in a forested montane
environment. Earth Surface Processes and Landforms, 22: 835– 848.
Li, X.-g., Wang, A.-m. and Wang, Z.-m., 2010. Stability analysis and monitoring study of Jijia River landslide based on WebGIS, Journal of Coal Science and Engineering (China). China Coal Society, co-published with Springer-Verlag GmbH, pp. 41-46.
M. A. Brovelli , D.M., AN ARCHAEOLOGICAL WEB GIS APPLICATION BASED ON MAPSERVER AND POSTGIS, The International Archives of the Photogrammetry, Remote Sensing and Spatial Information Sciences, Vol. XXXIV, Part 5/W12.
Moreno-Sanchez, R., Anderson, G., Cruz, J. and Hayden, M., 2007. The potential for the use of Open Source Software and Open Specifications in creating Web-based cross-border health spatial information systems. International Journal of Geographical Information Science, 21(10): 1135-1163.
Roppola, A.J. and Bugg, A.L., 2004. Innovative and effective internet information systems for natural resource managers. Journal of Spatial Science, 49(1): 49-60.
Saha, A.K., Gupta, R.P., Sarkar, I., Arora, M.K. and Csaplovics, E., 2005. An approach for GIS-based statistical landslide susceptibility zonation-with a case study in the Himalayas. Landslides, 2: 61-69.
Salvati, P., Balducci, V., Bianchi, C., Guzzetti, F. and Tonelli, G., 2009. A WebGIS for the dissemination of information on historical landslides and floods in Umbria, Italy, GeoInformatica. Springer Netherlands, pp. 305-322.
Steiniger, S. and Bocher, E., 2009. An overview on current free and open source desktop GIS developments. International Journal of Geographical Information Science, 23(10): 1345-1370.
Steiniger, S. and Hay, G.J., 2009. Free and open source geographic information tools for landscape ecology. Ecological Informatics, 4(4): 183-195.
van Westen, C.J., Castellanos, E. and Kuriakose, S.L., 2008. Spatial data for landslide susceptibility, hazard and vulnerability assessment: An overview. Engineering Geology, 102: 112-131.
Varnes, D.J., 1984. Landslide Hazard Zonation: a Review of Principles and Practice. Review Report. UNESCO, Daramtiere, Paris, 61 pp.
Vinod Kumar, K., Lakhera, R.C., Martha, T.R., Chatterjee, R.S. and Bhattacharya, A., 2008. Analysis of the 2003 Varunawat Landslide, Uttarkashi, India using Earth Observation data. Environmental Geology, 55: 789-799.
7. ACKNOWLEDGEMENT
This write-up is the outcome of the research carried out in the field of geo-information science at IIRS, Dehradun. We are also thankful to BRO, Tekla, Uttarkashi, for providing us the detail landslide inventory data in the national highway corridor. First author is thankful to Director, NRSC, Hyderabad, for allowing him to carry out this research.