PREFACE
The first edition of the National Healthcare Establishments and Workforce Statistics (NHEWS) 2008-2009 Hospital report was successfully published in 2011 amid the rising demand for more Malaysian healthcare statistics to be reported from time to time. This success has prompted this year’s NHEWS to move many steps forwards in providing even more reliable and interesting healthcare statistics that would be of great importance to policy makers in the Ministry, other ministries as well as various healthcare related industries.
There are more information collected on healthcare facilities, health workforce and healthcare services in the 2010 report. Steps to ensure the quality and accuracy of statistical analysis have been taken.
Policy decisions on healthcare must be based on strong and relevant evidence. Thus, it is justified that I strongly believe in the National Healthcare Statistics Initiative’s tagline that; “the better use of better statistics will lead to better policy and better healthcare outcomes”.
The response rate for the 2010 survey is 75.4%, it has improved from 69.9% in 2008-2009. The increase in response is indeed encouraging and this is due to the greater awareness of the survey, better partnership and the hard work of the research team who made calls to non-responders.
Indeed, we welcome the synergistic participation of the various parties involved in making this report a success. The co-operation we received from the private healthcare services is also to be commended and is very much appreciated as this data will also contribute credible and reliable information that will form the basis for many operational and investment decisions for the private sector.
My sincere appreciation and highest gratitude to all those who have contributed towards the successful completion of the second NHEWS (Hospital) Report and I look forward to receiving this second edition of the series of reports on Malaysian Healthcare Statistics 2010.
CONTENTS
PREFACE
ACKNOWLEDGEMENTS
MEMBERS OF NHEWS (HOSPITAL) PROJECT TEAM
MEMBERS OF NHEWS (HOSPITAL) EXPERT PANELS
SUMMARY OF STUDY PROCESS
STUDY METHODOLOGY
CONSORT DIAGRAM NHEWS (HOSPITAL) 2010
ABBREVIATIONS
CHAPTER 1 : OVERVIEW ON HOSPITALS AND SPECIALISTS SERVICES IN MALAYSIA
CHAPTER 2 : HOSPITAL SERVICES IN MALAYSIA
Table 2.1 : Number and Density of Acute Hospitals in Malaysia by State and Sector, 2009 and 2010
Table 2.2 : Number and Density of Types of Acute Hospital Establishments in Malaysia by State and Sector, 2010 Table 2.3 : Number and Density of Different Types of Private Hospital’s Entrepreneurship in Malaysia by State, 2010 Table 2.4 : Number and Density of Inpatient Beds in Acute Hospitals in Malaysia by State and Sector, 2009 and 2010
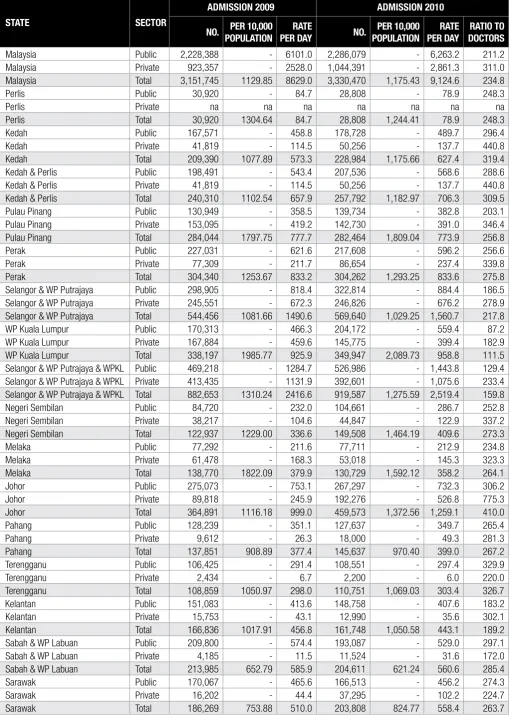
Table 2.5 : Number, Density, Ratio to Doctors and Rate of Patient Admission per Day in Acute Hospitals in Malaysia by State and Sector, 2009 and 2010
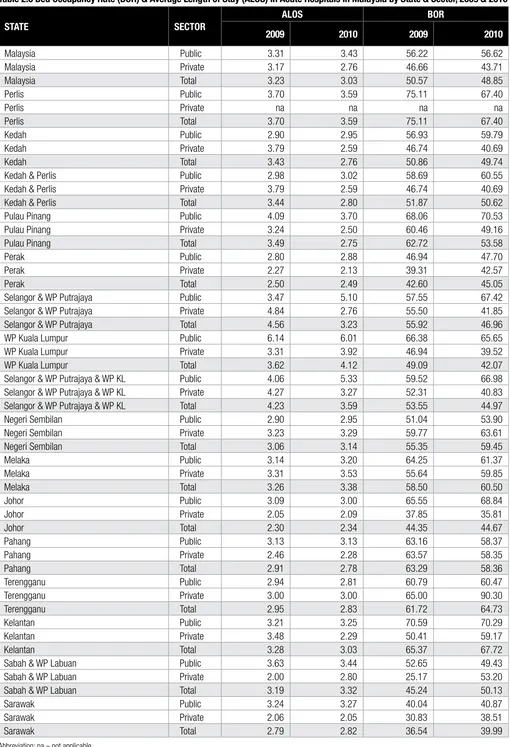
Table 2.6 : Bed Occupancy Rate (BOR) and Average Length of Stay (ALOS) in Acute Hospitals in Malaysia by State and Sector, 2009 and 2010
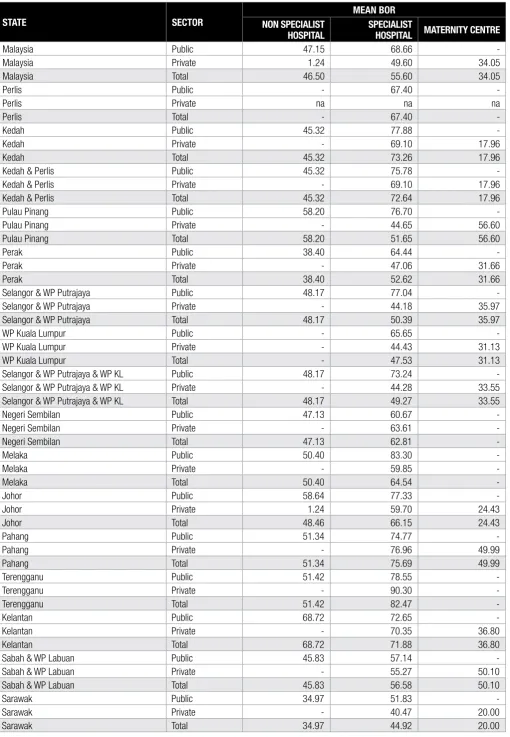
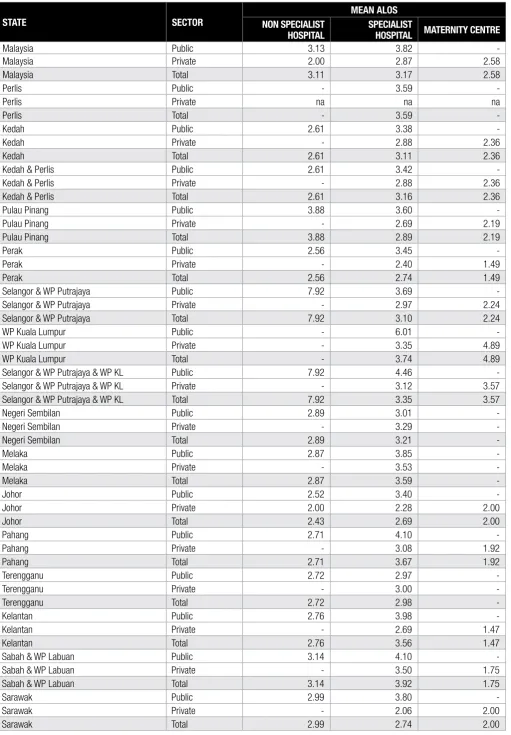
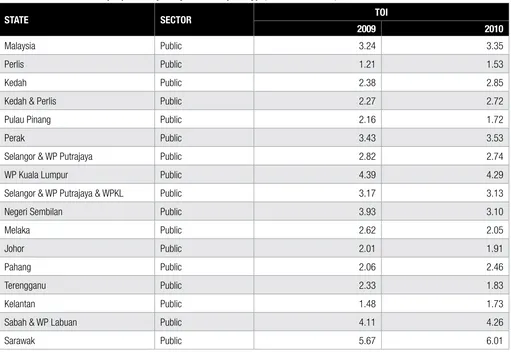
Table 2.7 : Bed Occupancy Rate (BOR) in Malaysia by Acute Hospital Type, State and Sector, 2010 Table 2.8 : Average Length of Stay (ALOS) in Malaysia by Acute Hospital Type, State and Sector, 2010 Table 2.9 : Turnover Interval (TOI) in Malaysia by Acute Hospital Type, State and Sector, 2010.
Table 2.10 : Number and Density of Computed Tomography (CT) Scanner and Procedure Performed in Acute Hospitals in Malaysia by State and Sector, 2009 and 2010
Table 2.11 : Number and Density of Magnetic Resonance Imaging (MRI) and Procedure Performed in Acute Hospitals in Malaysia by State and Sector, 2009 and 2010
Table 2.12 : Number and Density of Positron Emission Tomography (PET) and Procedure Performed in Acute Hospitals in Malaysia by State and Sector, 2010
Table 2.13 : Number and Density of Hospital Doctors, Staff Nurses With Post Basic Training and Without Post Basic Training in Malaysia by State and Sector, 2010
Table 2.14 : Number and Density of Male Nurses, Community Nurses and Assistant Nurses in Malaysia by State and Sector, 2010 Table 2.15 : Number and Density of Assistant Medical Officers (AMOs) in Malaysia by State and Sector, 2010
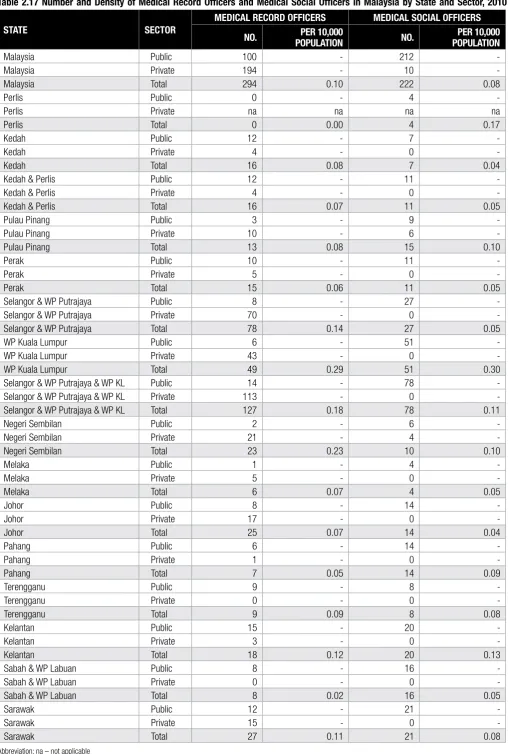
Table 2.16 : Number of Pharmacists, Physiotherapists, Occupational Therapists, and Dieticians in Malaysia by State & Sector, 2010 Table 2.17 : Number and Density of Medical Record Officers and Medical Social Officers in Malaysia by State and Sector, 2010
CHAPTER 3 : MATERNITY SERVICES IN MALAYSIAN HOSPITALS AND MATERNITY HOMES
Table 3.1 : Number, Density & Percentage of Hospitals Providing Maternity Services in Malaysia by State & Sector, 2008-2009 & 2010 Table 3.2 : Number, Density and Percentage of Delivery Beds, Ratio of Delivery Beds to Deliveries by State and Sector, 2010 Table 3.3 : Number and Density of Public Hospitals With OT Facilities and Dedicated OT in Malaysia by State, 2010
Table 3.4 : Number and Density of Functional Obstetrics HDU Beds Within O&G Departments in Malaysia by State and Sector, 2010 Table 3.5 : Number, Density and Percentages of Total Deliveries in Malaysia by State and Sector, 2008-2009 and 2010
Table 3.6 : Number, Density and Percentages of Spontaneous Vertex Deliveries (SVD) in Malaysia by State and Sector, 2010
CHAPTER 3 : MATERNITY SERVICES IN MALAYSIAN HOSPITALS AND MATERNITY HOMES (con’t)
Table 3.7 : Number, Density and Percentages of Vaginal Breech Deliveries in Malaysia by State and Sector, 2010
Table 3.8 : Number, Density and Percentages of Instrumental Deliveries Using Vacuum in Malaysia by State and Sector, 2010 Table 3.9 : Number, Density and Percentages of Instrumental Deliveries Using Forceps in Malaysia by State and Sector, 2010 Table 3.10 : Number, Density and Percentages of Caesarean Section Deliveries in Malaysia by State and Sector, 2010 Table 3.11 : Number and Density of Multiple Pregnancies Delivered in Malaysia by State and Sector, 2010
Table 3.12 : Number and Density of Eclampsia in Malaysia by State and Sector, 2010
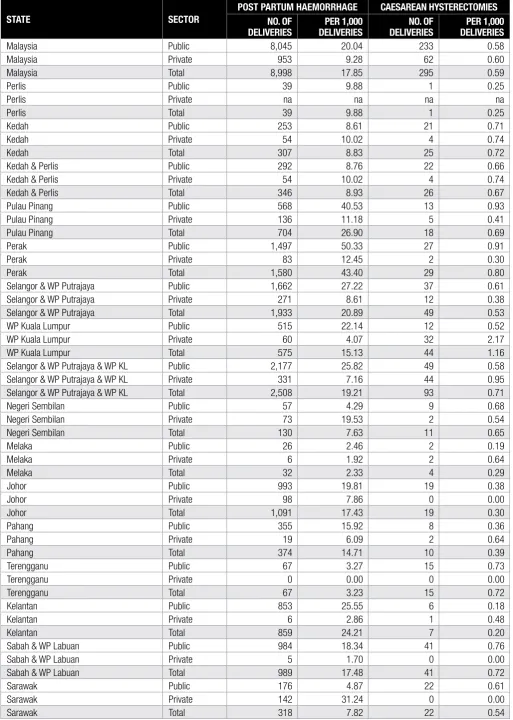
Table 3.13 : Number, Density and Percentages of Post Partum Haemorrhage (PPH) and Caesarean Hysterectomies Performed in Malaysia by State and Sector, 2010
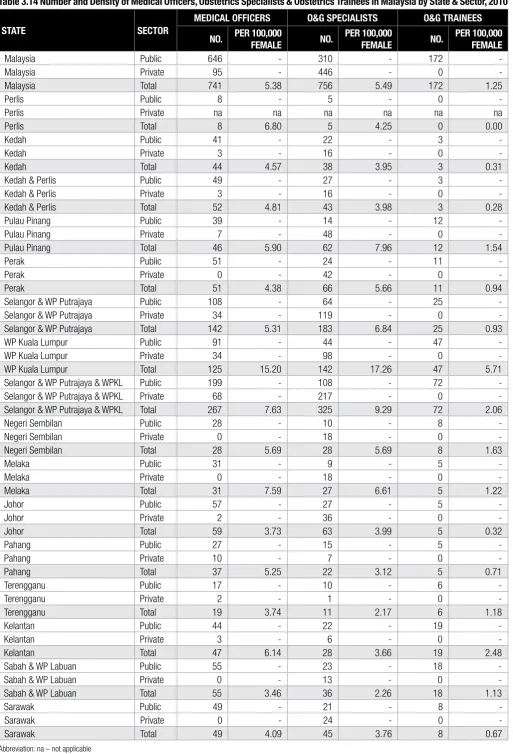
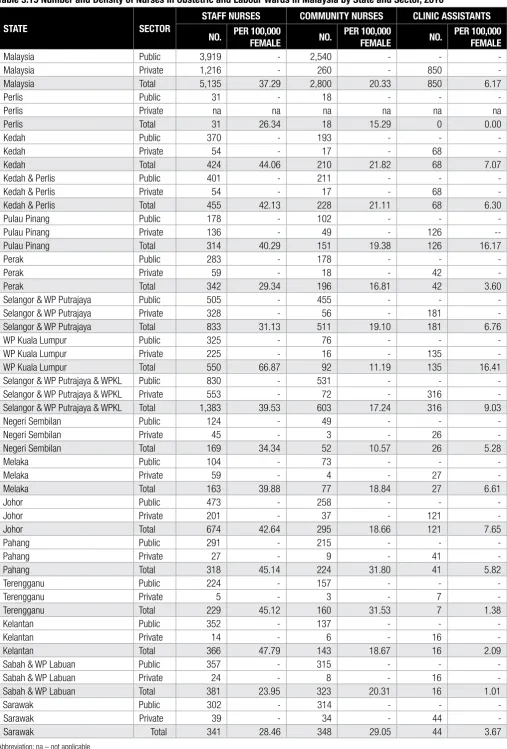
Table 3.14 : Number and Density of Medical Officers, Obstetrics Specialists & Obstetrics Trainees in Malaysia by State & Sector, 2010 Table 3.15 : Number and Density of Nurses in Obstetric and Labour Wards in Malaysia by State and Sector, 2010
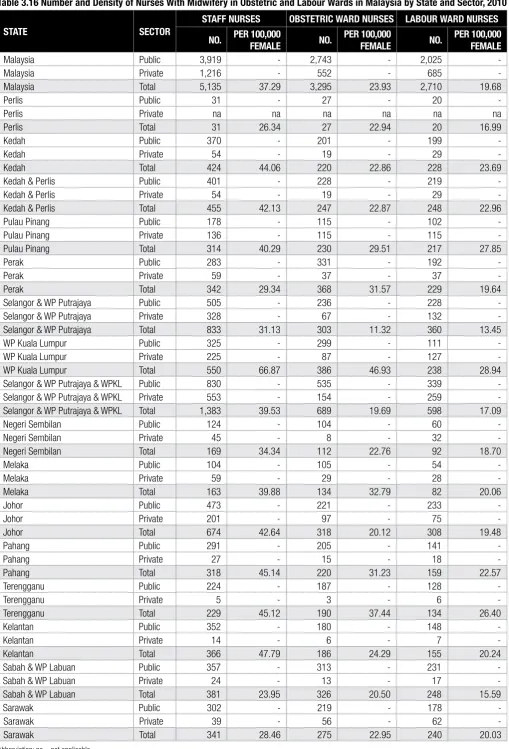
Table 3.16 : Number and Density of Nurses With Midwifery in Obstetric and Labour Wards in Malaysia by State and Sector, 2010 Table 3.17 : Number of Maternity Homes Providing Maternity Services in Malaysia by State, 2010
Table 3.18 : Number of Delivery Beds in Maternity Homes in Malaysia by State, 2010
Table 3.19 : Number of Medical Officers and Obstetrics Specialists in Maternity Homes in Malaysia by State, 2010 Table 3.20 : Number of Deliveries in Maternity Homes in Malaysia by State, 2010
Table 3.21 : Number of Spontaneous Vertex Deliveries (SVD), Breech & Vacuum Deliveries in Maternity Homes in Malaysia by State, 2010 Table 3.22 : Number of Eclampsia and Post Partum Haemorrhage (PPH) in Maternity Homes Deliveries in Malaysia by State, 2010 Table 3.23 : Number of Newborns Delivered and Newborns Admitted to Paediatrics, NICU and SCN in Maternity Homes in Malaysia by
State, 2010
Table 3.24 : Number of Staff Nurses, Community Nurses, Clinic Assistants and Nurses with Midwifery Training in Maternity Homes in Malaysia by State, 2010
CHAPTER 4 : PAEDIATRIC SERVICES IN MALAYSIAN HOSPITALS
Table 4.1 : Number and Density of Hospitals Providing Paediatric Services in Malaysia by State and Sector, 2010
Table 4.2 : Number and Density of Paediatric Beds & Medical Officers in Public Specialist Hospitals in Malaysia by State & Sector, 2010 Table 4.3 : Number and Density of Paediatric Medical Wards, Beds & Nurses in Specialist Hospitals in Malaysia by State & Sector, 2010 Table 4.4 : Number and Density of Paediatric Medical Wards, Beds, Medical Officers and Nurses in Non Specialist Public Hospitals by
State, 2010
Table 4.5 : Number and Density of Neonatal Intensive Care (NICU), NICU Beds, NICU Staff Nurses and Community Nurses in Malaysia by State and Sector, 2010
Table 4.6 : Number and Density of Special Care Nursery (SCN), SCN Beds, SCN Staff Nurses and Community Nurses in Public Hospitals by State, 2010
Table 4.7 : Number and Density of Paediatric Intensive Care (PICU), PICU Beds & PICU Nurses in Malaysia by State & Sector, 2010 Table 4.8 : Number and Density of Paediatric High Dependency Ward (PHDW) Beds & PHDW Nurses in Malaysia by State & Sector, 2010 Table 4.9 : Number and Density of Hospitals Without PICU and Mode of Admissions in Malaysia by State and Sector, 2010
Table 4.10 : Number and Density of Paediatricians, Paediatric Trainees and Paediatric Subspecialty Trainees in Malaysia by State and Sector, 2010
CHAPTER 5 : SURGICAL SERVICES IN MALAYSIAN HOSPITALS
Table 5.1 : Number and Density of Hospitals Providing General Surgical Services in Malaysia by State and Sector, 2010 Table 5.2 : Number and Density of Operating Rooms (ORs), Functioning ORs, Dedicated Emergency/Trauma Theatres and Surgical
High Dependency Beds in Malaysia by State and Sector, 2010
Table 5.3 : Number and Density of General Surgeons & Total Elective Operating Hours in Public Hospitals in Malaysia by State, 2010 Table 5.4 : Number and Density of Total Appendicectomies in Malaysia by State and Sector, 2010
Table 5.5 : Number and Density of Total Laparatomies for Trauma and Mastectomies in Malaysia by State and Sector, 2010 Table 5.6 : Number and Density of Inguinal Hernia Surgeries in Malaysia by State and Sector, 2010
Table 5.7 : Number and Density of Total Cholecystectomies and Thyroidectomies in Malaysia by State and Sector, 2010
Table 5.8 : Number and Density of Postoperative Mortality in Elective and Emergency General Surgeries in Malaysia by State and Sector, 2010
Table 5.9 : Number of General Surgeons, General Surgery Trainees, General Surgery Subspecialty Trainees and Theatre Scrub Nurses in Malaysia by State and Sector, 2010
Table 5.10 : Number and Density of Breast Surgeons, Breast and Endocrine Surgeons in Malaysia by State and Sector, 2010 Table 5.11 : Number & Density of Vascular Surgeons, Hepatobiliary Surgeons & Colorectal Surgeons in Malaysia by State & Sector, 2010
CHAPTER 6 : EMERGENCY AND TRAUMA SERVICES IN MALAYSIAN HOSPITALS
Table 6.1 : Number & Density of Hospitals Providing Emergency & Trauma Services in Malaysia by State and Sector, 2008-2009 & 2010 Table 6.2 : Number and Density of Red Zone, Yellow Zone, Asthma and Paediatrics Resuscitation Cubicles in Emergency & Trauma
Departments by State and Sector, 2010
Table 6.3 : Number and Density of Observation Beds and One Stop Crisis Centre (OSCC) Rooms in Emergency & Trauma Departments by State and Sector, 2010
Table 6.4 : Number and Density of Psychiatric Evaluation Rooms and Decontamination Facilities in Emergency & Trauma Departments by State and Sector, 2010
Table 6.5 : Number and Density of Ambulances and Ambulance Services in Emergency & Trauma Departments in Hospitals by State and Sector, 2010
Table 6.6 : Number and Density of Visits to Emergency & Trauma Departments by State and Sector, 2008-2009 and 2010 Table 6.7 : Number and Density of Trauma, Red Zone, One Stop Crisis Centre (OSCC) and Poisoning Cases in Emergency & Trauma
Departments by State and Sector, 2010
Table 6.8 : Number and Density of Parenteral Thrombolytics Therapy Administered for Myocardial Infarct at Emergency & Trauma Departments by State and Sector, 2010
Table 6.9 : Number and Density of Emergency Physicians and Trainees in Emergency and Trauma Departments by State and Sector, 2008-2009 and 2010
Table 6.10 : Number and Density of Assistant Medical Officers and Staff Nurses With and Without Post Basic Training in Emergency & Trauma Departments by State and Sector, 2010
Table 6.11 : Number and Density of Ultrasound Machines and Point of Care Testing Used in Emergency & Trauma Departments by State and Sector, 2010
CHAPTER 7 : ANAESTHESIOLOGY SERVICES IN MALAYSIAN HOSPITALS
Table 7.1 : Number and Density of Hospitals Providing Anaesthesiology Services in Malaysia by State and Sector, 2010
Table 7.2 : Number and Density of Anaesthesiologists, Intensive Care Specialists, Anaesthesiology Trainees and Anaesthesiology Subspecialty Trainees in Malaysia by State and Sector, 2010
Table 7.3 : Number and Density of Operating Theaters (OTs), Operating Rooms (ORs) and Functional ORs in Malaysia by State and Sector, 2010
Table 7.4 : Number and Density of Hospitals Providing Day Care Surgery in Malaysia by State and Sector, 2010
Table 7.5 : Number of Hospitals Providing Anaesthetic Clinics, Acute Pain Services and Patient Controlled Analgesia Machines in Malaysia by State and Sector, 2010
Table 7.6 : Number and Density of Hospitals with Intensive Care Units (ICUs), Total ICUs with General ICUs in Malaysia by State and Sector, 2010
Table 7.7 : Number and Density of Designated and Functional ICU Beds in General ICUs in Malaysia by State and Sector, 2010 Table 7.8 : Number and Density of Level 1, Level 2 and Level 3 ICU Beds in Malaysia by State and Sector, 2010
Table 7.9 : Number of Functional Invasive, Transport, Non Invasive Positive Pressure and High Frequency Ventilators in Malaysia by State and Sector, 2010
Table 7.10 : Number and Density of ICU Nurses and ICU Nurses With Post Basic Intensive Care in Malaysia by State and Sector, 2010
CHAPTER 8 : ONCOLOGY SERVICES IN MALAYSIAN HOSPITALS
Table 8.1 : Number & Density of Hospitals Providing Oncology Services With & Without Oncologists in Malaysia by State & Sector, 2010 Table 8.2 : Number and Density of Hospitals With Clean Room for Reconstitution of Cytotoxic Drugs and Total Clean Room for
Reconstitution of Cytotoxic Drugs in Malaysia by State and Sector, 2010
Table 8.3 : Number and Density of Hospitals Providing Cytotoxic Drug Reconstitution (CDR) Isolator and Cytotoxic Safety Cabinets in Malaysia by State and Sector, 2010
Table 8.4 : Number and Density of Oncologists and Oncology Trainees in Malaysia by State and Sector, 2009 and 2010
Table 8.5 : Number and Density of Oncology Trained Nurses, Radiation Therapists and Physicists in Malaysia by State & Sector, 2010 Table 8.6 : Number and Density of CDR Pharmacists and CDR Assistant Pharmacists in Malaysia by State and Sector, 2010 Table 8.7 : Number & Density of Megavoltage Machine, Brachytherapy Machine and Simulators in Malaysia by State & Sector, 2010 Table 8.8 : Number and Density of Hospital with Physics Equipment and Treatment Planning System Devices in Malaysia by State
and Sector, 2010
Table 8.9 : Number and Density of Intensity Modulated Radiotherapy (IMRT) and Image Guided Radiotherapy (IGRT) in Malaysia by State and Sector, 2010
CHAPTER 9 : PSYCHIATRIC SERVICES IN MALAYSIAN HOSPITALS
Table 9.1 : Number and Density of Hospitals Providing Psychiatric Services in Malaysia by State and Sector, 2010
Table 9.2 : Number and Density of Inpatient Psychiatric Admissions, Dedicated Beds and Mean Bed Occupancy Rates in Malaysia by State and Sector, 2010
Table 9.3 : Number and Density of Outpatient Psychiatric Visits and New Cases in Malaysia by State and Sector, 2010 Table 9.4 : Number and Density of Hospitals Providing Community and Rehabilitation, Child & Adolescent and Psychogeriatric
Services in Malaysia by State and Sector, 2010
Table 9.5 : Number of Hospitals Providing Methadone Services & Total Methadone Patients in Malaysia by State and Sector, 2010 Table 9.6 : Number and Density of Hospitals Providing Types of Psychiatric Healthcare Services in Malaysia by State and Sector, 2010 Table 9.7 : Number and Density of ECT Machines and Procedures in Malaysian Hospitals by State and Sector, 2010
Table 9.8 : Number and Density of Psychiatrists, Psychiatric Trainees and Fellows in Psychiatry in Malaysian Hospitals by State and Sector, 2010
Table 9.9 : Number and Density of Clinical Psychologists in Malaysian Hospitals by State and Sector, 2010 Table 9.10 : Number and Density of Occupational Therapists in Malaysian Hospitals by State and Sector, 2010 Table 9.11 : Number and Density of Nurses in Malaysian Hospitals by State and Sector, 2010
Table 9.12 : Number and Density of Assistant Medical Officers in Malaysian Hospitals by State and Sector, 2010
APPENDIX 1 : LIST OF DEFINITIONS
Chapter : Hospital
Chapter : Obstetrics & Gynaecology Chapter : Paediatrics
Chapter : Emergency Chapter : General Surgery Chapter : Anaesthesiology Chapter : Oncology Chapter : Psychiatry
APPENDIX 2 : PARTICIPANTS FOR NHEWS (HOSPITAL) 2010
Sector : Public / Ministry of Health Sector : Private
Sector : Public / University
Sector : Public / Jabatan Kemajuan Orang Asli
APPENDIX 3 : MALAYSIAN POPULATION, 2010
Table A3.1 : Total Population by State, Malaysia 2010
Table A3.2 : Total Population of Female by State, Malaysia 2010
Table A3.3 : Total Population of Children Under 5 Years Old by State, Malaysia 2010
APPENDIX 4 : MEDICAL SUBSPECIALTIES
Table A4.1 : Number and Density of Internal Medicine and Infectious Diseases Specialists in Malaysia by State and Sector, 2009 and 2010 Table A4.2 : Number and Density of Nephrologists and Endocrinologists in Malaysia by State and Sector, 2009 and 2010
Table A4.3 : Number and Density of Cardiologists and Respiratory Medicine Specialists in Malaysia by State and Sector, 2009 and 2010 Table A4.4 : Number and Density of Hepatologists and Gastroenterologists in Malaysia by State and Sector, 2009 and 2010
Table A4.5 : Number and Density of Clinical Haematologists in Malaysia by State and Sector, 2009 and 2010
Table A4.6 : Number and Density of Neurologists and Rheumatologists in Malaysia by State and Sector, 2009 and 2010 Table A4.7 : Number and Density of Geriatric Medicine Specialists in Malaysia by State and Sector, 2009 and 2010
APPENDIX 5 : OTHER SPECIALTIES IN MEDICINE
Table A5.1 : Number and Density of Cardiothoracic and Paediatric Surgeons in Malaysia by State and Sector, 2009 and 2010 Table A5.2 : Number and Density of Plastic and Reconstructive Surgeons in Malaysia by State and Sector, 2009 and 2010 Table A5.3 : Number and Density of Neurosurgeons and Urologists in Malaysia by State and Sector, 2009 and 2010
Table A5.4 : Number and Density of Orthopaedic Surgeons and Sports Medicine Specialists in Malaysia by State and Sector, 2009 and 2010 Table A5.5 : Number and Density of Radiologists and Nuclear Medicine Specialists in Malaysia by State and Sector, 2009 and 2010 Table A5.6 : Number and Density of Pathologists and Forensic Pathologists in Malaysia by State and Sector, 2009 and 2010 Table A5.7 : Number and Density of Rehabilitation Medicine Specialists in Malaysia by State and Sector, 2009 and 2010
Table A5.8 : Number and Density of Otorhinolaryngologists and Ophthalmologists in Malaysia by State and Sector, 2009 and 2010
155
ACKNOWLEDGEMENTS
The National Healthcare Statistics Initiative team would like to thank the Director General of Health Malaysia for his continuous support towards this survey and permission to publish the report.
Also, our sincere appreciation to the following for their participation, assistance, support and contribution: • Deputy Director General of Health (Research and Technical Support), MOH
• Deputy Director General of Health (Medical), MOH • Deputy Director General of Health (Public Health), MOH
• Director, Clinical Research Centre (CRC), National Institutes of Health (NIH) • Director, Medical Development Division, MOH
• Director, Medical Practice Division, MOH • Health Informatics Centre, MOH
• Private Medical Practice Control Section (National level) • Private Medical Practice Control Unit (State level)
• All participating public, private and university hospitals which provided or allowed access to their establishment and workforce data. • KPJ Healthcare Berhad
• Pantai Holdings Berhad
• Malaysian Medical Council, Association of Private Hospitals of Malaysia, Obstetrical & Gynaecological Society of Malaysia, Malaysian Paediatric Association, Malaysian Society of Anaesthesiologists, Malaysian Psychiatric Association, Malaysian Oncological Society
• Head of Clinical Services, MOH
• Members of NHEWS (Hospital) Expert Panels
• All medical doctors and support personnel who participated in the NHEWS (Hospital)
• All those who have supported or contributed to the success of the NHEWS (Hospital) and publication of this report Thank you.
MEMBERS OF NHEWS (HOSPITAL) PROJECT TEAM
PRINCIPAL INVESTIGATOR DATUK DR. NOOR HISHAM ABDULLAH
PRINCIPAL CO-INVESTIGATOR DR. SHEAMINI SIVASAMPU DR. GOH PIK PIN
CO-INVESTIGATORS
DR. NOORAINI BABA
DR. MD KHADZIR SHEIKH AHMAD MR. ZAMANE ABDUL RAHMAN
PROJECT LIAISON OFFICERS DR. AFIDAH ALI
DR. LAILI MURNI MOKHTAR
PROJECT MANAGER DR. TAHRANI PERIANA KOVINDEAR
DR. ARUNAH CHANDRAN (OCT 2011 – PRESENT)
SURVEY COORDINATORS
MS. FAIZAH AHMAD MS. KAMILAH DAHIAN MS. FATIHAH MAHMUD
MS. NORFADILAH HAMDAN (JAN 2011 – AUG 2011) MS. MUNIRAH MOHAMED (JULY 2010 – JAN 2011)
STATISTICIAN MS. LENA YEAP
MEMBERS OF NHEWS (HOSPITAL) EXPERT PANELS
EXPERT PANELS INSTITUTIONS
Datin Dr. Nor Akma Yusuf Medical Development Division, Ministry of Health
Dr. Afidah Ali Medical Practice Division, Ministry of Health
Dr. Laili Murni Mokhtar Medical Development Division, Ministry of Health
Matron Faridah Omar Nursing Division, Ministry of Health
Ms. Ruby Ng Association of Private Hospitals of Malaysia
Dr. Sheamini Sivasampu Clinical Research Centre, Ministry of Health
Ms. Fatihah Mahmud Clinical Research Centre, Ministry of Health
MATERNITY SERVICES
EXPERT PANELS INSTITUTIONS
Dato’ Dr. Ravindran Jegasothy Hospital Kuala Lumpur
Dr. Ravichandran Jeganathan Hospital Sultanah Aminah, Johor Bahru Prof. Dr. Zaleha Abdullah Mahdy Universiti Kebangsaan Malaysia Medical Centre Dr. Sharmini Diana Parampalam Hospital Seberang Jaya
Dr. Jumeah Shamsuddin Hospital Kuala Lumpur
Dr. Arpah Ali Medical Development Division, Ministry of Health
Dr. Arunah Chandran Clinical Research Centre, Ministry of Health
Ms. Faizah Ahmad Clinical Research Centre, Ministry of Health
PAEDIATRIC SERVICES
EXPERT PANELS INSTITUTIONS
Dr. Lim Yam Ngo Hospital Kuala Lumpur
Dato’ Dr. Teh Keng Hwang Hospital Sultanah Bahiyah, Alor Setar Prof. Dr. Zabidi Azhar Hussin Malaysian Paediatrics Association
Dr. Neoh Siew Hong Hospital Kuala Lumpur
Dr. Maznisah Mahmood Hospital Kuala Lumpur
Dr. Jafanita Jamaluddin Medical Development Division, Ministry of Health
Dr. Arunah Chandran Clinical Research Centre, Ministry of Health
Ms. Kamilah Dahian Clinical Research Centre, Ministry of Health
HOSPITAL SERVICES
MATERNITY SERVICES
SURGICAL
EXPERT PANELS INSTITUTIONS
Datuk (Mr.) Harjit Singh Hospital Selayang
Mr. Andrew Gunn Kean Beng Hospital Sultanah Aminah, Johor Bahru Dato’ (Mr.) Abdul Jamil Abdullah Hospital Sultanah Nur Zahirah
Dato’ (Mr.) Mohamed Yusof Abd. Wahab Hospital Tengku Ampuan Rahimah, Klang
Dato’ (Mr.) Jiffre Din Hospital Tengku Ampuan Afzan, Kuantan
Mr. Nik Azim Nik Abdullah Hospital Umum Sarawak
Mr. Clement Edward Thaumanavar Hospital Tuanku Fauziah, Kangar
Mr. Tan Wee Jin Hospital Pulau Pinang
Mr. Chuah Jitt Aun Hospital Queen Elizabeth, Kota Kinabalu
Mr. Azali Hafiz Yafee Hospital Melaka
Mr. Nik Mohamad Shukri Nik Yahya Hospital Raja Perempuan Zainab II, Kota Bharu Mr. Khairun Nizam Mobin Hospital Sultanah Bahiyah, Alor Setar
Ms. Jasiah Zakaria Hospital Tuanku Jaafar, Seremban
Dr. Patimah Amin Medical Development Division, Ministry of Health
Dr. Tahrani Periana Kovindear Clinical Research Centre, Ministry of Health
Ms. Faizah Ahmad Clinical Research Centre, Ministry of Health
EMERGENCY SERVICES
EXPERT PANELS INSTITUTIONS
Dr. Teo Aik Howe Hospital Pulau Pinang
Dr. Mahathar Abd Wahab Hospital Kuala Lumpur
Dr. Ahmad Tajuddin Mohamad Nor Hospital Tengku Ampuan Rahimah, Klang
Dr. Khairi Kassim Hospital Tengku Ampuan Afzan, Kuantan
Assoc. Prof. Dr. Mohd Idzwan Zakaria Universiti Malaya Medical Centre
Assoc. Prof. Dr. Hj Ismail Mohd Saiboon Universiti Kebangsaan Malaysia Medical Centre Dr. Al Zamani Mohammad Idrose Hospital Kuala Lumpur
Dr. Shukruddeen Salleh Hospital Kuala Krai
Dr. Kasuadi Hussin Medical Development Division, Ministry of Health
Dr. Arunah Chandran Clinical Research Centre, Ministry of Health
Ms. Faizah Ahmad Clinical Research Centre, Ministry of Health
ANAESTHESIOLOGY SERVICES
EXPERT PANELS INSTITUTIONS
Datin Dr. V. Sivasakthi Hospital Kuala Lumpur
Dr. Mary S. Cardosa Hospital Selayang
Dato’ Dr. Jahizah Hassan Hospital Pulau Pinang
Dato’ Dr. Subrahmanyam Balan Hospital Sultanah Aminah, Johor Bahru
Dr. Jenny Tong May Geok Hospital Tuanku Jaafar, Seremban
Dr. Patimah Amin Medical Development Division, Ministry of Health
Dr. Tahrani Periana Kovindear Clinical Research Centre, Ministry of Health
Ms. Kamilah Dahian Clinical Research Centre, Ministry of Health
ONCOLOGY SERVICES
EXPERT PANELS INSTITUTIONS
Dr. Gerard Lim Chin Chye Hospital Kuala Lumpur
Assoc. Prof. (K) Dato’ Dr. Fuad Ismail Universiti Kebangsaan Malaysia Medical Centre Dr. Ros Suzanna Ahmad Bustaman Hospital Kuala Lumpur
Dr. Hafizah Zaharah Ahmad Hospital Kuala Lumpur
Dr. Lim Yeok Siew Hospital Ampang
Dr. Nellie Cheah Hospital Pulau Pinang
Dr. Nik Muhd. Aslan bin Abdullah Universiti Kebangsaan Malaysia Medical Centre
Dr. Lau Kah Liew Hospital Kuala Lumpur
Mdm. Sarah Lee Abdullah Hospital Kuala Lumpur
Ms. Anisah Nanyan Hospital Kuala Lumpur
Ms. Suryati Mustafar Hospital Kuala Lumpur
Dr. Tahrani Periana Kovindear Clinical Research Centre, Ministry of Health
Ms. Kamilah Dahian Clinical Research Centre, Ministry of Health
PSYCHIATRIC SERVICES
EXPERT PANELS INSTITUTIONS
Dr. Toh Chin Lee Hospital Selayang
Dr. Lim Chong Hum Hospital Ampang
Dr. Mazni Mat Junus Hospital Serdang
Dr. Azizul Awaluddin Hospital Putrajaya
Dr. Siti Nor Aizah Ahmad Hospital Kuala Lumpur
Dr. Sheamini Sivasampu Clinical Research Centre, Ministry of Health
Ms. Fatihah Mahmud Clinical Research Centre, Ministry of Health
SUMMARY OF STUDY PROCESS
CRF Development and Pilot Test
Survey Population
Hospital Induction and CRF Distribution
Data Collection and Data Entry
Data Cleaning, Verification and Standardisation
Data Analysis
Report / Manuscript Writing
Q
U
E
R
I
E
STUDY METHODOLOGY
Introduction
The project is a collaboration of various divisions in the Ministry of Health (MOH) such as Medical Development Division, Medical Practice Division, Planning and Development Division and Medical Device Bureau. The Healthcare Statistic Unit in Clinical Research Centre (CRC) is the project management team for the NHEWS hospital survey. CRC developed the operation procedures, designed, printed, and distributed all field manuals and Case Report Forms (CRF) for the survey. CRC was also responsible for the daily operations of the survey, the training of staff and troubleshooting. Approval for the NHEWS hospital protocol was granted by the MOH Medical Research and Ethics Committee (MREC) in 2010.
Data Security
The NHEWS hospital data collection was authorised under the Private Healthcare Facilities and Services Act 1998. However, participation was voluntary. Data collected in the NHEWS hospitals are consistent with the Personal Data Protection Act 2010. All information collected is held in the strictest confidence, according to legal and research ethics guidelines.
CRF Development and Pilot Test
The CRF was developed and designed by the NHEWS team in consultation with the respective NHEWS hospital expert panel. The survey form is comprised of 8 sections, namely:
1. Hospital Establishments Survey 2. Obstetrics Services Survey 3. Paediatric Services Survey 4. Anaesthesiology Services Survey 5. Emergency Services Survey
6. General Surgery & Subspecialty Services Survey 7. Psychiatric Services Survey
8. Oncology Services Survey
Variables in each section were grouped by subsections such as facilities, activities & services, workforce, trainee doctors’ details and medical devices. The CRFs were developed in printed and electronic versions so as to provide options in mode of data submission and as a means to increase respondents’ participation.
The CRFs were pilot-tested by 2 public hospitals, namely Hospital Selayang and Hospital Serdang before being rolled out. Representatives from these 2 hospitals were briefed on the objectives of the survey, the datasets required and the mode of data submission available. They were then given hands-on training using the electronic version of the CRF. Revisions and improvements were made to the survey form where necessary and corrections were made, taking into account comments and responses received during the pilot tests. List of data definitions used in this survey are included in Appendix 1.
Survey Population
The determination of total population for the survey was finalised prior to the initiation of data collection. The procedure involved record matching of hospitals in current NHEWS hospital databases against independent databases of the Ministry’s Private Medical Practice Control Section, Department of Statistics (DOS) and Medical Development Division. Both matched and unmatched records were then reviewed by the NHEWS hospital team while the verification procedure was conducted by contacting each site to confirm operational status. The review and verification processes were repeated until the dataset was cleaned of inconsistencies and finalised. All hospitals that had cleaned datasets were included in the NHEWS hospital survey. The NHEWS hospital survey collected data from all hospitals in Malaysia. Only hospitals that met the following eligibility criteria were included:
• General hospitals, maternity centres, specialised institutions i.e. cardiology, eye and children’s general hospitals • Hospitals providing acute (curative) care
• Orang Asli hospital Excluded hospitals are:
• Hospitals with zero beds
• Military hospitals as well as hospital units of institutions, such as prison hospitals. • Hospitals and hospital beds available for chronic or long-term care
(e.g. rehabilitation and palliative care, nursing homes, leprosy centres and psychiatric institutions) • Hospitals converted into maternity homes
The hospital sampling frame was constructed from multiple sources including the following: • Public hospital listings from MOH’s division
• Private hospital register from Private Medical Practice Control Section There were a total of 347 hospitals in Malaysia in 2010.
The total number in the population, inclusion and exclusion criteria with the number of establishments included and excluded in the study, and response rates are summarised in the following table:
Note: Details of hospitals that participated in NHEWS hospital survey are available in Appendix 2 Hospital Induction & CRF Distribution
The first task of the NHEWS hospital field operations consisted of briefing all hospitals in the survey population. It is a process of introducing the survey to the hospitals and getting them to participate voluntarily.
This process began with the distribution of invitation letters to the hospital administrators or directors to attend briefing sessions conducted in 13 states at specified venues and dates.
The hospital induction was conducted at the following locations and dates:
A compilation of the following documents were distributed to hospital representatives who attended the induction session: • NHEWS information brochure
• Survey instruction manual
• An endorsement letter from the State Health Director • Username and password access details for electronic CRF • NHEWS 2008-2009 hospital report
The induction session began with a PowerPoint slide presentation by a NHEWS hospital team member with a brief overview on the project and the aims of the NHEWS hospital survey. This was followed by demonstrations on how to fill in the paper and electronic CRFs. Hospitals that were not represented during the induction meeting were contacted on a later date in an effort to include their participation and to provide them with the relevant documents by post.
Hospital representatives were given 2 weeks duration to submit the completed CRFs. Non respondents after this duration were contacted in order to remind and to track the distributed CRFs.
HOSPITAL CATEGORY TOTAL NUMBER
Ministry of Health 136 130 130 (100%)
University 3 3 3 (100%)
Orang Asli 1 1 1 (100%)
Private 207 203 120 (59.1%)
Total 347 337 254 (75.4%)
NO LOCATION TARGETED HOSPITALS DATE
1 WP Kuala Lumpur From WP Kuala Lumpur & WP Putrajaya 25 March 2011
2 Serdang, Selangor From Selangor 31 March & 1 April 2011
3 Melaka From Melaka 6 April 2011
4 Seremban, Negeri Sembilan From Negeri Sembilan 11 April 2011
5 Kuantan, Pahang From Pahang 13 April 2011
6 Ipoh, Perak From Perak 14 April 2011
7 Johor Bharu, Johor From Johor 20 April 2011
8 Georgetown, Pulau Pinang From Pulau Pinang 21 April 2011
9 Kuching, Sarawak From Sarawak 25 April 2011
10 Kota Kinabalu, Sabah From Sabah & WP Labuan 28 April 2011
11 Alor Setar, Kedah From Kedah & Perlis 9 May 2011
12 Tumpat, Kelantan From Kelantan 16 May 2011
Data Collection
For the purpose of easy data entry at respondent site, the cleaned dataset on human workforce was pre uploaded into the NHEWS hospital database in order to minimize the need for manual typing of names and related information. The cleaned dataset was obtained by conducting record matching of human workforce information in current NHEWS hospital database against databases from Malaysian Medical Council, National Specialist Register and Medical Development Division. The cleaned list was then sent to the corresponding heads of services in the MOH or other related authorised personnel for final verification.
Respondents had the option to choose between 2 modes of data submission which are: 1. Paper data submission via hardcopy Case Report Form (CRF)
2. Electronic data submission via web application (eCRF) Data Entry
Data received via paper submission was thoroughly checked and reviewed for completeness and consistency prior to data entry into the NHEWS hospital database. Data entry was then performed by trained NHEWS hospital team members. Data entry from participant’s site through electronic CRF was submitted directly into the NHEWS hospital database and monitored in real-time basis by NHEWS hospital team. Quality of data entry was constantly checked and maintained by several built-in features in the data entry module such as a compulsory data checking function, inconsistency checks, auto calculations and auto default data from the previous year’s survey. Every activity in NHEWS hospital database was recorded in a real-time tracking system.
Data Cleaning, Verification and Standardisation
Data cleaning was performed in parallel with data entry based on the results of edit checks. An edit check is a data checking procedure for tracing doubtful data being entered and was performed by NHEWS team members who were familiar with hospital settings. Queries that arose were then attended to by contacting the data entry personnel at the participant’s site or other authorised representatives to seek further clarification. All queries were resolved before the database was locked from any further data entry activities to maintain data quality and integrity. A final checking was performed prior to database locking to ensure that the data was acceptable for statistical analysis. The dataset was then standardised by performing data deduplication procedure for removing duplicate records and checking of range and consistency to detect outliers and deviate data. Verification of outliers and deviate data was done with the source data providers via verbal and written communication and the data were cross checked against other data sources such as the Health Information Management System reports, Malaysian Medical Council Doctor Database, professional societies, National Specialist Register and Registry Central Surveys. Most of the missing or out-of-range mandatory variables and auxiliary variables were resolved
Statistical Analysis
In this report, the outcomes such as establishments, services, facilities, workforce and devices of hospitals and specialist services were expressed as an absolute count by state, sector and year while the activities were expressed as an absolute count and mean by state, sector and year. The turnover interval (TOI) was calculated using the following formula:
TOI = ( B x ) - ALOS Where: B is number of inpatient beds
N is number of inpatient admissions ALOS is average length of stay
The number of hospitals and specialist services details per 10,000 population and per million population were calculated as follows: Number of hospitals and specialist services details /10,000 population = 10,000
Number of hospitals and specialist services details /million population = 1,000,000
Where: T is an estimate of the total quantity of the variable available in the country in the year under consideration.
P is the mid year population of Malaysia or the relevant geographic region where the survey was conducted.
For maternity services chapter, the number of hospitals and specialist services details per 10,000 population and per million population was calculated as follows:
Number of hospitals and specialist services details /10,000 female population = 10,000 Where: T is an estimate of the total quantity of the variable available in the country in the year under consideration.
Number of hospitals and specialist services details /100 deliveries = 100
Number of hospitals and specialist services details /1000 deliveries = 1,000
Where: T is an estimate of the total quantity of the variable available in the country in the year under consideration.
P is the total obstetric deliveries of Malaysia or the relevant geographic region where the survey was conducted.
For paediatric services chapter, the number of hospitals and specialist services details per 10,000 population and per million population was calculated as follows:
Number of hospitals and specialist services details /1,000 children population = 1,000 Where: T is an estimate of the total quantity of the variable available in the country in the year under consideration.
P is the mid-year children age below 15 years old population of Malaysia or the relevant geographic region where the survey was conducted.
Number of hospitals & specialist services details /1,000 deliveries = 1,000
Where: T is an estimate of the total quantity of the variable available in the country in the year under consideration.
P is the total deliveries of Malaysia or the relevant geographic region where the survey was conducted.
An estimate of the total quantity of the device/service/facility, T = , Where: Tiis the value of the quantity of device/service/ facility available in the ith facility in the year,
Wi is the sampling weight of the ith facility
Wi =
Please refer to details on the Malaysian population statistics for 2010 by state in Appendix 3.
The statistical estimation of the totals varies depending on the survey methods and the sampling design employed to the collected data, and if necessary, with adjustment for incomplete data.
As the response rate of the survey was less than 100%, the procedures described above incorporated the sampling weight of the sampling unit when making estimates in order that the weighted sample is representative of the population.
The sampling weight for each sampling unit or units of analysis has the following components:
Item non response or missing data were imputed to reduce bias using the following method: • Logical imputation
Adjust base weight in each class (formed by cross-classification of a few auxiliary variables) by inverse of weighted response rate in each class.
Auxiliary variables to form weighting class could also be selected by logistic regression to model response status.
T
P
×
T
P
×
1. Probability of selection
The basic weight is obtained by multiplying the reciprocals of the probability of the selection at each step of the sampling design.
2. Adjustment for non response
CONSORT DIAGRAM NHEWS (HOSPITAL) 2010
* List of establishments that have closed operations: 1. Appollo TTDI Medical Centre
2. Kim Fung Medical Centre Sdn. Bhd. 3. Hospital Taj/Polyclinic Taj (GRFL)
4. Pusat Pakar Perbidanan, Sakit Puan dan Kanak-kanak 5. Pusat Perubatan Darul Ehsan
6. Damansara Women’s Specialist Centre Sdn. Bhd. 7. Kajang Medical Centre Sdn. Bhd.
8. Kajang Specialist Maternity & Surgery Sdn.Bhd.
Total number of hospitals in all 16
N = 355
1. Specialised institution, n = 1 a. TMC Women’s Specialist (Kuantan) Sdn. Bhd. (Fertility Centre)
2. Chronic (curative) care, n = 1 a. Nursing care & Rehab
i. Columbia Asia Extended Care Hospital
3. Establishment changed to maternity home, n = 1
a. Poliklinik Kotaraya & Klinik Pakar Wanita
4. Licensed as hospital started year 2011, n = 1
a. Bintulu Medical Centre 1. Zero beds, n = 1
a. Hospital Tuaran
2. Chronic (curative) care, n = 5 a. Leprosy, n = 1
i. Rajah Charles Brooke Memorial Hospital
b. Psychiatry, n = 4
ABBREVIATIONS
ABG Arterial Blood Gas
ALOS Average Length of Stay
APS Acute Pain Services
BOR Bed Occupancy Rate
CCU Coronary Care Unit
CDR Cytotoxic Drugs Reconstitution CRC Clinical Research Centre
CRF Case report form
CS Caesarean Section
CT Computed Tomography
DOS Department of Statistics ECT Electroconvulsive Therapy
FBC Full Blood Count
GA General Anaesthesia
GICU General Intensive Care Unit
HDU High Dependency Unit
IGRT Image-Guided Radiotherapy IMRT Intensity Modulated Radiotherapy
LA Local Anaesthesia
MMA Malaysian Medical Association MNNR Malaysian Neonatal Registry
MOH Ministry of Health
MREC MOH Medical Research And Ethics Committee
MRG Malaysian Research Grant
MRI Magnetic Resonance Imaging
NHEWS National Healthcare Establishments And Workforce Survey NHSI National Healthcare Statistics Initiatives
NICU Neonatal Intensive Care Unit NMRR National Medical Research Register
OECD Organisation For Economic Co-operation And Development
OPD Outpatient Department
OR Operating Room
OSCC One Stop Crisis Centre
OT Operating Theatre
OCA Patient-controlled Analgesia Pump PET Positron Emission Tomography PHDW Paediatric High Dependency Ward PICU Paediatric Intensive Care Unit PMP Per Million Population
PPH Post Partum Haemorrhage
SCN Special Care Nursery
SDP Source Data Provider
SVD Spontaneous Vertex Deliveries
TOI Turnover Interval
WPKL Wilayah Persekutuan Kuala Lumpur
CHAPTER 1
|
OVERVIEW ON HOSPITALS AND SPECIALISTS SERVICES IN MALAYSIA
Goh PP1, Sivasampu S1*, Arunah C1, Tahrani PK1, Kamilah D1, Faizah A1, Fatihah M1.1. Clinical Research Centre, Ministry of Health * Corresponding author.
This second NHEWS technical report aims to review current status and capture consistent data regarding characteristics of both public and private healthcare establishments and services in Malaysia in the year 2010. The information gathered in the second year can now be compared to the first year to further improve quality and benchmark ourselves with international standards. Seven specialist services which were identified as priority fields under the 10th Malaysia Plan were reported in 2010. This includes Obstetrics, Paediatrics, Anaesthesiology, Emergency Medicine,
General Surgery, Psychiatry, and Oncology.
Unlike our previous report, the 2010 report has information pertaining to each chapter and has further refined our fundamental variables. This is a result of active steps taken to improve the consistency of the data overtime. We have also analysed the data in a categorised manner according to specialist and non specialist hospitals. For the first time, we were able to report hospital efficiency markers that are crucial for policy makers. Reporting methods were also manipulated according to chapters instead of using a standard denominator for all the fields.
A total of 337 hospitals provided acute curative services in Malaysia in 2010 with 0.12 hospitals per 10,000 population. There have been no major changes in the concentration of hospitals in the different states when compared to our last report. For the purpose of this survey carried out in 2010, we have also included maternity homes in our sampling frame as these centres share the responsibility and workload of providing obstetrics services in the country. This year, we have also managed to capture the absolute number of practicing physicians in hospitals according to different specialties. Data recorded was painstakingly verified and matched against data from the National Specialist Registry, Medical Development Division and Training Management Division of MOH and many other reliable sources.
As mentioned earlier, we have included 22 maternity homes together with the 315 hospitals that provide obstetrics services for the purpose of this survey. Similar to what was done last year, data on facilities, activities and workforce was documented and analysed. Now that we can compare with last year’s findings, we can report an upward trending, an overall increase in the rate of Caesarean sections with a notable decline in vaginal deliveries. This trend is somewhat worrying. When the instrumental deliveries category was introduced in the 2010 survey, we noted a sharp differential, with private hospitals performing five-fold more such procedures than public hospitals.
Due to the rather comprehensive paediatrics chapter in this year’s report, we were compelled to compare recent data we had collected against that of the established paediatric norms in the country. This comparison was then used to identify many areas of need and to highlight the workforce shortages faced by the paediatric community. Arising from this, a preliminary workforce estimates and supply projections data was compiled based on the projected needs of the country and the current number of medical officers, trainees and specialists.
At first glance of our anaesthesiology chapter, the number of ICUs in the private sector may appear to be more than the numbers found in the public sector. However, on closer examination, the public hospitals have provided for a bigger number of cases with a higher level of ICU care when compared with those of the private sector. The anaesthesiologist to population and surgeon ratio was also below ideal international standards in both sectors.
Emergency medicine and trauma services are widely available in most hospitals in the country. However, varied practices in implementing these services in both private and public hospitals have resulted in different reporting arrangements. The lack of uniformity proved to be a major limitation in reporting this chapter. Despite the extensive availability of service, Malaysia still has inadequate numbers of emergency services and prehospital care to cater to the needs of the population. More often than not, this will result in overcrowding of emergency centres, especially those in the public sector, already hard pressed to cope with the rising trend in admissions. There were 93 emergency physicians practicing in the public hospitals in 2010 with no similar expertise available in the private hospitals.
For the first time, we are able to report on common procedures that were performed in general surgery. This includes appendicectomies, laparotomies, inguinal hernia surgeries, cholecystectomies and thyroidectomies. We also noted that a higher percentage of these surgeries were done as open procedures and that the percentage that was performed as laparoscopic procedures was still minimal with the exception of cholecystectomies. We were also able to report that there was a wide variation of practices pertaining to these procedures that were noted between sectors and between those performed in different states. In tandem with the Ministry of Health’s policy to quantify quality and performance indicators, we were able to capture variables such as elective operating hours for each facility and to analyse it based on the number of surgeons in the country. Another important indicator that was recorded was the perioperative mortality.
1
Over
view on Hospitals and Specialists Ser
vices in Mala
In 2010, psychiatric services was introduced as a new chapter in our survey in line with the Ministry’s approach to address the burgeoning challenges of mental health issues in Malaysia. We strived to document facilities providing psychiatric services and to capture some crucial activities concerning the field of psychiatry in both the private and public hospitals. We found considerably varied distribution of psychiatrists across the states. Any shortfalls in the availability of resources for providing mental health services that has been highlighted in our write-up will need to be addressed.
Oncology services in Malaysia have become increasingly important with cancer having been identified as one of the leading causes of death in MOH hospitals each year. However, there were only 55 hospitals providing oncology services in 2010, of which 28 were from public sector hospitals and 27 from private. These oncology centres were mainly found in the west coast of Peninsular Malaysia. In this survey, we did not capture the workload of oncology as we were more focused on reporting the availability of facilities, workforce and the oncology devices instead. However, as a point of interest, we note that there was a mismatch between workforce personnel, especially radiation therapists, and the limited number of oncology devices in the service.
Important imaging devices such as CT and MRI scanners were again recorded and analysed in this year’s report. We have also included PET scanners as it is another integral form of imaging. Other devices such as ventilators and ECT machines are discussed in the respective chapters. In our appendices, we have also included the number of specialists available in the various specialties and subspecialties other than the 7 fields mentioned above (Appendices 4 and 5).
CHAPTER 2
|
HOSPITAL SERVICES IN MALAYSIA
Sivasampu S1*, Akma NY2, Laili MM2, Afidah A3, Fatihah M1*, Faridah O4, Ruby N5.1. Clinical Research Centre, Ministry of Health 2. Medical Development Division, Ministry of Health 3. Medical Practice Division, Ministry of Health 4. Nursing Division, Ministry of Health 5. Association of Private Hospitals Malaysia.
* Corresponding author.
Summary: There were a total of 337 hospitals providing acute curative services in Malaysia in 2010. Acute hospitals in this chapter have been grouped into three categories, namely non specialists, specialists and maternity centres. There are 134 hospitals in the public and 203 in the private sectors. Although there are more hospitals in the private sector, the number of beds in public hospitals (n=36,256) is more than that in the private hospitals (n=12,605). The number of practising medical doctors in hospitals in 2010 is 14,183, which gives a density of 5.01 doctors per 10,000 population. The average density of practising medical doctors in acute hospitals was still lower than international standards. This chapter also shows the distribution and density of nurses, assistant medical officers together with a selected group of allied health personnel working in the hospital setting. Finally, three diagnostic technologies in hospitals were reported - computed tomography (CT) scanners, magnetic resonance imaging (MRI) machines and positron emission tomography (PET) scanners.
There were a total of 337 hospitals providing acute curative services in Malaysia in 2010 (Table 2.1) as compared to 334 reported in 2008-2009 report. The additional one public hospital, namely Hospital Jabatan Kemajuan Orang Asli, which was under the Ministry of Rural and Regional Development was not included in the survey in 2009. There were an additional net of two new private hospitals operational compared to that reported in 2008-2009.
There was only one hospital in Perlis and this was in the public sector. The state having the lowest density of hospitals in the country, i.e 0.04 hospitals per 10,000 population). There were 41 hospitals in WPKL, with the highest density in the country, i.e. 0.24 hospitals per 10,000 population. Distribution of respondents and non respondents of acute care services by sector:
The overall response rate for 2010 was 75.4%. In general, there was a 100% response rate for the public hospitals (MOH, Orang Asli and teaching university hospitals) compared to 59.1% from hospitals in the private sector. The response rate for private hospitals in Terengganu, Melaka, Kelantan, Sabah and WP Labuan was 100%. However, only a 45% response rate was received from private hospitals in Selangor and Johor. It was noted that many of the non responders from the private sector were from maternity centres.
We have categorised the hospitals into three main types, namely (Table 2.2) • Non specialist hospital
The non specialist hospital is defined as hospital without resident/permanent specialists. This type of hospital is mainly seen in the public sector. There is only one hospital in the private sector that fall into this category.
• Specialist hospitals
Specialist hospitals are hospitals that provide secondary and tertiary services. Specialised medical institutions/specialist hospitals provide services in specific disciplines. Examples of hospitals that fall into this category include the National Heart Institute, Tun Hussein Onn Eye Hospital in the private sector and the Institute of Respiratory Medicine in the public sector.
• Maternity centres are centres that provide obstetric or delivery services. They are all in the private sector.
For the purpose of this report, entrepreneurship will refer to ownership of the hospitals. In 2010, the majority of private hospitals were owned by share holders of corporate entities (84.73%) with a smaller number owned by sole proprietorship (13.3%). There were only 2 hospitals in Malaysia that were reportedly owned by societies and these were the charity hospitals (Table 2.3).
SECTOR RESPONDENTS NON RESPONDENTS TOTAL
NO. PERCENTAGE (%) NO. PERCENTAGE (%)
Public 134 100 0 0 134
Private 120 59.11 83 40.89 203
University 3 100 0 0 3
Total 254 75.4 83 24.6 334
Hospital Ser
vices in Mala
ysia
Activities
The total number of inpatient beds in 2010 was 48,861, as compared to 47,586 in 2008-2009, an increase of 1275 beds. The increase was mainly seen in the private sector (n=764 beds, 6.06%). In the public sector, there was an increase in 511 beds (1.41%).
Under the 10th Malaysian Plan (10MP), the proposed bed to population ratio is 2 per 1,000 population1. Results from the 2010 survey showed
that the density of beds in the country is 1.72 beds per 1,000 population) (Table 2.4).The definition on inpatient beds is provided in Appendix 4. States exceeding the proposed norms of 2 beds per 1,000 population were WPKL, Pulau Pinang and Melaka. States with lowest beds per 1,000 population were Sabah/WP Labuan and Terengganu. In comparison, Organisation for Economic Co-operation and Development (OECD) countries reported an average of 4.9 beds per 1,000 population2.
The number of patient admissions to hospital was 3,151,745 in 2009 and in 2010 was 3,330,470. This showed an increase of 5.4%. This increase is more obvious in the private sector (11.6%) when compared to the public side (2.5%). The increase in admissions is most obvious in Johor (57.3% increase) (Table 2.5). Admission rate per day in the public side was three fold higher (average of 6263.2 admissions per day) when compared to the private sector (2,861.3 admission per day) in 2010.
The average reported bed occupancy rate (BOR), calculated from all the hospitals in Malaysia in 2010 was 48.9%. It ranged from 40% (Sarawak) to 67.4% (Perlis) (Table 2.6). The BOR by functional categories of public specialist hospitals in 2010 was 68.7% and 47.2% for public non specialist hospitals (Table 2.7). The MOH annual report 2009 data collected from Health Informatics Centre, BOR for non specialist public hospitals was 50.02% in 20093.The low BOR for private hospitals in 2010 can be explained partly by the fact that some private hospitals provided the total
number of inpatient beds including the non functioning beds when reporting the bed complement for their establishment.
In comparison, the total average length of stay (ALOS) over the 2-year period had reduced from 3.23 days in 2009 to 3.03 days in 2010 (Table 2.6). When reporting by functional categories, it was not surprising that maternity centres that were involved mainly in provision of maternity services had a lower ALOS (2.58 days) than the other categories of hospitals. As for specialist hospitals, this report shows that the ALOS in the public hospitals was slightly longer than the private sector (3.82 days compared to 2.87 days respectively) (Table 2.8). Finally, the turn over interval (TOI) for public hospitals showed a slight increase over the 2-years period (Table 2.9). We are unable to report the TOI for the private sector in 2010 as the data was not reliable.
There was a 22% increase in the number of computed tomography (CT) scanners in the private sector over the 2-year period. Alternatively, there was a net decrease of one CT scanner observed in the public hospitals. Recently, the MOH introduced a new policy that states all public hospitals with a resident radiologist will have a CT scan machine (Table 2.10)4. The frequency of CT scan procedures has increased from 145.6 in 2009 to
171.1 procedures per 10,000 population in 2010.
By comparison, the number of magnetic resonance imaging (MRI) machines has increased over the same period resulting in a density of 3.8 machines per million population. All states had at least one MRI machine, with most of the machines located in WPKL, Selangor and WP Putrajaya. However, this density was still below the OECD average MRI scanner density reported in 20095. The total number of MRI procedures has increased
by 14% and this is mainly contributed by more procedures being done in the private sector (Table 2.11). There were 8 positron emission tomography (PET) scanners available in Malaysia in 2010; with 2 machines in public hospitals and the remainder in private hospitals. These machines were all found in the west coast of Peninsular Malaysia, which is in Pulau Pinang, Selangor and WPKL (Table 2.12).
Healthcare workforce
In this survey, medical doctor refers to medical officer and specialist. There were a total of 14,183 medical doctors working in public (76.3%) and private hospitals (23.7%) in Malaysia in 2010 with a density of 5.01 doctors to 10,000 population. WPKL (18.74), Pulau Pinang (7.04) and Melaka (6.03) were among the states with higher ratio of doctors to 10,000 population while Sabah (2.18) and Sarawak (3.13) have the lower ratio (Table 2.13)
The distribution of medical officers and specialists are as shown below:
SECTOR NUMBER OF MEDICAL OFFICERS (%) NUMBER OF SPECIALISTS (%)
Public 7089 (94.1%) 3737 (56.2%)
Private 446 (5.9%) 2911 (43.8%)
There were 52,071 staff nurses in 2010, of which 39,077 (75.1%) worked in public, and 12,994 (24.9%) worked in the private sectors. Among the staff nurses working in public hospital, 12,115 (31%) had post basic and 26,962 (69%) had no post basic training. Among the staff nurses who worked in the private hospitals and maternity centres, 2,996 (23.1%) had post basic training and 9,998 (76.9%) had no post basic training. The ratio of nurses to 10,000 population in Malaysia in 2010 was 5.3 per 10,000. Amongst the 14 states, WPKL had the highest number of nurses with post basic training, n=1,774 (10.6 nurses per 10,000 population) (Table 2.13)
The total number of male nurses in Malaysia in 2010 was 1,141, of which 766 (67.1%) male nurses worked in the public sector. The majority of male nurses (n=289, 25.3%) were working in hospitals located in WPKL. The Nursing Division of MOH has set a standard that 10% of total nurses should be male6. Most of these male nurses were working in the emergency and trauma departments or orthopaedic wards in Malaysian
hospitals (Table 2.13)
There were a total of 8,429 community nurses, of which 8,085 (95.9%) worked in the public sector and 344 (4.1%) in the private sector. The density of community nurses to 10,000 population in the country was 2.97 per 10,000. It was highest in Sarawak (5.68). The total number of assistant nurses was 2,794 in 2010; of which 575 worked in the public and 2,219 worked in the private sector. MOH has taken measures to upgrade assistant nurses to staff nurses. This has resulted in a decrease in the number of assistant nurses (Table 2.14). The survey showed that only Hospital Fatimah in Perak and Hospital Tung Shin in WPKL are still offering training for assistant nurses.
The total number of assistant medical officers (AMO) was 5,672. There is 1 AMO to 5 staff nurses working in hospitals in 2010. The majority (n=5,607, 99%) of AMOs was working in the public sector and a total of 2,119 (37%) AMOs throughout the country had post basic training (Table 2.15). This chapter also has tables that report the number of pharmacists, physiotherapists, occupational therapists and dietitians that are practicing in Malaysian hospitals by sector and states (Table 2.16). Physiotherapists and occupational therapists may be working in non-hospital settings or are freelancing in the private sector and this survey may not have captured the actual number of physiotherapists and occupational therapists. Table 2.17 highlights the number and density of medical record and medical social officers working in hospitals in Malaysia. There appears to be more medical record officers in the private sector compared to the public sector.
Limitations
1. Different arrangements in the reporting of inpatient beds. Some report total number of beds or licensed beds, while others report only the functioning beds. As a result, hospitals which report functioning beds will have a higher bed occupancy rate as compared to hospitals which report total or licensed beds.
2. The turnover interval for private hospitals appears to be inaccurate; therefore the data from private hospitals couldn’t be reported.
3. There might be some under-reporting in the number of physiotherapists, occupational therapists and medical social workers as the English to Bahasa Malaysia language translation of the survey forms for these categories of staff seem to reflect that only the officers need be reported. Therefore, it might be that some hospitals, especially those in the public side, would be reporting their degree holders only and not the total number that should include the degree and diploma holders.
References
1. The Economic Planning Unit, Prime Minister’s Department, 2010. Tenth Malaysia Plan 2011-2015. Putrajaya. 2. Health at a Glance 2011: OECD Indicators. Available from:
http://www.oecd-ilibrary.org/social-issues-migration-health/health-at-a-glance-2011_health_glance-2011-en 3. Ministry of Health Malaysia Annual Report 2009. Available from:
http://www.moh.gov.my/imaged/gallery/publications/md/ar-2009).
4. Ministry of Health Malaysia Policy Policy for computed tomography (CT) scan 2011 (unpublished). 5. Health at a Glance 2009: OECD Indicators. Available from:
http://www.oecd-ilibrary.org/social-issues-migration-health/health-at-a-glance-2009_health_glance-2009-en;jsessionid=211inf11kou55.epsilon 6. World Health Organization (WHO) – Malaysia. Country Cooperation Strategy 2009-2013. Hospital Ser
vices in Mala
ysia
Table 2.1 Number and Density of Acute Hospitals in Malaysia by State and Sector, 2009 and 2010
Malaysia Public 133 - 134
-Malaysia Private 201 - 203
-Malaysia Total 334 0.12 337 0.12
Perlis Public 1 - 1
-Perlis Private na na na na
Perlis Total 1 0.04 1 0.04
Kedah Public 9 - 9
-Kedah Private 11 - 10
-Kedah Total 20 0.1 19 0.10
Kedah & Perlis Public 10 - 10
-Kedah & Perlis Private 11 - 10
-Kedah & Perlis Total 21 0.1 20 0.09
Pulau Pinang Public 6 - 6
-Pulau Pinang Private 23 - 23
-Pulau Pinang Total 29 0.18 29 0.19
Perak Public 14 - 14
-Perak Private 15 - 15
-Perak Total 29 0.12 29 0.12
Selangor & WP Putrajaya Public 11 - 12
-Selangor & WP Putrajaya Private 46 - 48
-Selangor & WP Putrajaya Total 57 0.11 60 0.11
WP Kuala Lumpur Public 4 - 4
-WP Kuala Lumpur Private 41 - 37
-WP Kuala Lumpur Total 45 0.26 41 0.24
Selangor & WP Putrajaya & WP KL Public 15 - 16
-Selangor & WP Putrajaya & WP KL Private 87 - 85
-Selangor & WP Putrajaya & WP KL Total 102 0.15 101 0.14
Negeri Sembilan Public 6 - 6
-Negeri Sembilan Private 6 - 8
-Negeri Sembilan Total 12 0.12 14 0.14
Melaka Public 3 - 3
-Melaka Private 4 - 4
-Melaka Total 7 0.09 7 0.09
Johor Public 11 - 11
-Johor Private 29 - 30
-Johor Total 40 0.12 41 0.12
Pahang Public 10 - 10
-Pahang Private 7 - 7
-Pahang Total 17 0.11 17 0.11
Terengganu Public 6 - 6
-Terengganu Private 1 - 1
-Terengganu Total 7 0.07 7 0.07
Kelantan Public 10 - 10
-Kelantan Private 3 - 3
-Kelantan Total 13 0.08 13 0.08
Sabah & WP Labuan Public 22 - 22
-Sabah & WP Labuan Private 6 - 5
-Sabah & WP Labuan Total 28 0.09 27 0.08
Sarawak Public 20 - 20
-Sarawak Private 9 - 12
-Sarawak Total 29 0.12 32 0.13
Table 2.2 Number and Density of Types of Acute Hospital Establishments in Malaysia by State and Sector, 2010
Malaysia Total 76 0.03 175 0.06 13 0.00 73 0.03
Perlis Public 0 - 1 - 0 - 0
-Pulau Pinang Total 2 0.01 15 0.10 5 0.03 7 0.04
Perak Public 9 - 5 - 0 - 0
-Perak Private 0 - 11 - 0 - 4
-Perak Total 9 0.04 16 0.07 0 0.00 4 0.02
Selangor & WP Putrajaya Public 4 - 8 - 0 - 0
-Selangor & WP Putrajaya Private 0 - 31 - 2 - 15
-Selangor & WP Putrajaya Total 4 0.01 39 0.07 2 0.00 15 0.03
WP Kuala Lumpur Public 0 - 3 - 1 - 0
-WP Kuala Lumpur Private 0 - 19 - 4 - 14
-WP Kuala Lumpur Total 0 0.00 22 0.13 5 0.03 14 0.08
Selangor & WP Putrajaya & WPKL Public 4 - 11 - 1 - 0
-Selangor & WP Putrajaya & WPKL Private 0 - 50 - 6 - 29
-Selangor & WP Putrajaya & WPKL Total 4 0.01 61 0.08 7 0.01 29 0.04
Negeri Sembilan Public 3 - 3 - 0 - 0
-Negeri Sembilan Private 0 - 6 - 0 - 2
-Negeri Sembilan Total 3 0.03 9 0.09 0 0.00 2 0.02
Melaka Public 2 - 1 - 0 - 0
-Terengganu Total 4 0.04 3 0.03 0 0.00 0 0.00
Kelantan Public 6 - 4 - 0 - 0
-Kelantan Private 0 - 2 - 0 - 1
-Kelantan Total 6 0.04 6 0.04 0 0.00 1 0.01
Sabah & WP Labuan Public 15 - 7 - 0 - 0
-Sabah & WP Labuan Private 0 - 3 - 0 - 2
-Sabah & WP Labuan Total 15 0.05 10 0.03 0 0.00 2 0.01
Sarawak Public 13 - 7 - 0 - 0
-Sarawak Private 0 - 8 - 1 - 3
-Sarawak Total 13 0.05 15 0.06 1 0.00 3 0.01
Abbreviation: na – not applicable
Hospital Ser
vices in Mala
ysia
Table 2.3 Number and Density of Different Types of Private Hospital’s Entrepreneurship in Malaysia by State, 2010
STATE
NO. OF HOSPITALS IN PRIVATE SECTOR
SOLE
PROPRIETOR PARTNERSHIP CORPORATE BODY SOCIETY
NO. % NO. % NO. % NO. %
Malaysia 203 27 13.30 2 0.99 172 84.73 2 0.99
Perlis na na na na na na na na na
Kedah 10 0 0.00 0 0.00 10 100.00 0 0.00
Kedah & Perlis 10 0 0.00 0 0.00 10 100.00 0 0.00
Pulau Pinang 23 2 8.70 0 0.00 20 86.96 1 4.35
Perak 15 2 13.33 0 0.00 13 86.67 0 0.00
Selangor & WP Putrajaya 48 7 14.58 0 0.00 41 85.42 0 0.00
WP Kuala Lumpur 37 5 13.51 2 5.41 29 78.38 1 2.70
Selangor & WP Putrajaya & WPKL 85 12 14.12 2 2.35 70 82.35 1 1.18
Negeri Sembilan 8 0 0.00 0 0.00 8 100.00 0 0.00
Melaka 4 0 0.00 0 0.00 4 100.00 0 0.00
Johor 30 4 13.33 0 0.00 26 86.67 0 0.00
Pahang 7 3 42.86 0 0.00 4 57.14 0 0.00
Terengganu 1 0 0.00 0 0.00 1 100.00 0 0.00
Kelantan 3 0 0.00 0 0.00 3 100.00 0 0.00
Sabah & WP Labuan 5 0 0.00 0 0.00 5 100.00 0 0.00
Sarawak 12 4 33.33 0 0.00 8 66.67 0 0.00