NATIONAL HEALTHCARE STATISTICS INITIATIVE
Better use of statistics for better policies & health outcomes
NA
TIONAL HEAL
THCARE EST
ABLISHMENTS &
WORKFORCE ST
ATISTICS
PRIMAR
Y CARE
NATIONAL CLINICAL RESEARCH CENTRE
MINISTRY OF HEALTH MALAYSIA
3RD FLOOR, 124, JALAN PAHANG, MMA HOUSE, 53000 KUALA LUMPUR.
TEL:03-40439300 , FAX:03-40439500
www.crc.gov.my
NCRC/HSU/2013.2
EDITED BY:
HWONG WY, SIVASAMPU S,
AISYAH A, SHANTHA KUMAR C,
GOH PP, HISHAM AN
PRIMARY CARE
NATIONAL HEALTHCARE
E S T A B L I S H M E N T &
WORKFORCE STATISTICS
March 2014
© Ministry of Health Malaysia
Published by:
The National Healthcare Statistics Initiative (NHSI) National Clinical Research Centre
National Institutes of Health 3rd Floor, MMA House
124, Jalan Pahang 53000 Kuala Lumpur Malaysia
Tel. : (603) 40439300
Fax : (603) 40439400
e-mail : [email protected]
Website : http://www.crc.gov.my/nhsi
This report is copyrighted. Reproduction and dissemination of its contents in part or in whole for research, educational or
non-commercial purposes is authorised without any prior written permission provided the source is fully acknowledged.
Suggested citation:
Hwong WY, Sivasampu S, Aisyah A, Shantha Kumar C, Goh PP, Hisham AN. National Clinical Research Centre.
National Healthcare Establishment & Workforce Statistics (Primary Care) 2012.
Kuala Lumpur 2014.
This report is also available electronically on the website of the National Healthcare Statistics Initiative at:
http://www.crc.gov.my/nhsi/
Funding:
The National Healthcare Statistics Initiative was funded by a grant from the Ministry of Health Malaysia
TABLE OF CONTENTS
Sampling Frame and Sample Size Calculation vii
Data Collection and Follow-Up viii
CHAPTER 2 | PRIMARY HEALTHCARE ESTABLISHMENTS 3
Types of Private Practice 4
Attendances 4
Electronic Healthcare Computer System 5
Tables for Figures 8
CHAPTER 3 | PRIMARY HEALTHCARE FACILITIES 11
Tables for Figures 13
CHAPTER 4 | PRIMARY HEALTHCARE SERVICES 15
Types of Services 15
Antenatal Care 16
Laboratory Services 16
Operating Days and Operating Hours 17
Tables for Figures 20
CHAPTER 5 | PRIMARY HEALTHCARE WORKFORCE 23
Characteristics of Healthcare Providers: Age, Gender and Years of Experience 23
Working Hours and Full-Time Equivalence 25
Family Medicine Specialists 26
Other Healthcare Professionals 27
Tables for Figures 29
CHAPTER 6 | PRIMARY HEALTHCARE MEDICAL DEVICES 31
Tables for Figures 35
APPENDICES
APPENDIX 1 | ADDITIONAL TABLES 37
APPENDIX 2 | PARTICIPANTS OF NHEWS PRIMARY CARE 2012 39
LIST OF TABLES
Table 2.1. Percent of Clinics with Electronic Healthcare Computer System in 2012 5 Table 2.2. Number of Malaysian Primary Care Clinics per 10,000 Population in 2011 8
Table 2.3. Types of Private Practice by State/Region in 2012 8
Table 2.4. Median Attendances per Clinic per Day by State/Region and Sector in 2011 8
Table 2.5. Percent of Fully Computerised Clinics by Sector in 2012 9
Table 2.6. Types of Computer Usage by Sector in 2012 9
Table 3.1. Types of Facilities by State/Region and Sector in 2012 11
Table 3.2. Distribution of Functioning Ambulances in Public Clinics by State/Region in 2012 12 Table 3.3. Percent of Public Clinics with Laboratory Space and Ambulance Services by State/Region in 2012 13 Table 4.1. Percent of Clinics providing Antenatal Services by State/Region and Sector in 2012 16
Table 4.2. Types of Services Available by Sector in 2012 20
Table 4.3. Types of Laboratory Services by State/Region and Sector in 2012 20
Table 4.4. Number of Operating Days per Week in Private Clinics by State/Region in 2012 20 Table 4.5. Number of Operating Hours per Day in Private Clinics by State/Region in 2012 21 Table 4.6. Types of Operating Hours per Day in Public Clinics by State/Region in 2012 21
Table 5.1. Distribution of Medical Doctors by State/Region and Sector in 2012 23
Table 5.2. Types of Post-Graduate Qualifications for Family Medicine Specialists by Sector in 2012 27 Table 5.3. Distribution of Other Healthcare Professionals by State/Region and Sector in 2012 28 Table 5.4. Age Distribution of Medical Doctors by State/Region and Sector in 2012 29 Table 5.5. Years of Experience of Medical Doctors by State/Region and Sector in 2012 29
Table 5.6. Gender Distribution of Medical Doctors by Sector In 2012 29
Table 5.7. Median Working Hours per Week per Doctor by State/Region and Sector In 2012 30 Table 5.8. Number of Patients Seen per Day per FTE Private Clinic Doctor by State/Region in 2012 30 Table 5.9. Distribution of Family Medicine Specialists by State/Region and Sector in 2012 30 Table 6.1. Distribution of Functioning Medical Devices per Clinic by State/ Region and Sector in 2012 32-34 Table 6.2. Percent of Clinics with Functioning Medical Devices by Sector in 2012 35 Table A1.1. Median Number of Attendances per clinic per year by State/Region and Sector in 2011 37 Table A1.2. Median Number of Attendances (Outpatient, Home Visit, Antenatal Visit) per clinic per year by
State/Region and Sector in 2011
ACKNOWLEDGEMENTS
The National Healthcare Statistics Initiative Primary Care team would like to thank the Director General of Health Malaysia for his continuous support towards this survey and the permission to publish this report.
We would also like to express our sincere appreciation to the following for their participation, assistance, support and contribution:
● Deputy Director General of Health (Research and Technical Support), MOH
● Deputy Director General of Health (Public Health), MOH
● Deputy Director General of Health (Medical), MOH
● Director, National Clinical Research Centre (NCRC), National Institutes of Health (NIH)
● Director, Family Health Development Division, MOH
● Director, Medical Practice Division, MOH
● State level Private Medical Practice Control Units (Unit Kawalan Amalan Perubatan Swasta, UKAPS) of Kelantan, Sabah, Sarawak, Selangor and Wilayah Persekutuan Kuala Lumpur.
● Malaysian Medical Council, Malaysian Medical Association, Academy of Family Physicians Malaysia, National Specialist Register
Our special thanks and gratitude also goes to
● All medical doctors and support personnel from the participating public and private clinics whom have kindly provided data on their respective establishment and workforce
● The team from Family Health Development Division, MOH whom have generously shared data on public primary care establishment and workforce
And all those who have supported or contributed to the success of the NHEWS Primary Care Survey 2012 and the publication of this report
Thank you.
National Healthcare Statistics Initiative (NHSI) Primary Care Team Healthcare Statistics Unit
PROJECT TEAM
Principal Investigator Datuk Dr. Noor Hisham Abdullah
Principal Co-Investigators Dr Sheamini Sivasampu
Dr. Goh Pik Pin
Research Evaluation Committee
Dr Kamaliah Mohd. Noh
Dr. Kaviyarasan Sailin
Professor Dr. Khoo Ee Ming
Associate Professor Dr. Ng Chirk Jenn
Professor Dr. Taufik Teng Cheong Lieng
Associate Professor Dr. Jamaluddin Abdul Rahman
Project Manager Dr. Hwong Wen Yea, Amy
Survey Coordinator Ms. Aisyah Ali
Research Officers Ms. Sharmini Chandran
ABBREVIATIONS AND SYMBOLS
CKAPS Cawangan Kawalan Amalan Perubatan Swasta
CI Confidence Interval
CRF Case Report Form
df Degree of Freedom
DG Director General of Health, Ministry of Health Malaysia
e-CRF Electronic Case Report Form
FAFP Florida Academy of Family Physician
FMS Family Medicine Specialist
FRACGP Fellowship of the Royal Australian College of General Practitioners
FRCGP Fellowship of Royal College of General Practitioners
FTE Full Time Equivalence
GP General Practitioner
IQR Interquartile Range
KK Klinik Kesihatan
MOH Ministry of Health
MRCGP Member of Royal College of General Practitioners
MREC Medical Research Ethics Committee
NA Not Available
NCRC National Clinical Research Centre
NHEWS National Healthcare Establishment and Workforce Survey
NHSI National Healthcare Statistics Initiative
NIH National Institutes of Health
NMCS National Medical Care Survey
No. Number
SD Standard Deviation
UKAPS Unit Kawalan Amalan Perubatan Swasta
WHO World Health Organisation
WP Wilayah Persekutuan
INTRODUCTION
Background
The National Healthcare Statistics Initiative (NHSI) is a family of surveys looking into services, healthcare workforce, processes of care as well as some medical technologies of our dual healthcare system. This initiative is part of the Ministry of Health Malaysia’s (MOH) move towards the availability of better health statistics. Healthcare statistics is a key element of any country’s policymaking, monitoring and evaluation system. NHSI was initiated in 2009 by the National Clinical Research Centre (NCRC) in collaboration with relevant MOH and private sector stakeholders. The Healthcare Statistics Unit (HSU) in NCRC is the program coordinator of this initiative. Over the past 4 years, the NHSI has managed to
gain recognition as a reliable source of healthcare statistics providing useful and timely data which fills the gap between
research and policy.
It is well established that primary care services act as the gatekeeper of any healthcare system. The development of both National Healthcare Establishment and Workforce Primary Care Survey (NHEWS) and National Medical Care Survey (NMCS) was mooted when it was realised that there was very little known at large about the primary care system in Malaysia; especially on the resources and contribution of the private primary care clinics and their providers. Being one of the four surveys in NHSI, the NHEWS Primary Care Survey is in its third year of inception with two prior surveys conducted in 2009 and 2010 respectively. In 2012, the project team had decided to pilot test the revised version of NMCS; hence downsizing NHEWS Primary Care 2012 in terms of national representation.
Objectives
General Objectives
NHEWS Primary Care aims to:
1. determine the availability and distribution of primary healthcare services, facilities and healthcare workforce 2. compare the services, facilities and workforce in primary care between the public and private
3. monitor the trends of the services, facilities and workforce in primary care
4. provide reliable data for the purpose of healthcare planning, policy making and healthcare expenditure
Specific Objectives
METHODOLOGY
General
NHEWS 2012 was a cross-sectional study. Random sampling was performed on the primary care clinics in 5 selected regions which include:
• Kelantan to reflect East Coast of Peninsular Malaysia
• WP Kuala Lumpur, WP Putrajaya and Selangor to reflect West Coast of Peninsular Malaysia
• Kuching and Kota Kinabalu to reflect East Malaysia
Approval for NHEWS Primary Care protocol was granted by MOH Medical Research and Ethics Committee (MREC) in 2010.
Sampling Frame and Sample Size Calculation
The determination of total population for the survey was finalised prior to the initiation of data collection. This involved
record matching of clinics from the NHEWS Primary Care 2010 list against independent databases from Ministry of Health’s Private Medical Practice Control Section (CKAPS) and Family Health Development Division. Checking of duplicates and matching were done by the Information Technology (IT) department. Both matched and unmatched records were then
reviewed by NHEWS Primary Care team and subsequent verification was conducted by contacting each site to confirm their operational status. The review and verification processes were repeated and closed clinics were removed from the
sampling frame.
The inclusion and exclusion criteria for the survey were as stated below:
INCLUSION CRITERIA
• All private medical clinics registered with the Medical Practice Control Section or Cawangan Kawalan Amalan Perubatan Swasta (CKAPS) providing primary care (up to 31st December 2011)
• All MOH Health Clinics (Klinik Kesihatan) delivering outpatient services by medical doctors. (up to 31st December 2011)
EXCLUSION CRITERIA
• Government clinics which fell into the categories of:
- Outpatient departments within public hospitals
- Klinik Kesihatan without medical doctors
- Clinics providing maternal and child health services only (Klinik Kesihatan Ibu dan Anak)
- Rural Clinics (Klinik Desa)
- 1 Malaysia Clinics
- Primary care clinics in universities
• Private Clinics which fell into the categories of: • In-house clinics /company clinics
• Clinics providing specialised care/ Specialist clinics e.g. paediatric, cardiology, occupational therapy • Diagnostic centres
• Aesthetic clinics • Charity clinics
The random sampling method used for sample size calculation was a complex multistage stratified random sampling.
Stages for the sampling involved:
Stage 1: Selection of Sampling Regions (Convenience / Purposive Sampling)
• WP Kuala Lumpur, Selangor and WP Putrajaya, Kelantan, Kuching and Kota Kinabalu
Stage 2: Stratification by Sector
Stage 3: Sampling of Clinics
• Random sampling was done based on random numbers generated from Microsoft Excel. During the sampling, the inclusion and exclusion criteria for both public and private sectors were accounted for.
The table below shows the final calculated sample size:
Sample Size for NHEWS Primary Care 2012
State/Region No. of clinics
Public Private
Selangor & WP Putrajaya 39 187
WP Kuala Lumpur 8 107
These sampled clinics were sent an official invitation letter to attend a briefing. Briefings for government doctors were held on weekdays whereas for private doctors, briefings were conducted on the weekends between June and July 2012.
During the briefings, doctors who attended were given a research pack which contained:
• Call letter for participation of the survey signed by State Director of Health
• Case report form (CRF)
• Username and password for the option of completing the survey form online
• Prepaid envelope
• NHEWS Primary Care 2008-2009 report
Clinics which did not send any representatives for the briefings were contacted by phone in an attempt to persuade them
to participate. Many strategies were carried out to increase the response rate of the sampled private clinics.
These included:
• Establishing buy in from senior management of the chain clinics
• Close cooperation with the state Malaysian Medical Association (MMA) to encourage their members to participate • Conducting private briefings to the doctor/nurse-in-charge of primary care clinics around KL/Selangor region
Once the survey forms were received either by postage or online, two certificates and a copy of the NMCS 2010 report
were sent to the participants as a token of appreciation.
Data Entry
Data received via paper submission were thoroughly reviewed for completeness and consistency prior to data entry into the NHEWS Primary Care database. Data entry was then performed by trained NHEWS Primary Care members. Data entry from participant’s site through eCRF was submitted directly into the NHEWS Primary Care database and monitored in real-time basis by the members of the team. Quality of data entry was constantly checked and maintained by several built-in features in the data entry module such as a compulsory data checking function, inconsistency checks, auto calculations and auto default data from previous year’s survey. Every activity in the database was recorded in a real-time tracking system.
Data Cleaning and Verification
Data cleaning was performed in parallel with data entry based on the results of edit checks. An edit check is a data checking procedure for tracing doubtful data being entered and was performed by NHEWS Primary Care team members who are familiar with primary care settings. A built in data query feature was also created in the web application to cross check data from the same variables in 2010 and 2012. Queries that arose were then attended to by contacting the stated
person-in-charge in the form or other authorised representatives to seek further clarification.
All queries were resolved before the database was locked to maintain data quality and integrity. A final checking was
performed prior to database locking to ensure that the data was acceptable for statistical analysis. The dataset was then standardised by performing data deduplication procedure for removing duplicate records and checking of range and consistency to detect outliers. A protocol with validation rules for cleaning as well as data inconsistency rules have been created for data cleaning. Cross-checking with other relevant data sources such as the Malaysian Medical Council database, National Specialist Register of Malaysia and list of registered family medicine specialists from the Academy of Family Physician Malaysia was performed. Most of the missing or out-of-range mandatory variables and auxiliary variables were resolved during data cleaning stage.
Statistical Analysis
Findings of the survey were primarily reported as descriptive statistics. Statistical analyses were conducted using the IBM SPSS Statistics for Windows, Version 20.0 (Armonk, NY: IBM Corp). Categorical data were reported in rates and
proportions but their respective confidence intervals were not reported as the requirements for inferential statistics
were not met.1 Proportions may not always add up to exactly 100.0% due to rounding of figures. Continuous data were
reported in median and interquartile range (IQR). An analysis to determine if there were any significant differences
between the characteristics of the respondents and non-respondents from the private general practitioners (GPs) namely age, gender and years of practice was also conducted. Categorical variables were compared using the χ2-test whereas for continuous variables; a simple logistic regression.
Ethical Issues
Limitations
1. Only 3 states (Selangor and WP Putrajaya, WP Kuala Lumpur and Kelantan) and 2 regions (Kota Kinabalu and Kuching)
were selected in the survey. The results of this study do not reflect national or state representation for Sabah and
Sarawak.
2. The same sample size calculation was used for both NHEWS Primary Care 2012 and NMCS 2012. Further details of the calculation can be found in the NMCS 2012 report2.
3. The sample was not calculated to represent each type of (Type I to Type VI) clinics in the public sector.
4. The survey was rolled out in July 2012 and hence, data on the number of clinics and total attendances could only be reported as of the year 2011 as those variables were collected yearly. The rest of the variables were reported as of 30th of June 2012.
5. The results could not be inferred to the population because to our best knowledge, there was a lack of a reliable national representation of both health sectors for the purpose of applying survey weights.
References
1. Naing L. Inferential Statistics. Power point presentation. Research Methodology and Basic Biostatistics Workshop, Kuala Lumpur. 23rd-25th
August 2013.
Excluded
*Kuching and Kota Kinabalu regions were taken to represent Sarawak and Sabah respectively
CONSORT DIAGRAM: PRIVATE PRIMARY CARE CLINICS 2012
RESPONSE RATE
The table below shows the response rate for NHEWS Primary Care 2012 Survey:
Response Rate for NHEWS Primary Care 2012 Survey
State/Region Sector Sample size No. of respondents Response rate (%)
Selangor & WP Putrajaya Public 39 34 87.2
Private 187 52 27.8
WP Kuala Lumpur Public 8 8 100.0
Private 107 30 28.0
Kelantan Public 20 18 90.0
Private 57 25 43.9
Kota Kinabalu Public 4 4 100.0
Private 21 9 42.9
Kuching Public 4 4 100.0
Private 11 4 36.4
Overall Public 75 68 90.7
Private 383 120 31.3
The low response rate from private clinics had already been anticipated and accounted for. A few studies which previously surveyed private clinics in Malaysia had also reported similar response rates ranging from 26.3% to 33.0%.1,2 Low response rates in national surveys when physicians were the responders had been associated with many factors such as apathy, lack of incentives and resistant to healthcare surveys especially those conducted by the government.3,4
In view of this, the sampling matrix calculation had included an estimation of a 30.0% drop-out rate from the public and a 70.0% drop-out rate from the private sector.
A subsequent analysis comparing the respondents and non-respondents from private clinics was performed to ensure
that the low response rate has not introduced any form of bias into the findings. As seen from the tables below, no significant differences in terms of age, gender and years of practice between these two GP groups were observed.
Comparison of age between the respondents and non-respondents in the private sector
Characteristics Odds ratio 95% CI for odds ratio χ2 statistics (df) P value
Age 1.01 (0.99, 1.03) 0.27 (1) 0.604
*10 missing variables for non respondents
Comparison of gender between the respondents and non-respondents in the private sector
Characteristics n Respondentsn (%) Non respondentsn (%) χ2statistic (df) P value
Gender
Male 239 76 (31.8) 163 (68.2)
0.04(1) 0.837 Female 134 44 (32.8) 90 (67.2)
*10 missing variables for non respondents
Comparison of years of practice between the respondents and non-respondents in the private sector
Characteristics Odds ratio Odds ratio95% CI for χ2 statistics (df) P value
Years of Practice 1.00 (0.98, 1.03) 0.15 (1) 0.699 *4 missing variables for respondents and 14 missing variables for non respondents
References
1. Teng CL, Tong SF, Khoo EM, Lee V, Zailinawati AH, Mimi O, Chen WS, Nordin S. Antibiotics for URTI and UTI – prescribing in Malaysian primary care settings. Aust Fam Physician. 2011; 40(5):325-9.
2. Mimi O, Tong SF, Nordin S, Teng CL, Khoo EM, Abdul-Rahman A, Zailinawati AH, Chen WS, Shihabudin WM, Noridah MS, Fauziah ZE. A comparison of morbidity patterns in public and private primary care clinics in Malaysia. Malaysian Family Physician. 2011; 6(1):19-25
3. Parsons J, Warnecke R, Czaja R, Barnsley J, Kaluzny A. Factors associated with response rates in a national survey of primary care physicians. Eval Rev. 1994; 18: 756-66.
CHAPTER 1
| OVERVIEW
Primary care provides essential functions for individual patients, health systems and populations. Apart from managing and triaging undifferentiated symptoms and delivering treatment for acute and chronic illnesses, primary care providers also manage many different services which include health promotion, disease prevention, health maintenance, counselling, patient education and many more.1
The Malaysian primary care is of no exception. The two tiered healthcare system i.e. public and private holds an extremely
important position in the delivery of primary care services in Malaysia. This chapter summarises the key findings of
NHEWS Primary Care Survey 2012 by chapters:
Chapter 2: Primary Healthcare Establishments
• There were 5,198 private clinics and 871 public clinics in Malaysia as of 31st December 2011. • Overall, there were 2.1 clinics per 10,000 population in Malaysia.
• 75.0% of the private clinics were solo practices.
• On average, public clinics had a higher total attendances per day compared to the private. The highest ratio was 12:1 (public versus private).
• Only 29.3% of the primary care clinics were fully computerised with the majority coming from private sector.
Chapter 3: Primary Healthcare Facilities
• 55 out of 68 public clinics sampled had a triage system implemented in their clinics.
• None of the private clinics sampled in East Malaysia had a diagnostic imaging/X-ray room in their premises. • All public clinics with an exception of WP Kuala Lumpur (62.5%) had a designated laboratory space. • The median for functioning ambulances per public clinic in the states/regions sampled is 1.0 (IQR 0.0).
Chapter 4: Primary
Health
care Services• Only 16.7% of the private clinics offered smoking cessation programmes as compared to 75.0% in the public. • More than 90.0% of public clinics provided preventive and health promotion services such as obstetric and
gynaecological services, family planning services and clinical breast examinations. On the other hand, private clinics performed more minor surgeries (91.7%) and medical check-ups (98.3%).
• All states and regions sampled had a higher percentage (range: 51.9% - 75.0%) of clinics opening 7 days in a week except for WP Kuala Lumpur where 73.3% of the clinics had less than 7 operating days in a week.
• Only 5.0% of the private clinics in the states/regions sampled were functioning as 24-hour clinics.
Chapter 5: Primary Healthcare Workforce
• The median number of doctors per public clinic was 4.5 doctors (IQR 5.0) and 1.0 doctor (IQR 1.0) per private clinic. • The majority of doctors (61.1%) practising in the public clinics were between the ages of 25-34 years old. By
comparison, 72.1% of the private clinics’ doctors were ≥ 45 years old.
• 75.5% of the doctors in the private sector had more than 10 years of experience in primary care. • Overall, two-third of the doctors in primary care were females.
• Medical doctors from private clinics worked a median of 47.5 (IQR 21.0) hours per week while public clinic doctors had shorter working hours per week with a median of 40.0 (IQR 5.0) hours.
Chapter 6: Primary Healthcare Medical Devices
• Only 51.5% of the public clinics had functioning defibrillators in their premises.
• Less than 15.0% of the private clinics had laboratory equipments such as bilirubinometer or full blood count analysers. • Public clinics had a median of four or more functioning peak flow meters per clinic for every state/region while the
private sector had only a median of one functioning peak flow meter per clinic.
• 71 out of 73 resuscitation trolleys were functioning in the public clinics. Clinics in both public and private sectors had at least one resuscitation trolley per clinic except for private clinics in Kelantan which only had a median of 0.6 (IQR 1.0) resuscitation trolley per clinic.
• About 5.0% of the glucometers in the public clinics were reported to be non-functioning.
Although the survey was restricted to only 3 states and 2 regions sampled, the findings have provided a better understanding
of the primary care services as well as the socio-demographic characteristics of the primary healthcare workforce. These
results, together with the findings of morbidity pattern and processes of care from the National Medical Care Survey
(NMCS) 2012 are hoped to form a clearer picture on the current primary healthcare system in Malaysia.
References
1. Primary Care. American Academy of Family Physicians, 2013. [Viewed 17th October 2013]. Available from: http://www.aafp.org/about/
CHAPTER 2
|
PRIMARY HEALTHCARE ESTABLISHMENTS
Primary healthcare is the foundation of a comprehensive healthcare system for the nation. Its framework is detailed in the 1978 Declaration of Alma-Ata. This includes at least the following 8 areas: identifying, controlling and preventing health conditions through education, adequate nutrition, maternal and child healthcare, immunisation against major infectious diseases, family planning, prevention and control of local endemic conditions, management of common ailments and injuries and provision of essential drugs.1 Primary care serves as the first-contact point and as a gatekeeper to secondary and tertiary health care.2 This highlights the importance of collecting information on the present workforce and health services in primary care for evaluation of the current system as well as in drafting and implementation of future health policies.
The two-tiered healthcare system for primary care in Malaysia; the public and private sectors have provided accessibility to Malaysians for many years. While the public health system is heavily subsidised by the government, the private clinics charge fee-for-service. As of 31st December 2011, there were 5,198 private primary care clinics and 871 public primary care clinics in Malaysia. The ratio of private clinics to public clinics was 6:1. This difference has not changed much from the 6.3:1 ratio reported in 2008-2009.3
In summary there were 2.1 clinics per 10,000 population in Malaysia in 2011 (Figure 2.1). Figure 2.1 also shows a consistently higher number of clinics per 10,000 population in the urban states of which WP Kuala Lumpur had the highest density; 3.7 clinics per 10,000 population. This density however is still low compared to Australia which recorded an average of 6.1 GP practices per 10,000 population in 2002.4
Types of Private Practice
The majority of practices (75.0%) in 2012 were still individual practices. However, there has been an increase in private group practices in all states sampled over the two year period.5 Clinics inWP Kuala Lumpur recorded the highest proportion of group practice at 33.3%. A study in 2003 on physician workforce in Canada reported that the trend of having group practice was more popular among the younger generation of the general practitioners with the aim to achieve a more balanced lifestyle in terms of workload distribution.6 The changing trend towards group practice is also hoped to reduce medical error and negligence in primary care when GPs with different skills and knowledge are brought together for a more comprehensive diagnosis and treatment of patients. Moreover economics wise, forming group practices would allow better equipments and facilities to be built and shared.7
Figure 2.2. Types of Private Practice by State/Region in 2012
Attendances
Despite being outnumbered in terms of quantity of clinics, the public sector is seeing the bulk of primary care patients compared to the private clinics. Our results showed that overall, public clinics had higher attendances compared to clinics in the private sector (Appendix 1 Table A1.1). The difference was obvious in Kota Kinabalu where the number of attendees to the public clinics per day was approximately 12 times more than that of the private clinics (Figure 2.3). The public clinics in Kuching region recorded the highest number of attendees in a day with a median of 463.7(IQR 699.3) attendances per clinic per day.
Figure 2.3. Median Attendances per Clinic per Day by State/Region and Sector in 2011
Electronic Health Care Computer System
Implementation of a computer system and incorporating information technology in healthcare practices is expected to play a vital role in the near future especially to acquire, manage and disseminate knowledge and information.8
Among the benefits of using electronic patient record include more efficient transferability of the records, systematic
record keeping where all results and patient notes are kept together, increasing safety of the records and most importantly, enabling involved GP practitioners to have immediate access to full records.9 Our findings indicate that more than half (52.7%) of the respondents were already using computers in their establishments (Table 2.1). Out of these, only 29.3% of these clinics were fully computerised (patient records, dispensing, billing and registration); most of them from the private sector (Figure 2.4).
Table 2.1. Percent of Clinics with Electronic Healthcare Computer System in 2012
State/Region Sector No. of clinics Clinics with computer system No. Percent (%)
Selangor & WP Putrajaya Public 34 9 26.5
Private 52 41 78.8
Total 86 50 58.1
WP Kuala Lumpur Public 8 4 50.0
Private 30 20 66.7
Total 38 24 63.2
Kelantan Public 18 2 11.1
Private 25 12 48.0
Total 43 14 32.6
Kota Kinabalu Public 4 0 0.0
Figure 2.4. Percent of Fully Computerised Clinics by Sector in 2012
In the public clinics, overall computer usage was 25.0%, which was lower compared with the private clinics (68.3%). Khoo and Tan in 1998 recorded 43.0% of the private clinics having a computer in their premises for a variety of usage including word processing, accounting, recording drug stocks, patient record and research.10 Results from this study show that most of the computers were used for billing purposes (81.7%) and patient’s registration (80.5%) in private clinics (Figure 2.5). Figure 2.5 also shows that public clinics with computers were using the technology mostly for registration (82.4%), keeping patient records and dispensing (both at 76.5%). Despite the implementation of Teleprimary Care (TPC) in the government clinics for the past 7 years, only 88 public primary healthcare facilities were equipped with this system in 2011.TPC allows tele-consultation in real time within the same state, and has the function for electronic health record keeping.11
Findings on types of computer usage by states and sector can be found in Appendix 1 Table A1.3.
Figure 2.5. Types of Computer Usage by Sector in 2012
References
1. Declaration of Alma-Ata. The International Conference on Primary Health Care. Alma-Ata, USSR: World Health Organization, 6-12 September 1978.
2. Starfield B. Primary care: balancing health needs, services, and technology. Revised edition. USA: Oxford University Press, 1998.
3. Clinical Research Centre. National Healthcare Establishment & Workforce Statistics (Primary Care) 2008-2009. Kuala Lumpur 2011. 4. Australian Bureau of Statistics. 8865.0 - Private medical practices, Australia 2001-02. Australia. 18th December 2003.
5. Clinical Research Centre. National Healthcare Establishment & Workforce Statistics (Primary Care) 2010. [unpublished report].
6. Canadian Labour and Business Centre for Task Force Two: A Physician Human Resource Strategy for Canada. Physician workforce in Canada: Literature Review and Gap Analysis. Ottawa, Canada: January 2003. [viewed 18th September 2013] Available from: http://www.effectifsmedicaux.ca/
reports/literatureReviewGapAnalysis-e.pdf
7. Rorem CR. Economics of private group practice. Can Med Assoc J. 1954;70(4):462-6.
8. Stead WW, Lin HS. Computational Technology for Effective Health Care: Immediate Steps and Strategic Directions. National Research Council of the National Academies, Washington, DC: The National Academies Press,2009. [pre publication copy] [viewed 18th September 2013]. Available from http://
www.nlm.nih.gov/pubs/reports/comptech_prepub.pdf
9. Electronic Patient Record. NHS Institute for Innovation and Improvement, 2013. [ viewed 19th September 2013]. Available from: http://www.
institute.nhs.uk/building_capability/technology_and_product_innovation/electronic_patient_record.html.
10. Khoo EM, Tan PL. Profile of general practices in Malaysia. Asia Pac J Public Health. 1998;10(2): 81-87
Tables for Figures
Table 2.2. Number of Malaysian Primary Care Clinics per 10,000 Population in 2011
State No. of clinics Population Per 10,000 population
Malaysia 6,069 2,89,64,300 2.1
WP Kuala Lumpur 635 16,94,500 3.7
Selangor 1,448 55,77,400 2.6
Table 2.3. Types of Private Practice by State/Region in 2012
State/Region No. of clinics Group practice Solo practice
No. Percent (%) No. Percent (%)
Selangor & WP Putrajaya 52 15 28.8 37 71.2
WP Kuala Lumpur 30 10 33.3 20 66.7
Kelantan 25 4 16.0 21 84.0
Kota Kinabalu 9 1 11.1 8 88.9
Kuching 4 0 0.0 4 100.0
Overall 120 30 25.0 90 75.0
Table 2.4. Median Attendances per Clinic per Day by State/Region and Sector in 2011
State/Region Attendances per day
Sector Total attendances per day No. of clinics Median *(IQR)
Table 2.5. Percent of Fully Computerised Clinics by Sector in 2012
Sector No. of clinics with computers Fully computerised clinics
No. Percent (%)
Public 17 2 11.8
Private 82 27 32.9
Total 99 29 29.3
*the denominator is the total number of clinics with computer system in our sample (n=99)
Table 2.6. Types of Computer Usage by Sector in 2012
Sector
No. of clinics with
computer system
Types of computer usage
Registration Patient record Billing Dispensing No. Percent (%) No. Percent (%) No. Percent (%) No. Percent (%)
Public 17 14 82.4 13 76.5 3 17.6 13 76.5
Private 82 66 80.5 49 59.8 67 81.7 37 45.1
CHAPTER 3
|
PRIMARY HEALTHCARE FACILITIES
This chapter examines the availability of facilities in our primary care clinics. There are five variables which are reported
in this chapter; triage system, pharmacy space, imaging and diagnostic room, laboratory space and ambulance services.
Triage system is described as the process of sorting out clients according to their clinical or healthcare needs.1 This is a system which assesses how quickly a patient needs to be treated while ensuring every patient is given a chance for appropriate level of care. Triaging patients was previously done only in hospital emergency departments but of late, the primary care clinics have also implemented this system. One example of effective triaging could be observed in Putrajaya Health Clinic.1 Currently 55 out of 68 public clinics (80.1%) were observed to practise triaging in their clinics. However, this study revealed that Kuching had the least number of public clinics set up with facilities to triage patients (50.0%). As for private sector, the number of clinics offering triaging was even lesser. The highest percentage reported was 34.6% in Selangor & WP Putrajaya (Table 3.1).
In terms of pharmacy space, it is apparent from Table 3.1 that all public clinics had a pharmacy space in their establishments. In the public sector, the supplies of medicines are under the responsibility of the pharmacy department. The general operational policies state that outpatient pharmacy services should be available in public clinics in accordance to the guidelines on the requirement for the pharmacy facilities.2 As for the private sector, almost all the clinics had a dedicated pharmacy space in their clinics (Table 3.1).
Having a diagnostic imaging room would usually mean the clinic provides X-ray services. These X-ray facilities require a
specific room to be built according to the standard requirements.3 The results obtained from the study show that except for public clinics in Kuching, less than 50.0% of the clinics had this facility (Table 3.1). Similarly, very few private clinics reported the availability of this facility. None of the private clinics in East Malaysia had this facility.
Table 3.1. Types of Facilities by State/Region and Sector in 2012
State/Region Sector No. of clinics Triage system Pharmacy space
Diagnostic/
imaging room No facilities*
No. Percent (%) No. Percent (%) No. Percent (%) No. Percent (%)
Selangor &
WP Putrajaya Public 34 25 73.5 34 100.0 12 35.3 0 0.0 Private 52 18 34.6 49 94.2 15 28.8 1 1.9
Total 86 43 50.0 83 96.5 27 31.4 1 1.2
WP Kuala Lumpur Public 8 8 100.0 8 100.0 3 37.5 0 0.0 Private 30 7 23.3 27 90.0 7 23.3 3 10.0
Total 38 15 39.5 35 92.1 10 26.3 3 7.9
Kelantan Public 18 16 88.9 18 100.0 4 22.2 0 0.0 Private 25 6 24.0 25 100.0 2 8.0 0 0.0
Total 43 22 51.2 43 100.0 6 14.0 0 0.0
Kota Kinabalu Public 4 4 100.0 4 100.0 1 25.0 0 0.0 Private 9 3 33.3 9 100.0 0 0.0 0 0.0
Total 13 7 53.8 13 100.0 1 7.7 0 0.0
Kuching Public 4 2 50.0 4 100.0 4 100.0 0 0.0 Private 4 0 0.0 4 100.0 0 0.0 0 0.0
Total 8 2 25.0 8 100.0 4 50.0 0 0.0
The availability of laboratory space and functioning ambulance services were captured only in public clinics as most of the private clinics do not offer these services. All public clinics with an exception of WP Kuala Lumpur (62.5%) had a
specific laboratory space (Figure 3.1). As for ambulance services, WP Kuala Lumpur has implemented call centre services
which provide ambulance services to clinics based on the distance of the primary care clinic to the call centre; hence explaining the low reporting of ambulance services. In addition, two of the states sampled in this survey reported not having fully functioning ambulances. Overall, there was a median of 1.0 (IQR 0.0) functioning ambulances per clinic in the states/regions sampled (Table 3.2). Similarly, the MOH Annual Report has also reported that only 71.0% ambulances were functioning in 2011.4
Figure 3.1. Percent of Public Clinics with Laboratory Space and Ambulance Services by State/Region in 2012
Table 3.2. Distribution of Functioning Ambulances in Public Clinics by State/Region in 2012
State/Region No. of clinics with ambulances No. of functional ambulances Median*(IQR)
Selangor & WP Putrajaya 32 33 1.0 (0.0)
WP Kuala Lumpur 3 3 1.0 (0.0)
Kelantan 17 21 1.0 (0.5)
Kota Kinabalu 4 6 1.0 (1.5)
Kuching 4 4 1.0 (0.0)
Table for Figures
Table 3.3. Percent of Public Clinics with Laboratory Space and Ambulance Services by State/Region in 2012
State/Region No. of clinics Laboratory space Ambulance services
No. Percent (%) No. Percent (%)
Selangor & WP Putrajaya 34 34 100.0 32 94.1
WP Kuala Lumpur 8 5 62.5 3 37.5
Kelantan 18 18 100.0 17 94.4
Kota Kinabalu 4 4 100.0 4 100.0
Kuching 4 4 100.0 4 100.0
CHAPTER 4
|
PRIMARY HEALTHCARE SERVICES
The scope of primary care services has expanded over the years and has been attributed to advancement of technology, increasing burden of disease and greater demands from the public. The Malaysian primary care is of no exception. Khoo et al reported that a comprehensive range of curative, preventive, promotive and rehabilitative services were provided by private general practitioners in Malaysia.1 This chapter will report the type of services provided by both sectors.
Types of Services
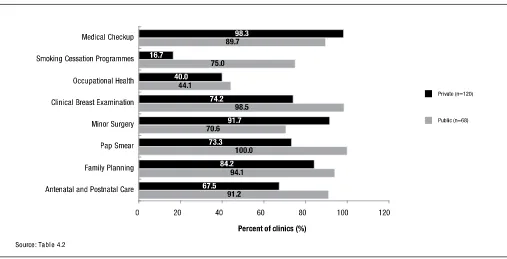
Figure 4.1 shows some of the services available in both sectors in Malaysia. The full range of services as per reported in the survey form can be found in Table 4.2. Overall, public clinics provided majority of the services.
The International Tobacco Control Policy Evaluation Project in Malaysia reported that more than 3/4 of the smoking adults in Malaysia had plans to quit smoking.2 Only 16.7% of the private clinics however, offered smoking cessation programmes in their clinics. The public sector reported a higher proportion (75.0%) of their clinics providing quit smoking services. Apart from that, the availability of occupational health services in our primary care setting was limited; 4 % in public and 40.0% in the private clinics.
It was also observed that more public clinics provided obstetrics and gynaecological services such as antenatal and postnatal care, and Pap smear compared to the private (91.2% versus 67.5% and 100.0% versus 73.3% respectively). Preventive services like clinical breast examination were available in almost all public clinics (98.5%) but only in 74.2% of the private clinics.
Instead, the reverse was seen in services such as minor surgery and medical check-ups. More private clinics (98.3%) offered medical check-ups as opposed to 89.7% of the public clinics. Minor surgery was performed in 91.7% of the private clinics compared to only 70.6% in the public clinics.
Figure 4.1. Types of Services Available by Sector in 2012
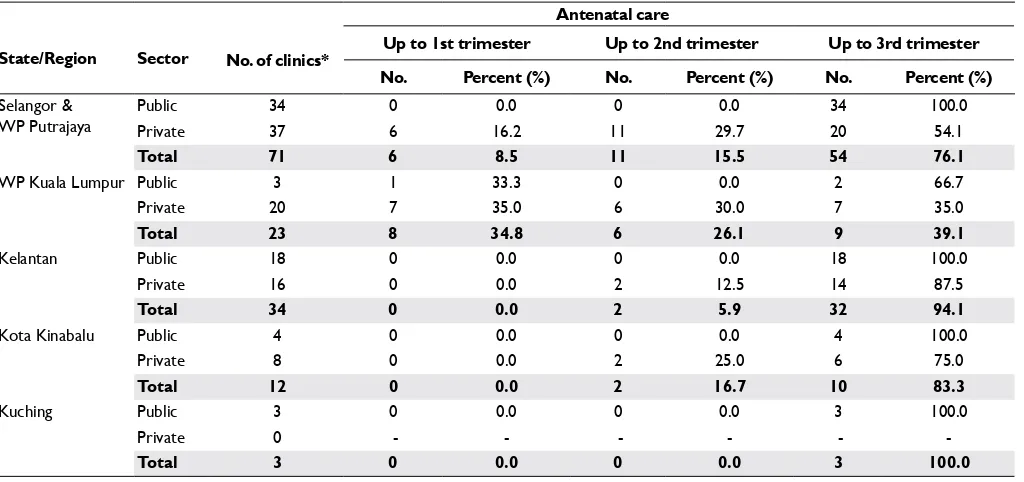
Antenatal Care
All public clinics in the selected states/regions except for WP Kuala Lumpur recorded a complete pregnancy care services (Table 4.1). By comparison, private clinics had different level of antenatal services ranging from 1st trimester only to a 3rd trimester care. None of the private clinics in Kuching offered antenatal services.
Table 4.1 Percent of Clinics providing Antenatal Services by State/Region and Sector in 2012
State/Region Sector
Antenatal care
No. of clinics* Up to 1st trimester Up to 2nd trimester Up to 3rd trimester No. Percent (%) No. Percent (%) No. Percent (%)
Selangor &
WP Putrajaya PublicPrivate 3437 06 16.20.0 110 29.70.0 2034 100.054.1
Total 71 6 8.5 11 15.5 54 76.1
WP Kuala Lumpur Public 3 1 33.3 0 0.0 2 66.7
Private 20 7 35.0 6 30.0 7 35.0
Total 23 8 34.8 6 26.1 9 39.1
Kelantan Public 18 0 0.0 0 0.0 18 100.0
Private 16 0 0.0 2 12.5 14 87.5
Total 34 0 0.0 2 5.9 32 94.1
Kota Kinabalu Public 4 0 0.0 0 0.0 4 100.0
Private 8 0 0.0 2 25.0 6 75.0
Total 12 0 0.0 2 16.7 10 83.3
Kuching Public 3 0 0.0 0 0.0 3 100.0
Private 0 - - -
-Total 3 0 0.0 0 0.0 3 100.0
Note: The Maternal and Child Health services in WP Kuala Lumpur is offered by the Local Municipality (DBKL); hence the low availability of the number of MOH clinics in this region.
*Total number of clinics offering antenatal services only
Laboratory Services
As for laboratory services, 37.5% of the public clinics in WP Kuala Lumpur fully out-sourced their laboratory services. The laboratory services for public clinics in Kota Kinabalu region were noted to be in-house only. The distribution of different types of laboratory services offered in public clinics from other states and regions is shown in Figure 4.2.
Majority of the laboratory services in the private clinics were out-sourced; the highest percentage (79.3%) was in WP Kuala Lumpur (Figure 4.3).
Figure 4.3 Types of Laboratory Services in Private Clinics by State/Region in 2012
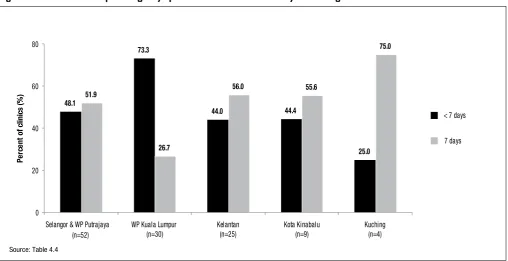
Operating Days and Operating Hours
In terms of operating days per week for private clinics, majority of the clinics operated for seven days per week. Interestingly, 22 out of 30 clinics (73.3%) from WP Kuala Lumpur opened for less than seven days per week (Figure 4.4).
In addition to operating days, this study also looks into operating hours per day. Results from this study reflect a preference
of the private clinics to operate for less than 24 hours (Figure 4.5). All private clinics in WP Kuala Lumpur and Kuching reported operational hours of less than 24 hours. In summary, only 5.0% of private clinics in the sample were opened for 24 hours. It has been observed in developed countries that doctors especially the younger ones are opting to work fewer hours compared to the past.3
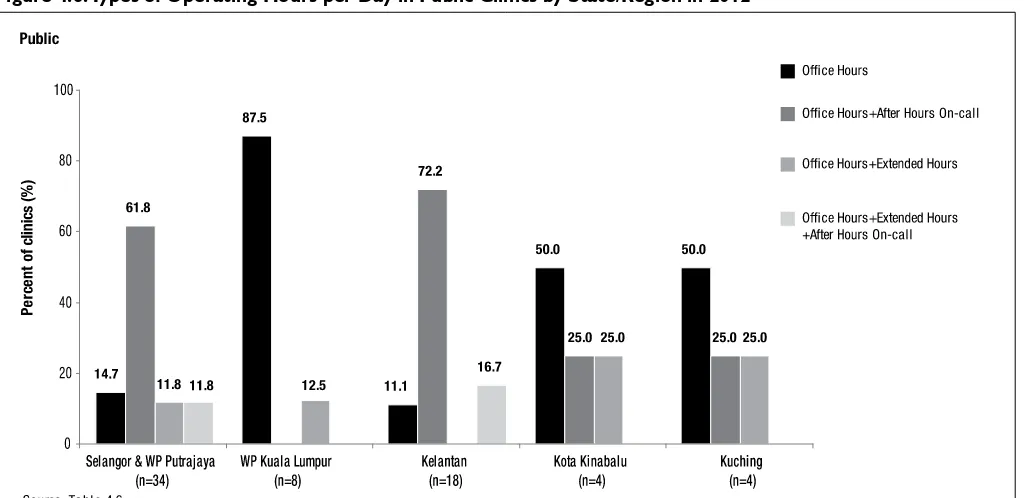
As for the public clinics, the operating hours were separated into three categories; office hours, after hours on-call
services and extended hours. The extended hours and after hours on-call services were introduced with the intention to decongest the hospital emergency department.4 In Selangor & WP Putrajaya and Kelantan, 61.8% and 72.2% of the public
clinics were opened not only during office hours but also offered after hours on-call services (Figure 4.6). Majority of the public clinics in WP Kuala Lumpur, Kuching and Kota Kinabalu however, were only opened during office hours; the highest
proportion seen in WP Kuala Lumpur (87.5%).
Figure 4.5. Number of Operating Hours per Day in Private Clinics by State/Region in 2012
References
1. Khoo EM, Tan PL. Profile of general practices in Malaysia. Asia Pac J Public Health. 1998;10(2): 81-87
2. ITC Project (March 2012). ITC Malaysia National Report. Findings from Wave 1 to 4 Surveys (2005–2009). University of Waterloo, Waterloo, Ontario, Canada; Universiti Sains Malaysia, Pulau Pinang, Malaysia; and Ministry of Health, Putrajaya, Malaysia.
3. Canadian Labour and Business Centre for Task Force Two: A Physician Human Resource Strategy for Canada. Physician workforce in Canada: Literature Review and Gap Analysis. Ottawa, Canada: January 2003. [viewed 18th September 2013] Available from: http://www. effectifsmedicaux.ca/r eports/literatureReviewGapAnalysis-e.pdf
TABLES FOR FIGURES
Table 4.2. Types of Services Available by Sector in 2012
Services Public clinics Private clinics
No. Percent (%) No. Percent (%)
(n= 68) (n=120)
Acute Illnesses 68 100.0 120 100.0
Chronic Diseases 67 98.5 116 96.7
Antenatal and Postnatal Care 62 91.2 81 67.5
Family Planning 64 94.1 101 84.2
Pap Smear 68 100.0 88 73.3
Minor Surgery 48 70.6 110 91.7
Laboratory Services 66 97.1 107 89.2
Clinical Breast Examination 67 98.5 89 74.2
Occupational Health 30 44.1 48 40.0
Smoking Cessation Programmes 51 75.0 20 16.7
Dispensing 0 0.0 120 100.0
Medical Checkup 61 89.7 118 98.3
Table 4.3. Types of Laboratory Services by State/Region and Sector in 2012
State/Region Sector clinics** No. of
Laboratory services
In-house only Out-sourced only In house and out-sourced No. Percent (%) No. Percent (%) No. Percent (%)
Selangor &
Kelantan Public 18 9 50.0 0 0.0 9 50.0
Private 23 2 8.7 15 65.2 6 26.1
Total 43 11 25.6 15 34.9 15 34.9
Kota Kinabalu Public 4 4 100.0 0 0.0 0 0.0
Private 9 0 0.0 7 77.8 2 22.2
Total 13 4 30.8 7 53.8 2 15.4
Kuching Public 4 2 50.0 0 0.0 2 50.0
Private 3 1 33.3 2 66.7 0 0.0
Total 8 3 37.5 2 25.0 2 25.0
Table 4.5. Number of Operating Hours per Day in Private Clinics by State/Region in 2012
State/Region No. of clinics
Operating hours
Less than 24 hours 24 hours
No. Percent (%) No. Percent (%)
Selangor & WP Putrajaya 52 48 92.3 4 7.7
WP Kuala Lumpur 30 30 100.0 0 0.0
Kelantan 25 24 96.0 1 4.0
Kota Kinabalu 9 8 88.9 1 11.1
Kuching 4 4 100.0 0 0.0
Table 4.6. Types of Operating Hours per Day in Public Clinics by State/Region in 2012
State/Region No. of clinics
Operating hours
Office hours only Office hours and after hours on-call
Office hours and
extended hours
Office hours, after
hours on-call and extended hours No. Percent (%) No. Percent (%) No. Percent (%) No. Percent (%)
Selangor &
WP Putrajaya 34 5 14.7 21 61.8 4 11.8 4 11.8 WP Kuala Lumpur 8 7 87.5 0 0.0 1 12.5 0 0.0
Kelantan 18 2 11.1 13 72.2 0 0.0 3 16.7
Kota Kinabalu 4 2 50.0 1 25.0 1 25.0 0 0.0
CHAPTER 5
|
PRIMARY HEALTHCARE WORKFORCE
Healthcare workforce is a vital building block in the delivery of an efficient primary care system. This chapter reports the
number of healthcare workforce which includes the medical doctors, specialists, nurses and allied healthcare personnel working in the primary care. In addition, we will able to show the demographic characteristics and individual workload of the primary care doctors.
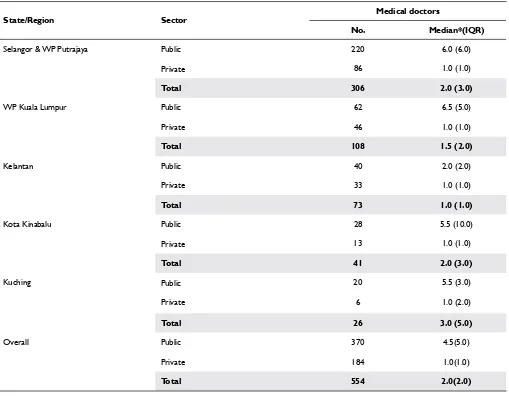
A total of 554 doctors in public and private clinics were reported. Three hundred and seventy doctors were working in 68 public clinics; a median of 4.5 (IQR 5.0) doctors per clinic. Amongst all public clinics, Kelantan registered the least number of doctors per clinic [median: 2.0 (IQR 2.0)] (Table 5.1). As for the private sector, the median was 1.0 (IQR 1.0) doctor
per clinic. This distribution was similar across the states and regions. This correlates with our findings in Chapter 2 that
75.0% of the private clinics were individual practices.
Table 5.1. Distribution of Medical Doctors by State/Region and Sector in 2012
State/Region Sector Medical doctors
No. Median*(IQR)
Selangor & WP Putrajaya Public 220 6.0 (6.0)
Private 86 1.0 (1.0)
Total 306 2.0 (3.0)
WP Kuala Lumpur Public 62 6.5 (5.0)
Private 46 1.0 (1.0)
Total 108 1.5 (2.0)
Kelantan Public 40 2.0 (2.0)
Private 33 1.0 (1.0)
Total 73 1.0 (1.0)
Kota Kinabalu Public 28 5.5 (10.0)
Private 13 1.0 (1.0)
Characteristics of the Healthcare Providers: Age, Gender and Years of Experience
In terms of age distribution, the number of doctors in public clinics was highest at the range of 25-34 years of age and showed a declining trend as the age increased (Figure 5.1). Besides that, the proportion of medical doctors in
the age category of 55-64 years old in some states had increased compared to the findings in NHEWS Primary
Figure 5.1. Age Distribution of Medical Doctors in Public Clinics by State/Region in 2012
On the other hand, the private clinics reported having medical doctors of an older age. Majority of the doctors in the private clinics were between the ages of 45-54 years old (Figure 5.2).
Figure 5.3. Years of Experience of Medical Doctors by State/Region and Sector in 2012
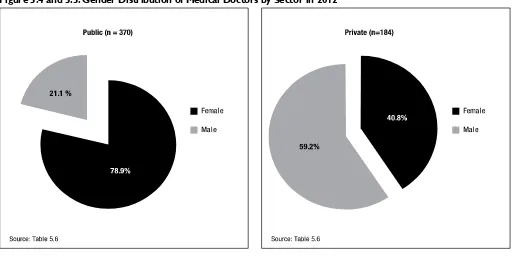
Worldwide, there has been an increase in the number of women in the medical workforce. The proportion of female physicians in Canada for example has risen from only 7.0% in 1961 to 28.0% in 2000.2 Similarly, this phenomenon was observed in this study. In summary, two third of the primary care doctors were females. Seventy eight point nine percent of the doctors working in public clinics were females. On the other hand, a reverse situation was seen in the private where 59.2% of the doctors were male doctors (Figure 5.4 and 5.5).
Figure 5.4 and 5.5. Gender Distribution of Medical Doctors by Sector in 2012
Working Hours and Full-Time Equivalence (FTE)
Figure 5.6. Median Working Hours per Week per Doctor by State/Region and Sector in 2012
The number of patients seen per day per full time equivalence (FTE)* of doctors from the private clinics is displayed in Figure 5.7. FTE for doctors in the public clinics was not analysed as the data for total attendances in the public clinics
were not specific to patients being seen by the doctors. The highest number of patients seen per day per FTE doctor was
44 patients in Kuching region. As observed from Figure 5.7, doctors in WP Kuala Lumpur and Kota Kinabalu saw less than half of the patients compared to their colleagues in Kuching.
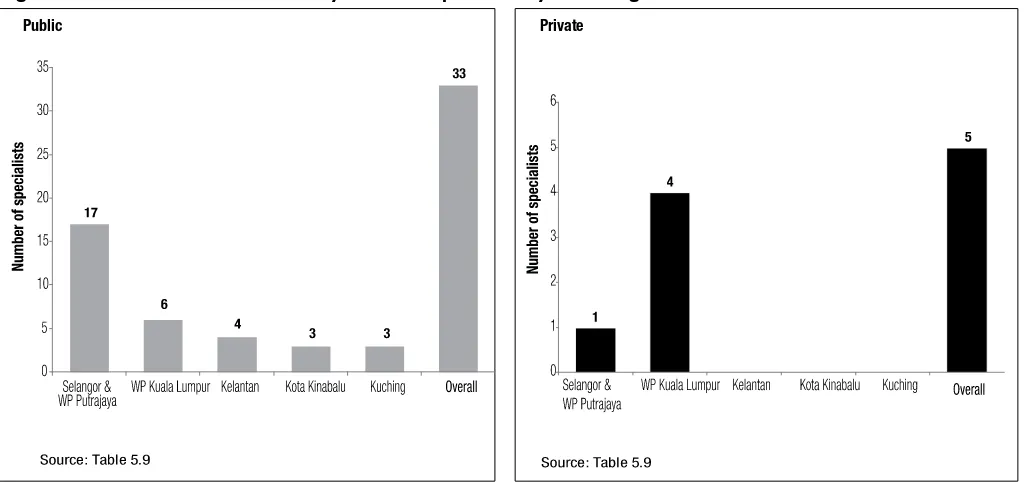
Figure 5.8. & 5.9 Distribution of Family Medicine Specialists by State/Region and Sector in 2012
*2 specialists from other specialties apart from FMS were excluded from the analysis ** number of FMS per all clinics
Table 5.2. Types of Post-Graduate Qualifications for Family Medicine Specialists by Sector in 2012
Qualifications
Sector
Public Private
No. Percent (%) No. Percent (%)
Family Medicine UM/UKM/USM* 31 93.9 0 0.0
FRACGP 2 6.1 5 100.0
FRCGP/MRCGP 0 0.0 2 40.0
Others* 0 0.0 2 40.0
Total 33 100.0 5** 100.0
* Others: MAFP/FAFP
** The sum of all is not equivalent to the total because there were 2 specialists who had both FRACGP/FRCGP and MAFP/FAFP qualifications
Other Healthcare Professionals
Table 5.2 and Table 5.3 show the distribution of the staff nurses, community nurses, nursing aides, pharmacists and assistant
medical officers in the states/regions sampled. The number of qualified staff nurses [median: 13.5 (IQR 2.0)] and assistant medical officers (AMOs) [median: 8.0 (IQR 4.0)] were the highest in the public clinics in Kuching. Kota Kinabalu reported
the highest number of community nurses in the public clinics with a median of 22.0 (IQR 11.0) nurses while WP Kuala Lumpur had the highest number of pharmacists with a median of 4.0 (IQR 4.0) pharmacists. The distribution of nursing aides in the private clinics across the states/regions sampled however, were quite similar [median: 3.0 (IQR 2.0)].
There is an apparent maldistribution of our healthcare workforce. Re-organisation of the current healthcare workforce needs to be reviewed to ensure there are no over-burdened sectors which will hopefully lead to better quality of care for our patients.
Table 5.3. Distribution of Other Healthcare Professionals by State/Region and Sector in 2012
State/
Region Sector
Staff nurses Community nurses Nursing aides Pharmacists Assistant medical officers No. Median* (IQR) No. Median* (IQR) No. Median* (IQR) No. Median* (IQR) No. Median*(IQR)
Selangor &
WP Putrajaya Public 293 8.0 (4.5) 443 11.5 (11.3) - - 81.0 2.0 (2.3) 98.0 3.0 (1.0) Private 19 0.0 (0.0) 0 0.0 (0.0) 184.0 3.0 (2.0) 0.0 0.0 (0.0) 0.0 0.0 (0.0) WP Kuala Lumpur Public 75 8.0 (8.5) 114 14.5 (13.0) - - 39.0 4.0 (4.0) 37.0 5.0 (2.8)
Private 8 0.0 (0.0) 1 0.0 (0.0) 95.0 3.0 (2.0) 0.0 0.0 (0.0) 0.0 0.0 (0.0) Kelantan Public 135 6.5 (2.5) 209 11.5 (8.3) - - 22.0 1.0 (1.0) 57.0 3.0 (2.0)
Private 2 0.0 (0.0) 0 0.0 (0.0) 81.0 3.0 (2.0) 0.0 0.0 (0.0) 0.0 0.0 (0.0) Kota Kinabalu Public 75 7.5 (37.8) 88 22.0 (11.0) - - 12.0 1.5 (5.5) 24.0 5.0 (4.5)
Private 15 0.0 (3.0) 0 0.0 (0.0) 26.0 3.0 (2.5) 0.0 0.0 (0.0) 0.0 0.0 (0.0) Kuching Public 53 13.5 (1.8) 72 17.0 (9.5) - - 13.0 3.0 (2.3) 34.0 8.0 (3.5)
Private 0 0.0 (0.0) 0 0.0 (0.0) 13.0 3.5 (3.3) 0.0 0.0 (0.0) 0.0 0.0 (0.0) *median staff per clinic
References
1. Clinical Research Centre. National Healthcare Establishment & Workforce Statistics (Primary Care) 2010. [unpublished report].
2. Canadian Labour and Business Centre for Task Force Two: A Physician Human Resource Strategy for Canada. Physician workforce in Canada: Literature Review and Gap Analysis. Ottawa, Canada: January 2003. [viewed 18th September 2013] Available from: http://www.effectifsmedicaux.ca/reports/ literatureReviewGapAnalysis-e.pdf
Tables for Figures
Table 5.4. Age Distribution of Medical Doctors by State/Region and Sector in 2012
State/Region Sector doctors No. of
Age category
25-34 35-44 45-54 55-64 ≥65
No. Percent (%) No. Percent (%) No. Percent (%) No. Percent (%) No. Percent (%)
Selangor &
Table 5.5. Years of Experience of Medical Doctors by State/Region and Sector in 2012
State/Region Sector doctorsNo. of
Years of experience in primary care
< 5 years 5-10 years >10 years No. Percent (%) No. Percent (%) No. Percent (%)
Selangor &
WP Putrajaya PublicPrivate 22086 1458 65.99.3 5222 23.625.6 5623 10.565.1
Total 306 153 50.0 74 24.2 79 25.8
WP Kuala Lumpur Public 62 35 56.5 17 27.4 10 16.1
Private 46 2 4.3 4 8.7 40 87.0
Total 108 37 34.3 21 19.4 50 46.3
Kelantan Public 40 25 62.5 9 22.5 6 15.0
Private 33 0 0.0 6 18.2 27 81.8
Total 73 25 34.2 15 20.5 33 45.2
Kota Kinabalu Public 28 21 75.0 5 17.9 2 7.1
Private 13 0 0.0 1 7.7 12 92.3
Total 41 21 51.2 6 14.6 14 34.1
Kuching Public 20 5 25.0 10 50.0 5 25.0
Private 6 2 33.3 0 0.0 4 66.7
Total 26 7 26.9 10 38.5 9 34.6
Table 5.6. Gender Distribution of Medical Doctors by Sector In 2012
Sector doctorsNo. of
Gender
Female Male
No. Percent (%) No. Percent (%)
Public 370 292 78.9 78 21.1
Private 184 75 40.8 109 59.2
Table 5.7. Median Working Hours per Week per Doctor by State/Region and Sector in 2012
State/Region Sector No. of doctors hours per weekTotal working Median*(IQR)
Selangor & WP Putrajaya Public 220 9,502 45.0(5.0)
Private 86 3,763 47.0(25.0)
Total 306 13,265 45.0(5.0)
WP Kuala Lumpur Public 62 2,579 40.0(5.0)
Private 46 2,200 44.0(20.0)
Total 108 4,779 42.5(5.0)
Kelantan Public 40 1,664 40.0(0.0)
Private 33 1,596 48.0(22.0)
Total 73 3,260 40.0(9.0)
Kota Kinabalu Public 28 1,120 40.0(0.0)
Private 13 677 50.0(24.0)
*median working hours per week per doctor
Table 5.8. Number of Patients Seen per Day per FTE Private Clinic Doctor by State/Region in 2012
State/Region Total attendances per day hours per weekTotal working No. of working hours per day per FTE doctorNo. of patients
Selangor & WP Putrajaya 2,265 3,763 578.55 31.3
WP Kuala Lumpur 948 2,200 368.18 20.6
Kelantan 1,006 1,596 246.05 32.7
Kota Kinabalu 260 677 101.26 20.5
Kuching 190 230 34.86 43.6
Note: 1 FTE doctor is equivalent to 1 doctor working 8 hours per day
Table 5.9. Distribution of Family Medicine Specialists by State/Region and Sector in 2012
State/Region Sector No. of clinics Family medicine specialist
No. Median*(IQR)
Selangor & WP Putrajaya Public 34 17 0.0(1.0)
Private 52 1 0.0(0.0)
Total 86 18 0.0(0.0)
WP Kuala Lumpur Public 8 6 1.0(1.0)
CHAPTER 6
| PRIMARY HEALTHCARE MEDICAL DEVICES
Medical devices reported in this chapter are those commonly available in primary care setting and part of the integral component in the process of care. Overall the results (Figure 6.1 and 6.2) show that clinics from the public sector recorded higher percentages in the availability of the surveyed medical devices as compared to the private. Amongst all equipments in the public
clinics, defibrillators were the least available. The proportion of public clinics with defibrillators was 51.5%. Looking into the
private sector, clinics with laboratory equipments such as bilirubinometer and full blood count analysers were especially low in
numbers (5.8% and 8.3% respectively). Devices like peak flow meters were found in only 45.0% of the private clinics in a paper
by Khoo and Tan in 19981 whereas in this survey, it was slightly higher at 65.0%.
Figure 6.1 Percent of Public Clinics with Functioning Medical Devices in 2012
Figure 6.2 Percent of Private Clinics with Functioning Medical Devices in 2012
The peak flow meter and nebuliser are indispensable devices in a primary care setting given that asthma has been reported as one of the top 10 diseases seen in both public and private clinics.2 The administration of short acting bronchodilators
by means of a nebuliser or metered-dose inhaler and monitoring of peak expiratory flow using peak flow meter is the
mainstay of management in acute asthma.3 For every state/region sampled, all respective public clinics had a median of
four or more functioning peak flow meters per clinic (Table 6.1). By comparison, the private sector had only a median of one functioning peak flow meter per clinic. As for nebulisers, all clinics in both sectors except public clinics in Kuching
recorded a proportion of more than 80.0% of functioning nebulisers.
Prevalence of cardiovascular diseases is on the rise in Malaysia and hence, cardiovascular diagnostic and monitoring equipments are essential items in the primary care setting.4 Almost all the electrocardiograms (ECG) in both sectors were reported to be functioning with a median of 1.0 functioning ECG per clinic except for public clinics in Kuching region [median 2.0(IQR 1.5)].
Resuscitation trolley and defibrillators are deemed necessities in all clinics. Our survey has recorded 71 out of 73
resuscitation trolleys to be functioning in the public clinics. All clinics had at least one resuscitation trolley per clinic. Similar observation was observed in the private clinics except for Kelantan which fell short with only a median of 0.6(IQR
1.0) resuscitation trolley per private clinic. As for defibrillators, none of the public clinics in Kota Kinabalu had a functioning defibrillator in their premises. On the other hand, there were only 5 defibrillators reported available in all 120 private
clinics of which only 3 were functioning.
Glucometers are widely used in the primary care setting to obtain quick results for screening and monitoring of blood sugar.5 While this device is available in almost all of the public clinics, about 5.0% of the glucometers reported in these clinics were non-functioning. The private clinics meanwhile, had a median of 1.0(IQR 1.0) glucometer per clinic.
The use of ultrasound machine for diagnostic purposes is on the rise at present in many countries.6 Public clinics in Selangor and WP Putrajaya recorded 92.9% of functioning ultrasound machines whereas clinics in Kelantan had a slightly lower percentage (87.5%). Ultrasound machines in the rest of the states/regions sampled were all operating well. Looking at the private sector however, clinics in Kuching region reported only 66.7% of functioning ultrasound machines while the rest of the states/regions had more than 90.0% functioning ultrasound machines.
Similar to the usage of ultrasound machines, X-ray machines are introduced to quicken the process of diagnosis. Table 6.1 shows that all public clinics except two located in Selangor/WP Putrajaya and Kuching had functioning X-ray machines. None of the private clinics in Kuching and Kota Kinabalu regions reported the availability of this machine in their premises.
The availability of these devices fastens diagnostic process and hence increases productivity.7 Besides ensuring that the primary care clinics have these devices, it is also important for the healthcare personnel to make sure that the devices are in a good condition and functions well.
Table 6.1. Distribution of Functioning Medical Devices per Clinic by State/ Region and Sector in 2012