Identifying (Indonesian) Students’ Difficulties in
Solving Context-Based (PISA) Mathematics Tasks
Ariyadi Wijaya
a,c,*, Marja van den Heuvel-Panhuizen
a,b, Michiel Doorman
a,
Alexander Robitzsch
d*
[email protected]/[email protected]; [email protected]; [email protected]
a
Freudenthal Institute for Science and Mathematics Education, Utrecht University, the Netherlands
b
Faculty of Social and Behavioural Sciences, Utrecht University, the Netherlands
c
Mathematics Education Department, Yogyakarta State University, Indonesia
d
Federal Institute for Education Research, Innovation and Development of the Austrian School System, Austria
Abstract: This paper reports an investigation of the difficulties experienced by (Indonesian) students when solving context-based mathematics tasks. A total of 362 students from 11 schools located in rural and urban areas in the Province of Yogyakarta participated in a paper-and-pencil test. The test items comprised 34 tasks which were selected from the released items of the Programme for International Student Assessment (PISA) tasks. Students’ difficulties were examined through an error analysis for which an analysis framework was used. The framework consisted of four error types: comprehension, transformation, mathematical processing, and encoding. The data analysis revealed that the most dominant errors made by the students were comprehension errors (38%) and transformation errors (42%). Of all errors made by students 17% were mathematical processing errors and only 3% were encoding errors. These findings indicate that (Indonesian) students mostly had difficulties in comprehending a context-based task and in transforming it into a mathematical problem.
Keyword: context-based tasks, PISA, error analysis, Indonesia
1.
Introduction
The ability to apply mathematics is considered as a core goal of mathematics education in all around the world (see, e.g., Eurydice, 2011; NCTM, 2000). This goal is similar to what in the Programme for International Student Assessment (PISA) is called mathematical literacy, which refers to students’ ability “to identify, and understand, the role that mathematics plays in the world, to make well-founded judgments and to use and engage with mathematics in ways that meet the needs of that individual’s life as a constructive, concerned, and reflective citizen” (OECD, 2003, p. 24). To develop students’ ability to apply mathematics, it is recommended to offer students mathematics problems situated in real-world contexts (De Lange, 2003; NCTM, 2000). In PISA study high value is attached to problems with real-world contexts as a mean to assess mathematical literacy (OECD, 2003). In this paper such problems are called context-based tasks and defined as tasks that are situated in real-world settings and provide elements or information that need to be organized and modeled mathematically.
opportunities to apply their knowledge in society (Kementerian Pendidikan dan Kebudayaan, 2012). Nevertheless, there is an apparent discrepancy between this goal and student achievement. The PISA results showed that Indonesian students perform low on context-based tasks. More than three quarters of Indonesian students did not reach the baseline Level 2, which means they could only answer tasks that have familiar contexts and present all relevant information (OECD, 2010). The low performance of Indonesian students on context-based tasks prompted an establishment of a project called “Context-based Mathematics Tasks Indonesia” (CoMTI), which was aimed at investigating how student performance can be improved. This paper reports the first study of the CoMTI project in which we investigated the difficulties experienced by (Indonesian) students when solving context-based (PISA) mathematics tasks. The research question addressed in this paper is: “What errors do (Indonesian) students make when solving context-based mathematics tasks?”
2.
Theoretical Background
2.1. Solving context-based mathematics tasks
Solving mathematics problem situated in real-world contexts, which in this paper are called context-based tasks, requires an interplay between the real world and mathematics that is often described as a modeling process. According to Blum and Leiss (2007) process of modeling is considered to be carried out in seven steps. The first step is establishing a ‘situation model’ to understand the real-world problem. Second, developing the situation model into a ‘real model’ through the process of simplifying and structuring. Third, real-world solution has to be presented in terms of the real-world situation of the problem. This modelling process is similar to what is called ‘mathematization’ in PISA studies (OECD, 2003). Mathematization involves: understanding the problem situated in reality; organizing the real-world problem according to mathematical concepts and identifying the relevant mathematics; transforming the real-world problem into a mathematical problem which represents the situation; solving the mathematical problem; and interpreting the mathematical solution in terms of the real situation.
2.2 Analyzing students’ errors in solving context-based mathematics tasks
Analysis of students’ errors has long been considered as a powerful source to diagnose learning difficulties (see, e.g. Batanero, Godino, Vallecillos, Green, & Holmes, 1994; Seng, 2010) because errors provide access to students’ reasoning (Brodie, 2014). With respect to analysing students’ difficulties in solving mathematical word problems, Newman (1977) developed a model that is known as Newman Error Analysis. Newman proposed five categories of errors, i.e. reading (error in simple recognition of words),
comprehension (error in understanding the meaning of a problem), transformation (error in transforming a word problem into an appropriate mathematical problem), process skills
(error in performing mathematical procedures), and encoding (error in representing the mathematical solution into acceptable written form).
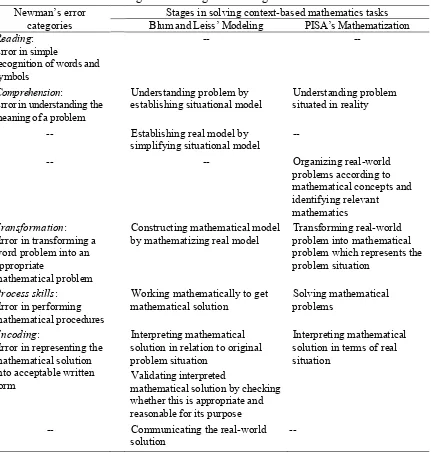
whether Newman Error Analysis is applicable for analyzing students’ difficulties in solving context-based tasks. Table 1 shows the association between Newman’s error categories with the stages of modeling process and PISA’s mathematization. It is shown that in general Newman Error Analysis could be used to analyze students’ errors when solving context-based tasks. Of Newman’s five error categories, only the first category that does not match to modeling process or mathematization.
Table 1. Newman’s error categories and stages in solving context-based mathematics tasks
Newman’s error categories
Stages in solving context-based mathematics tasks Blum and Leiss’ Modeling PISA’s Mathematization
based on the difficulty level of the tasks, as reflected in the percentage correct answers found in the PISA 2003 survey (OECD, 2009). Six of the questions were used as anchor tasks and were included in all booklets. Every student took one booklet consisting of 12 to 14 questions. percentages of correct answers of Indonesian students participated in the PISA 2003 survey (OECD, 2009) with those of students in our sample for 17 PISA mathematics tasks. A significant correlation was obtained, r (15) = .83, p < .05, which indicates that the tasks that were difficult for Indonesian students in the PISA 2003 survey were also difficult for the students in the present study.
3.3 Procedure of coding the errors
An error analysis was performed on the basis of students’ incorrect responses to investigate the kinds of difficulties experienced by students. For this purpose, an analysis framework was developed based on Newman’s error categories that were associated with the stages of modeling process and PISA mathematization. The analysis framework comprised four types of errors: comprehension, transformation, mathematical processing, and encoding. Newman’s reading error was not used in our analysis because this error category refers to the technical aspect of reading and does not match to any stage of modeling process or PISA’s mathematization. Furthermore, to make the coding more fine-grained the four error types were specified into a number of sub-types, which was done on the basis of a first exploration of the data and a further literature review (see Table 2 for the sub-types of comprehension errors, Table 3 for the sub-types of transformation errors, and Table 4 for the sub-types of mathematical processing errors. For the encoding error we did not specify into sub-types).
The coding was carried out by the first author and afterwards the reliability of the coding was checked through an additional coding by an external coder. This extra coding was done on the basis of 22% of students’ incorrect responses which were randomly selected from all mathematics units. In agreement with the multiple coding procedure, the interrater reliability was done for each error type, which resulted in Cohen’s Kappa of .72 for comprehension errors, .73 for transformation errors, .79 for errors in mathematical processing, and .89 for encoding errors, which indicate that the coding was reliable (Landis & Koch, 1977).
3.4 Statistical analyses
analysis of variance based on linear mixed models (Bates, Maechler, & Bolker, 2011). This analysis was based on all responses where an error could be coded and treated the nesting of task responses within students by specifying a random effect for students
4.
Results
4.1 Students’ errors when solving context-based (PISA) mathematics tasks
In total, there were 4707 responses (number of tasks done by all students in total) which included 2472 correct responses (53%), 1532 incorrect responses (33, and 703 missing responses (15%). The error analysis was carried out on the basis of the 1532 incorrect responses. The analysis of these responses revealed that a total of 1718 errors were made by the students. The total number of errors exceeded the total number of the incorrect responses because a multiple coding was applied, which means an incorrect response could be coded with more than one error type. Of all errors made by the students 38% were comprehension errors, 42% were transformation errors, 17% were mathematical processing errors, and only 3% were encoding errors. A closer examination was carried out to identify the sub-types of comprehension, transformation, and mathematical processing errors.
4.1.1 Comprehension errors
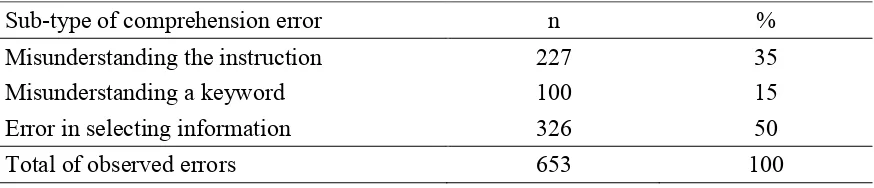
It was found that a half of the comprehension errors were errors in selecting relevant information (see Table 2). Students tended to use all numbers provided in a task (see Figure 1a). Figure 1a shows an error made by a student when solving the Staircase task. This task is about finding the height of each step of a staircase consisting of 14 steps. The student has deduced correctly that to solve the task he had to divide the height of the staircase by the number of steps. However, in the calculation he included the depth of the staircase although this information was irrelevant for solving the task.
Another kind of error in selecting information is related to students’ inability to connect information from different sources (see Export task in Figure 1b). Students were asked to calculate the value of fruit juice exported in 2000 for which they needed to use the data from the pie chart, for the percentage of fruit juice, and the data from the bar diagram for the total annual exports in 2000. A student, whose work is shown in Figure 1b, already used the correct mathematical procedure. However, he used incorrect data in the calculation. Instead of taking the data of total annual exports in 2000 from the bar diagram (i.e. 42,6 million zeds), he used ‘360’, which seems to be derived from the total angle of a circle.
Table 2 Frequencies of sub-types of comprehension errors
Sub-type of comprehension error n %
Misunderstanding the instruction 227 35
Misunderstanding a keyword 100 15
Error in selecting information 326 50
Figure 1a. Example of an error in selecting information: using all numbers provided in the task
4.1.2 Transformation errors
With respect to the transformation errors, it was revealed that two thirds of them were the sub-type ‘wrong mathematical operation/concept’ which means errors in selecting the required mathematical procedures (see Table 3). Figure 2 shows an incorrect response of a student that contained a transformation error. The task shown in Figure 2 is about the concept of direct proportion that is situated in the context of money exchange. The student was asked to convert 3900 ZAR to Singapore dollars with an exchange rate of 1 SGD = 4.0 ZAR. Instead of dividing 3900 by 4.0, the student multiplied 3900 by 4.0. This means the student chose the wrong mathematical procedure for solving the task.
Table 3 Frequencies of sub-types of transformation errors
Sub-type of transformation error n %
Procedural tendency 90 12
Taking too much account of the context 56 8
Wrong mathematical operation/concept 489 68
Treating a graph as a picture 88 12
Total of observed errors 723 100
Figure 2. Example of transformation error
4.1.3 Mathematical processing errors
Table 4 Frequencies of sub-types of mathematical processing errors
Sub-type of
mathematical processing error
Related tasks
All errors in related tasks
Mathematical processing errors in related tasks
n n n %
Algebraic error 8 243 33 14
Arithmetical error 20 956 94 10
Error in interpreting graph 6 155 43 28
Measurement error 1 74 15 20
Error related to improper use of scale 1 177 49 28
Unfinished answer 26 1125 79 7
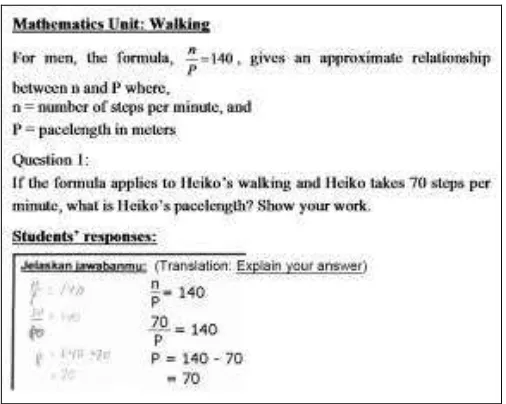
An example of a mathematical processing error is shown in a task in Figure 4. The
task is about finding a man’s pace length (P) by using the formula 140 P
n in which n, the
number of steps per minute, is given. The student correctly substituted the given information into the formula; i.e. 70 140
P . In the next step, however, instead of dividing 70
by 140 the student subtracted 140 by 70. This response indicates that the student had difficulty to work with an equation in which the unknown was the divisor and the dividend is smaller than the quotient.
Figure 4. Example of mathematical processing error and encoding error
4.1.4 Encoding errors
4.2 The relation between the types of errors and the students’ performance level
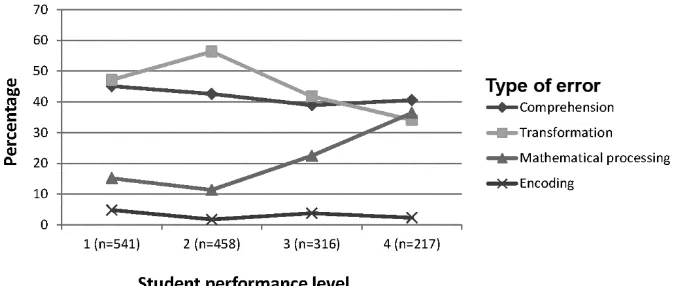
When testing whether students on different performance levels differed with respect to the error types they made, it was found that the low performing students (Level 1 and Level 2) made more transformation errors than the high performing students (Level 3 and Level 4) (see Figure 5). For the mathematical processing errors the pattern was opposite in which the high performing students made more errors than the low performing students. With respect to the comprehension errors there was no such a difference. The low and high performing students made about the same number of comprehension errors.
Figure 5. Types of error made by students with different performance levels
4. Conclusion and discussion
The results of the error analysis indicate that (Indonesian) students mostly experienced difficulties in the early stages of solving context-based tasks, i.e. in comprehending a context-based task and in transforming it into a mathematical problem. With respect to the mathematical processing errors it was found that high performing students made more errors than the low performing students. A possible explanation for this result is that the low performing students, in contrast to the high performing students, might get stuck in the first two stages of solving context-based mathematics tasks and therefore are not arriving at the stage of carrying out mathematical procedures. These findings confirm Newman’s (1977) argument that the error types might have a hierarchical structure: failures on a particular step of solving a task prevents a student from progressing to the next step.
References
Batanero, C., Godino, J. D., Vallecillos, A., Green, D. R., & Holmes, P. (1994). Errors and difficulties in understanding elementary statistical concepts. International Journal of Mathematical Education in Science and Technology, 25(4), 527–547.
Bates, D., Maechler, M., & Bolker, B. (2011). lme4: Linear mixed-effects models using S4 classes. R package version 0.999375-42.
Blum, W., & Leiss, D. (2007). How do students and teachers deal with mathematical modelling problems? The example “Sugarloaf”. In Haines, C., Galbraith, P., Blum, W., & Khan, S., Mathematical modelling (ICTMA 12): Education, engineering and economics (pp. 222–231). Chichester: Horwood Publishing.
Brodie, K. (2014). Learning about learner errors in professional learning communities.
Educational Studies in Mathematics, 85(2), 221–239.
De Lange, J. (2003). Mathematics for literacy. In B. L. Madison & L. A. Steen (Eds.),
Quantitative literacy: Why numeracy matters for schools and colleges (pp. 75–89). Princeton, NJ: National Council on Education and Disciplines.
Eurydice. (2011). Mathematics education in Europe: Common challenges and national policies. Brussels: Education, Audiovisual and Culture Executive Agency.
Kementerian Pendidikan dan Kebudayaan. (2012). Dokumen Kurikulum 2013 (The document of the Curriculum 2013). Jakarta: Author.
Landis, J. R., & Koch, G. G. (1977). The measurement of observer agreement for categorical data. Biometrics, 33(1), 159–174.
Lumley, T. (2004). Analysis of complex survey samples. Journal of Statistical Software, 9(1), 1–19.
Lumley, T. (2012). Survey: Analysis of complex survey samples. R Package version 3.28-1. Maass, K. (2010). Classification scheme for modelling tasks. Journal für
Mathematik-Didaktik, 31(2), 285–311.
NCTM. (2000). Principles and standard for school mathematics. Reston: Author.
Newman, M. A. (1977). An analysis of sixth-grade pupils’ errors on written mathematical tasks. Victorian Institute for Educational Research Bulletin, 39, 31–43.
OECD. (2003). The PISA 2003 assessment framework – Mathematics, reading, science, and problem solving knowledge and skills. Paris: Author.
OECD. (2009). Take the test. Sample questions from OECD’s PISA assessments. Paris: Author.
OECD. (2010). PISA 2009 results: What students know and can do. Student performance in reading, mathematics, and science (Vol. I). Paris: Author.
Pusat Kurikulum. (2003). Kurikulum 2004. Standar Kompetensi mata pelajaran matematika Sekolah Menengah Pertama dan Madrasah Tsanawiyah. Jakarta: Departemen Pendidikan Nasional.
Seng, L. K. (2010). An error analysis of Form 2 (Grade 7) students in simplifying algebraic expressions: A descriptive study. Electronic Journal of Research in Educational Psychology, 8(1), 139–162.
Warm, T. A. (1989). Weighted likelihood estimation of ability in item response theory.
Psychometrika, 54(3), 427–450.