Field evaluation of seed production, shattering, and dormancy in
hybrid populations of transgenic rice (
Oryza sati
6
a
) and the weed,
red rice (
Oryza sati
6
a
)
James Oard
a,*, Marc Alan Cohn
b, Steve Linscombe
c, David Gealy
d,
Kenneth Gravois
e,1aDepartment of Agronomy,LSU Agricultural Center,Louisiana State Uni
6ersity,Baton Rouge,LA70803, USA
bDepartment of Plant Pathology and Crop Physiology,LSU Agricultural Center,Louisiana State Uni
6ersity,Baton Rouge,LA70803, USA
cRice Research Station,LSU Agricultural Center,Crowley,LA 70527, USA dDale Bumpers National Rice Germplasm Center,Stuttgart,AR 72160, USA eUni6ersity of Arkansas Rice Research and Extension Center,Stuttgart,AR 72160, USA
Received 29 November 1999; received in revised form 25 February 2000; accepted 26 February 2000
Abstract
The genetic and agronomic consequences of transferring glufosinate (Liberty™) herbicide resistance from transgenic rice (Oryza sati6aL.) lines to the noxious weed red rice (Oryza sati6a L.) were evaluated under field conditions. Replicated field trials in Louisiana (LA) and Arkansas (AR) were conducted in 1997 to evaluate ten vegetative and reproductive traits of eight F2
populations produced from controlled crosses of two transgenic, glufosinate-resistant rice lines and four red rice biotypes. Plant vigor and plant density at both locations were similar among populations derived from either transgenic or non-transgenic parents. Significant differences in plant height and maturity were observed among LA populations produced from transgenic lines when compared to corresponding populations developed from non-transgenic material. However, values for these traits were not greater than those detected in the red rice biotypes. Seed dormancy and seed production were not significantly different at either location among transgenic and non-transgenic populations. Dominant Mendelian segregation of glufosinate resistance was detected in 40% of the populations evaluated. Results of this study indicated that those populations segregating for glufosinate resistance responded in a location-specific manner with respect to life history and fecundity traits. © 2000 Elsevier Science Ireland Ltd. All rights reserved.
Keywords:Gene flow; Crop-weed hybrids; Fitness; Fecundity; Seed dormancy; Rice; Herbicide tolerance; Glufosinate; Liberty™
www.elsevier.com/locate/plantsci
1. Introduction
Gene transfer technology in the last decade has produced various herbicide-resistant crop plants [1] that are currently in or have the potential for commercial production. The BAR gene [2],
iso-lated from Streptomyces hygroscopicus, has been
cloned and transferred to several crops [3 – 5] in-cluding rice [6] for tolerance to the broad-spec-trum herbicide Liberty™. (All trade names and company names are listed for the benefit of the reader and do not imply endorsement or preferen-tial treatment of the product by Louisiana State University, the University of Arkansas, or the US Department of Agriculture.) The active ingredient in this herbicide is the ammonium salt of
glufosi-nate (ammonium-DL-homoalanine-4-yl (methyl)
phosphinate), and will be referred to as glufosinate in the remainder of this paper. The potential trans-fer of herbicide-resistant genes from transgenic
Approved for publication by the Director of the Louisiana Agric. Exp. Stn. as paper no. 00-09-0123.
* Corresponding author. Tel.: +1-504-3882110; fax: + 1-504-3881403.
E-mail address:[email protected] (J. Oard).
1Present address: Sugar Research Station, LSU Agricultural
Cen-ter, PO Box 604, St. Gabriel, LA, 70776, USA.
J.Oard et al./Plant Science157 (2000) 13 – 22 14
crops to weedy species and subsequent changes in fitness of weed populations have been a topic of
recent research. For example, interspecific F1
hy-brids fromBrassica rapa×transgenicBrassica na
-pus controlled crosses showed normal expression
and Mendelian segregation of the BAR gene [7]. However, selfing of the hybrids produced no vi-able seeds, and transmission frequency of the BAR gene was significantly reduced in one of two back-cross populations. Similar experiments using
non-transgenic material showed that B. rapa×B.
napusF1, F2,and backcross generations were
inter-mediate to or lower in fecundity than that of the
parents [8,9]. Transgenic B. napus×Raphanus
raphanistrum (wild radish) F1 hybrids and four
successive generations were previously evaluated under field conditions for seed production and BAR gene transmission [10]. Seed production was
low in F1 populations, but increased to near wild
type levels by the third generation. BAR frequency decreased to 25% of the original by the fourth generation and was associated with reduced num-bers of chromosomes in female parents. Hybrids produced between wild and domesticated strains
of sunflower (Helianthus annusL.) showed reduced
seed production and dormancy for most, but not
all, of the F1populations that were evaluated [11].
Wild strains and domesticated cultivars of rice have been shown to hybridize and produce viable offspring, but with varying degrees of efficiency [12]. Cultivated rice has a companion weed, red
rice (Oryza sati6a), which exists in temperate and
tropical regions of the world that reduces grain yield and quality and is considered a noxious weed in rice producing areas of the southern United States [13]. At present, red rice control is achieved through crop rotation and paddy-water manage-ment. Frequency of hybridization between non-transgenic cultivated rice and red rice has been evaluated in one study [14], where seeds were collected from red rice plants found in commercial Louisiana rice fields and planted in common gar-den experiments. Electrophoretic analysis igar-den- iden-tified individuals produced from hybridization between cultivated and red rice plants. Hybrids generally exhibited greater height and flag leaf area than the cultivated or red rice parents. Tiller number was greater in the hybrids than in the red rice, but not in the commercial cultivars. Overall, these results indicated that hybrid vigor did occur for certain vegetative characteristics. Incidence of
hybridization ranged from 1% for early maturing cultivars to a high of 52% in a commercial plant-ing of the late maturplant-ing cultivar Nortai.
The BAR gene was recently transferred and evaluated in 11 different transgenic rice lines in 2 years of field-plot trials [6]. Significant differences among transgenic BAR-containing lines were ob-served for grain yield, plant height, and date of flowering before or after treatment with Liberty. Other work [15] showed that insertion of the nptII gene in rice was associated with reduced seed fertility, delayed maturity, and smaller flag leaves when compared with the corresponding non-trans-formed, protoplast-derived plants. Similar results were obtained in transgenic barley [16]. Reciprocal crosses between two transgenic rice cultivars and a common Louisiana red rice biotype displayed sin-gle-gene, dominant transmission and expression of
the BAR gene in F1 and F2 generations [17]. No
cytoplasmic influence on expression of the trans-gene was detected when either the cultivated or wild strains were used as maternal parent. A total of five quantitative trait loci (QTL) were detected for rice seed dormancy on four chromosomes that explained 48% of total phenotypic variation in
BC1F5 lines [18]. One dormancy QTL mapped to
the same location as a QTL for heading date. The objective of this research was to investigate agronomic and fitness traits of BAR transgenic rice-red rice hybrid populations that segregated for resistance to Liberty herbicide under field condi-tions. We expected to gain a greater understanding of potential consequences of gene flow from herbi-cide resistant commercial rice into red rice. To our knowledge this study was the first in the United States to evaluate potential effects of the BAR gene on life history, fitness and seed characteristics of red rice.
2. Materials and methods
2.1. De6elopment of crop-weed hybrid populations
hull, awnless red rice, designated biotype 5, has been previously characterized for seed dormancy [19 – 21] and was included as a control. The trans-genic BAR lines were previously shown by labora-tory and field tests to contain one or more stably incorporated copies of the BAR gene and express
tolerance to 1.1 kg a.i./ha field applications of
Liberty herbicide [22]. F1seeds were planted in the
greenhouse for seed increase during the winter of
1996 – 1997. F2 seeds were harvested in the spring
of 1997 and dried to 12% moisture for field
plant-ing. From each F2 population ten seeds were
tested for germination using a standard 7-day test [21]. Only those seed lots with germination per-centages higher than 85% were planted in field experiments.
2.2. Field experiments
Field experiments were planted on May 7, 1997 at the LSU Agricultural Center, Central Station-Ben Hur Farm near Baton Rouge, LA and on May 14, 1997 at the University of Arkansas, Southwest Research and Extension Center near Hope, Arkansas. The experimental design was a randomized complete block design with four repli-cations. Each plot, 2 m long and 1.33 m wide, was planted using a seed drill planter with 60 seeds and
30 cm distance spacing to allow adequate
growth and inspection of individual plants. Plot sites were located outside the commercial rice pro-duction areas of the respective states. Soil prepara-tion and irrigaprepara-tion management were typical for the rice agricultural systems of Louisiana and Arkansas. Both sites received quinclorac ( 0.43 kg
a.i./ha), thiobencarb, (4.5 kg a.i./ha), and
propanil, (4.5 kg a.i./ha) herbicides to control
weeds. At the Hope site, Permit™
(halsulfuron-methyl, 70 g a.i./ha) was also applied for nutsedge
(Cyperus esculentus) control. Except for leaf-dip
scoring of herbicide resistance in F2 populations,
Liberty herbicide was not applied.
The following variables were measured at the Ben Hur site: seedling emergence counts taken at
34 days post-planting, vigor rating (rating of 1=
most vigorous, 9=least vigorous), plant height
(measured from soil line to tip of flag leaf), date of first and 50% tillering, date of first, 50%, and last heading (heading defined as date of panicle emer-gence from the boot). For seed shatter rating at the Ben Hur site, four panicles per plant and four plants per plot were harvested at physiological maturity. After collection panicles were carefully transported to a laboratory and rapped ten times against a plastic bucket. The percentage of seeds remaining on the panicle was used to give a seed
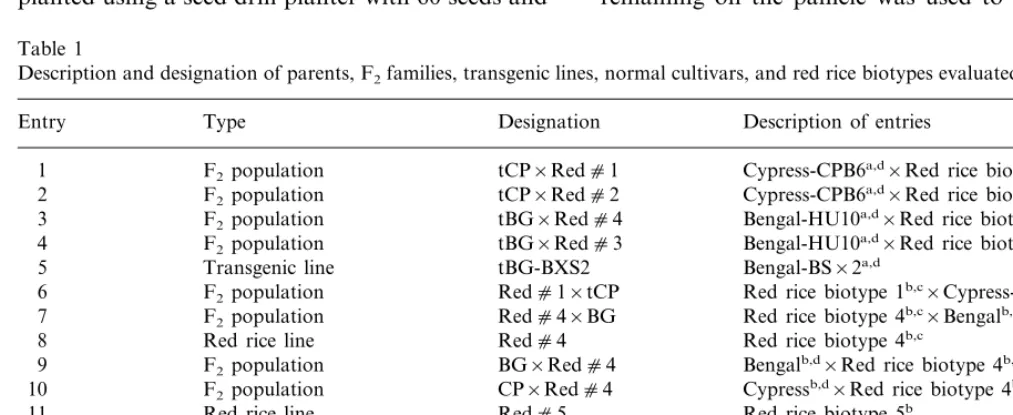
Table 1
Description and designation of parents, F2families, transgenic lines, normal cultivars, and red rice biotypes evaluated in this study
Description of entries Entry Type Designation
Cypress-CPB6a,d×Red rice biotype 1b,c
1 F2population tCP×Redc1
F2population
2 tCP×Redc2 Cypress-CPB6a,d×Red rice biotype 2b,c
3 F2population tBG×Redc4 Bengal-HU10a,d×Red rice biotype 4b,c tBG×Redc3 Bengal-HU10a,d×Red rice biotype 3b,c
F2population
4
Transgenic line
5 tBG-BXS2 Bengal-BS×2a,d
F2population
6 Redc1×tCP Red rice biotype 1b,c×Cypress-CPB6Ad
F2population
7 Redc4×BG Red rice biotype 4b,c×Bengalb,d
Redc4 Red rice biotype 4b,c
8 Red rice line F2population
9 BG×Redc4 Bengalb,d×Red rice biotype 4b,c
CP×Redc4 Cypressb,d×Red rice biotype 4b,c
10 F2population
11 Red rice line Redc5 Red rice biotype 5b
tCP Cypress-CPB6a,d
Transgenic line 12
tBG
13 Transgenic line Bengal-HU10a,d
Transgenic line
14 tBG-11 Bengal-HU11a,d
Cypressb,d
Normal cultivar CP 15
BG
Normal cultivar Bengalb,d
16
aLiberty herbicide-resistant transgenic line. bNon-transgenic line or cultivar.
J.Oard et al./Plant Science157 (2000) 13 – 22 16
shattering rating for each plot: 0=0 – 10%, 1=
11 – 30% , 2=31 – 60%, 3=\60%. Total seed
weight, 100-seed weight, and total seed number were also determined. For seed shattering at
Hope, a four-panicle sample was placed in a 30×
12-cm panicle envelope and rapped violently four times against the edge of the laboratory bench. The panicles and the seeds still attached to them were removed and weighed. The loose seed in each envelope was weighed and a ratio of loose seed
weight/original total panicle weight was
consid-ered an estimation of shattering. Panicles were stripped by hand into a bucket, all seed returned to the sample envelope and allowed to dry for 3 days at 50°C. The seed were then passed through a small seed lot thresher to separate the blank florets from the seed. Both empty florets and total seed weights were obtained. A sample of 100 seeds was weighed and the total number of seeds was calculated. A standard 100 empty floret weight was used to calculate the number of florets that did not produce seeds.
For seed dormancy evaluation, seeds and awns (if present) were removed from panicles by hand. Seed samples from individual panicles were trans-ferred to plastic containers and remained on the
lab bench at 23°C for dry after-ripening. At 1
and 8 weeks after harvest, a subsample of 15
seeds/panicle was removed and tested for
germina-tion and dormancy. Plastic 9-cm square Petri dishes were prepared with three sheets of Anchor Standard brown germination paper (Anchor Pa-per, Minneapolis, MN) and 8-10 ml of 0.01% Dithane or 0.005% Chlorothalonil fungicide (Gro Tech, Madison, GA) diluted with deionized water. Seeds were incubated at 30°C in the dark at 100% relative humidity for 14 days.
Best management practices were used to control the seed remaining at field sites after harvest from all three rice types: red rice, hybrid populations and white crop rice. The Ben Hur site was mowed on November 25, 1997, the first opportunity to enter the field due to wet conditions. All plant material with the exception of the seed samples, remained at the site. The levies remained intact to prevent inadvertent seed burial and to allow the accumulation of winter rainfall into standing wa-ter. At the Hope site, the remaining plant material was cut and left in the field to dry on October 14, 1997. Dry hay was placed on top of the test site and on December 10, 1997, rice stubble at the test
site was burned. The levees remained standing and the soil surface was undisturbed except for a light cultivation operation to stimulate germination in the early spring of 1998.
The two sites were monitored after each rainfall or irrigation that was sufficient to stimulate germi-nation. After the first recorded germination of rice
and/or red rice volunteers in the spring, six 1-m
square quadrants at Ben Hur and four at Hope, were established to monitor numbers of surviving volunteers. Except for the following herbicide ap-plications, the sites remained fallow and undis-turbed. After each new germination flush, the field was sprayed with recommended field rates of glu-fosinate ammonium. Plots were then treated with recommended field rates of glyphosate to kill all of the remaining living vegetation. The plots were subsequently resprayed and monitored until vol-unteers were no longer observed. Appropriate
au-thorizations were obtained from the
USDA-APHIS for all environmental releases (field planting) of the transgenic rice seed.
2.3. Statistical analyses
All analyses were completed on plot mean val-ues. Analysis of variance was performed using
JMP® [23]. The minimum model used for all
analyses of variance was comprised of entries and
replications, with the entry×replication
interac-tion used as the error term. Replicainterac-tions and the
entry×replication interaction were considered
random effects. Separation of means was per-formed using the Duncan’s Multiple Range Test.
3. Results
Mean values for life history and fecundity traits at each location are given in Tables 2 and 3. At
the Baton Rouge location, Redc4 exhibited
greater mean number of plants/plot than
non-transgenic BG, non-transgenic tBG and tCP parents,
but not seven of the F2populations (entries 1, 2, 3,
6, 7, 9, 10). Redc5 showed similar results except
for lower values when compared to F2 population
tBG×Redc4 (entry 3). Among the parents used
to make crosses in this study (tCP, tBG, CP, and
BG), no differences in mean number of plants/plot
J
.
Oard
et
al
.
/
Plant
Science
157
(2000)
13
–
22
17
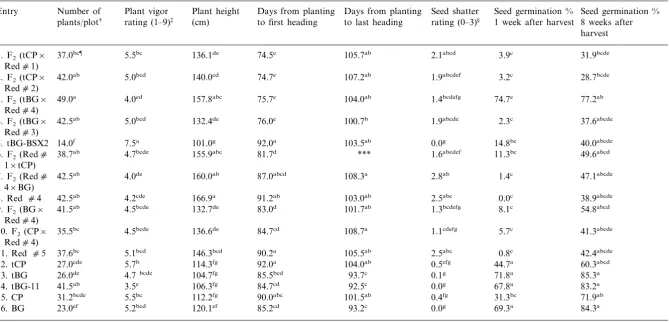
Means values for plants/plot, vigor, plant height, days to first and last heading, shatter rating, and seed germination % 1 and 8 weeks after harvest, Ben Hur Farm, Baton Rouge, LA, 1997
Plant height Days from planting
Plant vigor Days from planting Number of
Entry Seed shatter Seed germination % Seed germination % 8 weeks after rating (1–9)‡ (cm) to last heading rating (0–3)§ 1 week after harvest
plants/plot† to first heading
harvest
74.5e
37.0bc¶ 5.5bc 136.1de 105.7ab 2.1abcd 3.9c 31.9bcde
1. F2(tCP×
Redc1)
107.2ab
2. F2(tCP× 42.0ab 5.0bcd 140.0cd 74.7e 1.9abcdef 3.2c 28.7bcde
Redc2)
104.0ab 1.4bcdefg 74.7e 77.2ab
157.8abc
3. F2(tBG× 49.0a 4.0ed 75.7e
Redc4)
42.5ab 5.0bcd 76.0e 100.7b 1.9abcde 2.3c 37.6abcde
4. F2(tBG× 132.4de
Redc3)
14.0f 7.5a 101.0g 103.5ab 0.0g 14.8bc 40.0abcde
5. tBG-BSX2 92.0a
*** 1.6abcdef 11.3bc 49.6abcd
81.7d
6. F2(Redc 38.7ab 4.7bcde 155.9abc
1×tCP)
108.3a 2.8ab
7. F2(Redc 42.5ab 4.0de 160.0ab 87.0abcd 1.4c 47.1abcde
4×BG)
2.5abc 0.0c 38.9abcde
91.2ab
42.5ab 103.0ab
8. Red c4 4.2cde 166.9a
83.0d
41.5ab 4.5bcde 132.7de 101.7ab 1.3bcdefg 8.1c 54.8abcd
9. F2(BG×
Redc4)
108.7a 1.1cdefg 5.7c
10. F2(CP× 35.5bc 4.5bcde 136.6de 84.7cd 41.3abcde
Redc4)
2.5abc 0.8c 42.4abcde
90.2a
11. Red c5 37.6bc 5.1bcd 146.3bcd 105.5ab
27.0cde 5.7b 114.3fg 104.0ab 0.5efg 44.7a 60.3abcd
12. tCP 92.0a
85.5bcd 93.7c 0.1g 71.8a 85.3a
13. tBG 26.0de 4.7 bcde 104.7fg
0.0g 67.8a 83.2a
92.5c
84.7cd
106.3fg
14. tBG-11 41.5ab 3.5e
101.5ab
31.2bcde 5.5bc 112.2fg 90.0abc 0.4fg 31.3bc 71.9ab
15. CP
85.2cd 93.2c 0.0g 69.3a 84.3a
5.2bcd
16. BG 23.0ef 120.1ef
†Number of plants counted 34 days after planting. ‡Vigor rating of 1=most vigorous, 9=least vigorous.
§Shatter rating: 0=0–10%, 1=11–30%, 2=31–60%, 3=\60%.
¶Means followed by the same letter are not significantly different (DMRT,a=0.05)
J.Oard et al./Plant Science157 (2000) 13 – 22 18
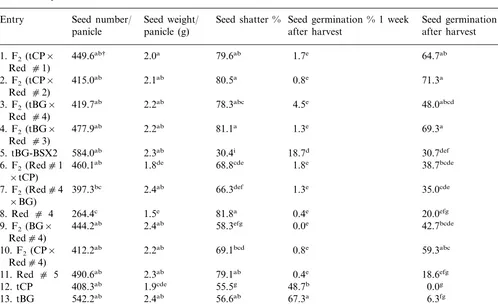
Table 3
Mean values for seed number/panicle, seed weight/panicle, percent seed shattering and seed germination % 1 and 8 weeks after harvest, Hope, AR, 1997
Seed germination % 8 weeks Seed weight/ Seed shatter % Seed germination % 1 week
Seed number/
Entry
panicle (g)
panicle after harvest after harvest
449.6ab† 2.0a 79.6ab 1.7e
5. tBG-BSX2 584.0ab 18.7d 30.7def
460.1ab 1.8de 68.8cde 1.8e
†Mean followed by the same letter are not significantly different (DMRT,a=0.05).
of plants/plot than BG, tBG and tCP, except for
normal cultivar CP. Transgenic line tBG-BSX2
exhibited the lowest mean number of plants/plot
when compared to other entries except BG. Trans-genic line tCP as a parent showed lower mean
number of plants/plot than F2 population tCP×
Redc2, but not F2s from the tCP×Redc1
cross. A greater mean number of plants/plot were
observed in F2 populations tBG×Redc4 and
tBG×Redc3 than the transgenic tBG parent.
No differences were found when comparing F2
populations derived from tBG (entries 3, 4) and BG (entries 7, 9) parents. Similarly, no differences
were observed among F2 populations when tCP
and CP were used as parents (entries 1, 2, 10). At
the Hope site, mean number of plants/plot ranged
from 24.5 to 40.0, but there were no significant differences among the entries.
Vigor ratings were taken at the Baton Rouge location and represent a visual subjective scoring system to estimate overall ‘robustness’ of entries in the early seedling stage. It is important to note
that a high vigor rating is indicative of low plant
vigor. Red c4 and Redc5 exhibited similar
vigor ratings to all F2 populations. Redc5
showed a higher vigor rating than tBG-11, but a lower rating than transgenic line tBG-BSX2. Non-transgenic BG exhibited a higher vigor rating of 5.2 than transgenic tBG-11 with rating 3.5, but non-transgenic BG showed similar vigor to an-other transgenic line, tBG, with a 4.7 rating. tBG-BSX2 displayed the highest vigor rating of any other entry (7.5) and is consistent with the lowest
number of plants/plot recorded in this study.
Vigor ratings were similar for CP and tCP. No
differences in vigor were observed in F2
popula-tions when either CP and tCP or BG and tBG were used as parents (entries 1, 2, 3, 4, 6, 7, 9, 10) . Vigor ratings were not recorded at the Hope site.
Plant heights for Redc4 and Redc5 were
rice, but not in the commercial or transgenic
mate-rial. When Redc4 was crossed to CP, a 23-cm
reduction in plant height was detected in the F2
population (entry 8 vs. 10), but plant height was
similar when Redc4 was crossed to tBG (entry 8
vs. 3). Among transgenic and non-transgenic parental material, plant heights were similar, but tBG-BSX2 was significantly shorter by 19 cm than non-transgenic BG. A significant reduction of 27 cm in plant height was found when BG was used
as a female in reciprocal crosses with Redc4
(entry 7 vs. 9). Plant height was significantly
shorter by 25 cm in the BG×Redc4 F2s (entry
9) when compared to the tBG×Redc4
popula-tion (entry 3), but no differences were found when
compared with the F2of tBG×Redc3 (entry 4).
No differences in plant height were found in F2
populations when either CP or tCP were used as females in crosses to red rice (entries 1, 2, 10).
Significant reductions of 17 cm were observed,
however, when tCP was used as a male (entry 6). Data for plant height were not recorded at the Hope location.
Days from planting to first heading at Baton Rouge varied only from zero to 2 days between corresponding transgenic and non-transgenic lines (CP, tCP and BG, tBG, tBG-11). In contrast, tCP
was later by 7 days than normal and transgenic
Bengal. Redc4 and Redc5 differed by 1 day
compared to CP and tCP from planting to first
heading, and the red rice was 5 days later than
BG, tBG, and tBG-11. When red rice biotypes were used as a male (entries 1, 2, 3, 4) or as a female (entry 6) in crosses, significant reductions of 10 – 15 days from planting to first heading were observed. This trend was not found for entries 9
or 10 that contained Redc4 as a male parent. In
crosses with transgenic tBG and red rice (entries 3, 4), days from planting to first heading were
signifi-cantly reduced by 7 – 10 days when compared to
crosses with non-transgenic BG (entries 7 and 9). The same trend was found in crosses involving transgenic tCP (entries 1 and 2) and non-trans-genic CP (entry 10). Days from planting to first heading were not recorded at Hope.
Transgenic and non-transgenic CP displayed similar days from planting to last heading with
tBG-BSX2 (entry 5) and these entries were 8 –
11 days later than BG and tBG. Crosses of red rice with either commercial (entry 10) or trans-genic Cypress (entries 1, 2) resulted in similar days
to last heading, but 20% of individuals from the
Redc1×tCP cross (entry 6) did not flower
dur-ing the entire study. Reciprocal crosses involvdur-ing tCP (entries 1 and 6) showed significant maternal
effects for days to last heading when Redc1 was
used as a female. In contrast, no maternal effect was detected in reciprocal crosses with normal
Bengal, transgenic Bengal and Redc4 (entries 3,
9). When BG or tBG was crossed to red rice (entries 3, 4 vs. 7, 9), no differences in days to last
heading were observed. Red rice biotypes c4 and
c5 were similar in days to last heading compared
to normal and transgenic Cypress, but were
signifi-cantly later by 11 days than normal or
trans-genic Bengal. Hybrid weed populations with red rice as a parent (entries 1, 2, 3, 4, 7, 9, 10) showed
no differences between Red c4 and c5 for days
to last heading. The exception was late-maturing entry 6. Days from planting to last heading were not recorded at the Hope site.
The extent of seed shattering was measured at both field locations. At the Baton Rouge site, seed shatter ratings were low for all transgenic and non-transgenic lines (entries 5, 12 – 16). This trend was not observed at Hope where CP and tCP showed similar shatter percentage, but non-genic BG exhibited lower shattering than trans-genic tBG and higher shattering than tBG-BSX2.
Redc4 and Redc5 shared identical shatter
rat-ings at Baton Rouge which were significantly higher than all cultivars and transgenic lines. Sim-ilar results were observed at Hope except for the high shatter percentage of tBG that was not
statis-tically different from Redc4 or Redc5. Hybrid
populations that used red rice as a parent (entries 1, 2 ,3 , 4, 6, 7, 9, 10) showed no differences in shatter rating at Baton Rouge when compared to
Redc4 or c5. No maternal effects on shatter
rating were found in reciprocal crosses (entries 7,
9) of Redc4 and BG. When populations of
tBG×Redc4 (entry 3) and BG×Redc4 (entry
9) were compared for seed shatter rating at Baton Rouge, no differences were found. In contrast
significantly greater shattering by 10% was
found at Hope in the tBG×Redc4 and tBG×
Redc3 populations (entries 3,4) than in the
non-transgenic crosses BG×Redc4 and
Redc4×BG (entries 7, 9). This result is
(en-J.Oard et al./Plant Science157 (2000) 13 – 22 20
try 16). Shatter percentage of hybrid populations (Hope site) with tBG as a parent (entries 3,4) was
similar to those of Redc4 and Redc5. When
shatter ratings at Baton Rouge were compared between populations containing CP (entry 10) and tCP (entries 1,2, 6), no significant differences were found. Similar results were found at the Hope site, except that the non-transgenic population contain-ing CP (entry 10) showed significantly lower shat-tering than a transgenic population containing tCP (entry 2).
Seed germination percentages 1 week after har-vest (SG1) were statistically similar for transgenic and non-transgenic lines at Baton Rouge except for CP at 31% and tBG-BSX2 at 0%. At the Hope location tBG and tBG-11 showed 31 and 35% greater SG1, respectively, than BG. Similarly, tCP displayed greater SG1 at Hope by 25% than its
non-transgenic counterpart CP. Redc4 and c5
exhibited low SG1 near 0% which was significantly smaller than those for all cultivars and parental lines except CP. SG1 was not significantly
differ-ent among Redc4, Redc5, and those crosses
with red rice parents (entries 1, 2, 3, 4, 6, 7, 9, 10) for both the Baton Rouge and Hope locations. For seed germination percentage 8 weeks after harvest (SG8), no differences were found among the cultivars and parental lines at Baton Rouge and at Hope where SG8 was unexpectedly low when compared to SG1. When either BG or tBG was used as a parent, no differences in SG8 were observed among corresponding populations (en-tries 3, 4, 7, 9) at Baton Rouge. The same trend
was observed at Hope except for the tBG×
Redc3 population (entry 4) that displayed 26 –
34% greater SG8 than the non-transgenic
populations containing BG (entries 7, 9). SG8 showed no difference among populations with ei-ther CP or tCP as a parent at Baton Rouge or
Hope. Redc4 and c5 exhibited statistically
sim-ilar SG8 when compared to all other entries at Baton Rouge, but the same results were not found
at Hope. For example, Redc4 and c5 exhibited
14 – 20% greater SG8 than cultivars and lines,
and significantly less SG8 than hybrid populations when red rice was used as a male (entries 1, 2, 3, 4, 10), but not as a female (entries 6, 7). The
exception to this trend was the BG×Redc4
population (entry 9).
The number of seeds/panicle at Baton Rouge
ranged from 71 to 156, but no significant
differ-ences were detected among the entries (data not shown). At the Hope location all cultivars and lines were similar in seed production per panicle. CP not unexpectedly showed greater seed
fecun-dity than Red c4, but no differences were found
when compared with Redc5 and all crosses
in-volving red rice biotypes. As was the case for
seeds/panicle at Baton Rouge, no differences
among entries were found for seed weight/panicle.
At the Hope site, seed weight/panicle was
signifi-cantly lower for tCP and Redc1×tCP than CP
and tCP×Redc1. No differences were found
among populations that used either BG, tBG, CP or tCP as a parent.
3.1. Segregation of glufosinate resistance
Red rice biotype c4 plants were all pubescent
and susceptible to glufosinate as expected (Table 4). Plants from tCP were all glabrous, but one out of 60 plants was susceptible to glufosinate which suggested physical seed mixture or unstable glufos-inate resistance in transgenic tCP. All 60 trans-genic tBG plants were glabrous, but the number of glufosinate-susceptible plants suggested
segrega-tion (1:1 R:S x2 ratio=2.4, PB0.05), seed
mix-ture or instability of glufosinate resistance. These results may help explain segregation of glufosinate
resistance in the F2 populations evaluated. For
example, glufosinate resistance showed one- or
two-gene Mendelian segregation in two F2
popula-tions derived from tCP as a parent (entries 1 and
2), however, a separate F2 population derived
from tCP (entry 6) displayed an abnormal
segrega-tion pattern with 85% of the F2plants susceptible
to glufosinate. A comparison of data from recipro-cal crosses involving tCP (entries 1 and 6) suggests that maternal effects can influence segregation pat-terns for glufosinate resistance. Abnormal or un-expected segregation ratios were also observed in
two F2 populations when tBG was used as a
parent (entries 3 and 4). An unusual S:R 37:23 ratio suggested that glufosinate resistance for en-try 3 was governed by recessive genes, but this
result must be verified in F3and later generations.
The second F2 population derived from tBG
(en-try 4) showed abnormal segregation patterns for herbicide resistance and pubescent leaves that did not fit any known Mendelian ratios.
one third of the crosses (entries 1 and 2). However,
the majority of the crosses (3/5) displayed
abnor-mal segregation for glufosinate resistance, includ-ing susceptibility as the dominant phenotype for entries 3 and 6. Reasons for the abnormal segrega-tion may be traced back to tCP and tBG that were probably unstable as parents (Table 4). Multiple insertions of the BAR gene into CP and BG may be another possible cause of the unusual segrega-tion ratios that were observed in this study. In addition, tCP and tBG were previously selected from transgenic material that was evaluated by spraying in the field with a boom nozzle and back pack sprayer (unpublished data). It is possible that the spraying method did not detect unstable lines as was done with the leaf dip method used in this study. The leaf dip method should be used to confirm results obtained by the field spraying method.
4. Discussion
The principal objective of this research was to gain additional knowledge of the consequences of BAR gene transfer from transgenic rice lines to weedy red rice. Two field trials in Louisiana and Arkansas were conducted to monitor segregation
of the BAR gene and evaluate traits associated with vegetative and reproductive success in indi-viduals produced from controlled crosses. Liberty resistance exhibited normal Mendelian behavior in
only 40% of the F2populations. Genetic instability
or gene silencing in parental transgenic lines may have contributed to the abnormal genetic behavior of the BAR gene. Transfer and segregation of Liberty resistance in red rice hybrid populations did not enhance or reduce values for certain vege-tative traits such as vigor and plant density. How-ever, we detected significant differences for plant height and maturity among populations in Louisi-ana that segregated for Liberty resistance versus those that did not contain the BAR gene. These values, however, were no greater for plant height nor earlier for maturity than the red rice entries. Seed shattering was not found to be different
among F2populations in Louisiana, but increased
seed shattering was found in two Arkansas popu-lations segregating for herbicide resistance com-pared to corresponding populations that did not contain the BAR gene. It is important to note that shattering in these populations was not greater than those detected in the red rice biotypes. For the important traits of seed dormancy and fecun-dity, neither location showed significant differ-ences among populations containing or lacking the
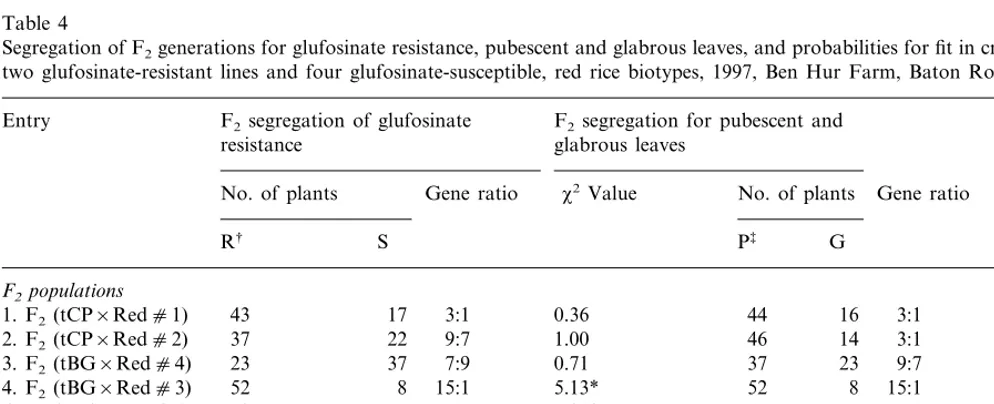
Table 4
Segregation of F2generations for glufosinate resistance, pubescent and glabrous leaves, and probabilities for fit in crosses between
two glufosinate-resistant lines and four glufosinate-susceptible, red rice biotypes, 1997, Ben Hur Farm, Baton Rouge, LA
F2segregation of glufosinate
Entry F2segregation for pubescent and
resistance glabrous leaves
No. of plants Gene ratio x2Value No. of plants Gene ratio x2Value
G P‡
S R†
F2populations
43 17 3:1 44 16 3:1 0.08 1. F2 (tCP×Redc1) 0.36
14 3:1 0.08 2. F2 (tCP×Redc2) 37 22 9:7 1.00 46
3. F2 (tBG×Redc4) 23 37 7:9 0.71 37 23 9:7 0.71
15:1 8 52
5.13* 5.13*
15:1 8 52
4. F2 (tBG×Redc3)
15 3:1 0.00 6. F2 (Redc1×tCP) 9 51 1:15 7.84* 45
Parents
60 0
8. Red c4 58 0
59 1
12. tCP 0 60
13. tBG 36 24 0 60
†Leaves of 15 plants/plot across four replications were treated with 500 ppm glufosinate at the mid-tillering stage. Leaves
scored 7 days after herbicide treatment for resistance (R) or susceptibility (S).
‡Leaves scored at mid-tillering stage as pubescent (P) or glabrous (G).
J.Oard et al./Plant Science157 (2000) 13 – 22 22
BAR gene. Results from this study are consistent with previous research [7,10] that showed no ge-netic advantage to introduction of the BAR gene into hybrid populations. However, changes in traits such as height and maturity were detected in populations from our study that contained the herbicide resistance gene. These results suggest that transfer of the BAR gene to red rice will not increase or decrease fitness values for traits such as dormancy or seed production that are associated with reproductive success of the weedy hybrids.
Acknowledgements
We thank the following for laboratory and field assistance during this research: T. Papenburg, L. Doherty, D. Jones, and F. Gatz.
References
[1] S.P. Briggs, M. Koziel, Engineering new plant strains for commercial markets, Curr. Opin. Biotechnol. 9 (1998) 233 – 235.
[2] M. de Block, J. Botterman, M. Vanderwiele, J. Dockx, C. Thoen, V. Gossele, R. Movva, C. Thompson, M. van Montagu, J. Leemans, Engineering herbicide resistance in plants by expression of a detoxifying enzyme, EMBO J. 6 (1987) 2513 – 2518.
[3] P. Christou, D.E. McCabe, B.J. Martinell, W.F. Swain, Soybean genetic engineering — commercial production of transgenic plants, Trends Biotechnol. 8 (1990) 145 – 151.
[4] M.E. Fromm, F. Morrish, C. Armstrong, R. Williams, J. Thomas, T.M. Klein, Inheritance and expression of chimeric genes in the progeny of transgenic maize plants, Biotechnology 8 (1990) 833 – 844.
[5] W.J. Gordon-Kamm, T.M. Spencer, M.L. Mangano, T.R. Adams, R.J. Daines, W.G. Start, J.V. O’Brien, S.A. Chambers, W.R. Adams, N.G. Willets, N.G. Rice, C.J. Mackey, R.W. Krueger, A.P. Kausch, P.G. Lemaux, Transformation of maize cells and regeneration of fertile transgenic plants, Plant Cell 2 (1990) 603 – 618.
[6] J.H. Oard, S.D. Linscombe, M.P. Braverman, F. Jodari, D.C. Blouin, M. Leech, A. Kohli, P. Vain, J.C. Cooley, P. Christou, Development, field evaluation, and agro-nomic performance of transgenic herbicide resistant rice, Mol. Breed. 2 (1996) 359 – 368.
[7] P.L.J. Metz, E. Jacobsen, J.P. Nap, A. Pereira, W.J. Stiekema, The impact on biosafety of the phos-phinothricin-tolerance transgene in interspecific B.
rapa×B.napushybrids and their successive backcrosses, Theor. Appl. Genet. 95 (1997) 442 – 450.
[8] T.P. Hauser, R.B. Jorgensen, H. Ostergard, Fitness of backcross and F2 hybrids between weedy Brassica rapa
and oilseed rape (B.napus), Heredity 81 (1998) 436 – 443. [9] T.P. Hauser, R.G. Shaw, H. Ostergard, Fitness of F1
hybrids between weedsBrassica rapaand oilseed rape (B.
napus), Heredity 81 (1998) 429 – 435.
[10] A.M. Chevre, F. Eber, A. Baranger, M. Renard, Gene flow from transgenic crops, Nature 389 (1997) 924. [11] A.A. Snow, P. Moran-Palma, L.H. Rieseberg, A.
Wsze-laki, G.J. Seiler, Fecundity, phenology, and seed dor-mancy of F1 wild-crop hybrids in sunflower (Helianthus
annus, Asteraceae), Am. J. Bot. 85 (1998) 794 – 801. [12] H.I. Oka, W.T. Chang, Hybrid swarms between wild and
cultivated rice species Oryza perennis and O. sati6a, Evolution 15 (1961) 418 – 430.
[13] J.E. Hill, R.J. Smith, D.E. Bayer, Rice weed control: current technology and emerging issues in temperate rice, Aust. J. Exp. Agric. 34 (1994) 1021 – 1029.
[14] S.A. Langevin, K. Clay, J.B. Grace, The incidence and effects of hybridization between cultivated rice and its related weed red rice (Oryza sati6a L.), Evolution 44 (1990) 1000 – 1008.
[15] W. Schuh, M.R. Nelson, D.M. Bigelow, T.V. Orum, C.E. Orth, P.T. Lynch, P.S. Eyles, N.W. Blackhall, J. Jones, E.C. Cocking, M.R. Davey, The phenotypic char-acterization of R2 generation transgenic rice plants under field conditions, Plant Sci. 89 (1993) 69 – 79.
[16] P. Bregitzer, S.E. Halbert, P.G. Lemaux, Somaclonal variation in the progeny of transgenic barley, Theor. Appl. Genet. 96 (1998) 421 – 425.
[17] S. Sankula, M.P. Braverman, J.H. Oard, Genetic analy-sis of glufosinate reanaly-sistance in crosses between trans-formed rice (Oryza sati6a) and red rice (Oryza sati6a), Weed Technol. 12 (1998) 209 – 214.
[18] S.Y. Lin, T. Sasaki, M. Yano, Mapping quantitative trait loci controlling seed dormancy and heading date in rice,Oryza sati6aL., using backcross inbred lines, Theor. Appl. Genet. 96 (1998) 997 – 1003.
[19] M.A. Cohn, Chemical mechanisms of breaking seed dor-mancy, Seed Sci. Res. 6 (1996) 95 – 99.
[20] M.A. Cohn, QSAR modeling of dormancy-breaking chemicals, in: R.H. Ellis, M. Black, A.J. Murdoch, T.D. Hong (Eds.), Basic and Applied Aspects of Seeds, Kluwer, Dordrecht, 1997, pp. 289 – 295.
[21] M.A. Cohn, J.A. Hughes, Seed dormancy in red rice (Oryza sati6a) I. Effect of temperature on dry-after ripening, Weed Sci. 29 (1981) 402 – 404.
[22] K.A. Gravois, K.A.K. Moldenhauer, F.L. Baldwin, S.D. Linscombe, Evaluation of Liberty-resistant rice in Ar-kansas, in: R.J. Norman, T.H. Johnson (Eds.), Arkansas Rice Research Series 456, University of Arkansas, 1996, pp. 12 – 16.
[23] SAS Institute Inc, JMP7 Statistics and Graphics Guide, SAS Institute Inc, 1994.