1
Could the Aggregate of Accounting Earnings Predict Gross Domestic Products? Evidence from Developing Countries and Methodological Refinement
Sumiyana Sumiyana
University of Gadjah Mada
Abstract
This study investigates the relationship between the aggregate of accounting earnings and gross domestic product (GDP) in developing countries. More specifically, it investigates the informativeness of accounting earnings as a predictor of macro economy growth. It finds evidences that accounting earnings is a predictor of future GDP growth. It also depicts that the informativeness of accounting earnings is not only in the capital market level, but also in macro economy level. The finding of this study argues that the informativeness of accounting earnings can be used to predict macro economy. This study suggests that accounting numbers are not fully able to reflect economic productivity of all developing countries. In other words, the aggregate of accounting earnings in the developing countries has not contained similar properties to predict GDP growth as those in the developed countries.
Keywords: accounting earnings (numbers), growth, gross domestic product, developing
countries, methodological refinement
__________________
2
INTRODUCTION
The most current issue arising is about the role of accounting earnings in firm’s level in influencing macro economy. This relation is rarely examined by accounting researchers (Konchitchki and Patatoukas, 2014), although it has actually been raised by Beaver (1988), Kothari (2001), and Ball, et al. (2009). This study investigates the relationship between accounting earnings and GDP in developing countries and simultaneously refines prior studies’ methodologies. Furthermore, this study more specifically investigates the informativeness of accounting earnings as a predictor of macro economic growth in the developing countries to support evidences in developed countries.
This study is important as it may provide novel evidences about the informativeness of accounting earnings as a predictor of economic growth. Basically, researchers believe that GDP is an indicator of economic activities including investments, production inputs, and labors absorption (Konchitchki and Patatoukas, 2014). GDP is statistic summary of those indicators (Bureau of Economic Analysis, 2007). The economists have also concentrated on GDP and its growth (Zarnowitz and Braun, 1993). However, economics and accounting researchers do not yet relate aggregate accounting earnings to GDP growth (Konchitchki and Patatoukas, 2014). Secondly, the usefulness of this study is for decision makers as well as a country’s central bank, national development body, and World Bank. For developing countries, this study can be used to predict a country’s budget in the future, monetary policy, fiscal policy as well as policies for capital market.
3 This study employs some assumptions. Firstly, representativeness of firms listed on a country’s capital market is a reflection of national macro economy. This assumption is very weak for developing countries as there are only few companies listed on the capital market. It differs from companies in developed countries where most of their companies are listed on the capital market. However, this assumption still applies as private firms usually become suppliers and customers of public companies and vice versa. Secondly, all listed firms on a country’s capital market root on utilitarianism ethics that aims to increase national welfare. This assumption also formulates that all firms intend to collectively move forward on self-interest basis. Thirdly, this study uses linearity assumption of the relationship between accounting earnings profit and future predicted GDP. This linearity is based on a belief that there would be information contents of accounting earnings toward national macro economy. Lastly, the author believes that both of GDP growth and accounting numbers contain high disclosure validity. In other words, this study accepts those two numbers.
This study uses established theories and prior studies. Ball et al. (2009) theorize that accounting earnings contains a concept of systematic component. This concept shows that accounting earnings in firm level presents information contents to the capital market. Furthermore, it presents information contents for predicting GDP aggregately. This Ball, et al.’s (2009) argument has actually been formulated by Kothari (2001) that there is a strong association between accounting earnings and market returns’ volatilities. Thus, according to Ball, et al.’s (2009) and Kothari’s (2001) theory, this study ties capital market, foreign exchange reserves, monetary policy, and fiscal policy related theories. Gonedes (1973b) argues that accounting earnings growth can lever foreign exchange reserves on the next year. Likewise, Taylor (1993) and Clarida, et al. (2000) conclude that an increase in accounting earnings is usually followed by monetary policies as well as fiscal policies for the next years. In addition, Landefeld, et al. (2008), Newey and West (2007), and Bureau of Economic Analysis (2007) find similar conclusion.
4 economy. It shows that “micro to micro” relationship which explains accounting earnings and market returns does not stop here. “Micro to micro” relationship that explains the aggregate of accounting earnings and national macro economy has become a new phenomenon (Konchitchki and Patatoukas, 2014). Likewise, “macro to micro” relationship explains that GDP growth level is able to improve firms’ accounting earnings level (Konchitchki, 2011). Therefore, it can be said that this study extends the informativeness of accounting earnings and methodological improvement of prior studies.
This study is structured as follows. Part 2 highlights literature review and hypothesis development. Part 3 fully explains the research method of this study, ranging from sampling and hypothesis testing. Part 4 discusses descriptive statistics, analysis, and findings. Part 5 summarizes conclusions, suggestions, and the possibility of future research.
LITERATURE REVIEW AND HYPOTHESIS DEVELOPMENT
Accounting Earnings
Gonedes (1973a) formulates that accounting earnings (accounting numbers) is propositioned as having strong ability to influence the capital market or more likely known as economy-wide. In this regards, accounting earnings has an ability to widely influence the capital market (Brown and Ball, 1967; Gonedes, 1973b). Accounting earnings at firm level influences capital market through similar industries and influences the national economy of a country although the influence can be formed reversely. These previous three studies have started to identify accounting earnings properties related to their ability to extensively influence economy. Therefore, this study shows that accounting earnings, capital market rate of return, industry-wide, and national economic, complement each other.
Prior studies have examined the influence of accounting earnings. First, they investigated the influence of accounting earnings to share prices using accounting earnings properties individually. On this phase, the prior studies employ individual accounting earnings properties to influence share price and it is known as firm-specific
approach (Basu, 1977; Dechow, et al., 1998; Skinner and Sloan, 2002; Lopez and Rees,
5 2007). Nevertheless, prior studies related to this market-wide have been designed by Brown and Ball (1967), Gonedes (1973b) and Kothari et al. (2006). The influence of accounting earnings in this regards includes capital market movements and national macro economy, which shows that its influences have been developing widely within the national economic level and vice versa.
The influence of accounting earnings properties on the national macro economy has been continuously studied by some researchers, such as Konchitchki and Patatoukas (2014) and Patatoukas (2013). On this phase, the level of study is not on the individual level of accounting earnings properties, but it is on the national aggregate of accounting earnings properties. Furthermore, the accounting earnings influences monetary policy, foreign exchange policy, fiscal policy and macro economy as a whole. The results of these two studies show that the aggregate of accounting earnings influences national macro economy climate. It also shows that the aggregate of accounting earnings has informativeness not only at firm level, but also at market-wide and national-wide level.
GDP and Its Growth
To date, economics still believes that GDP and its growth are the measure of national revenue and social welfare (Fleurbey, 2009; Fleurbey and Gaulier, 2009; Henderson, et al., 2012). GDP measures income from all entities and households involved in economic activities within a country. Meanwhile, these studies also argue that GDP and its growth are comprehensive indicators that can measure national income reliably. On the other hand, Becker et al. (2005) argue that it has a function of consumption utility which could also be seen (from opposite) as a function of income utility. Related to its function as consumption and income measurement, GDP might be seen as productivity measurement which has been done by all firms and households nationally. Thus, GDP primarily measures performance of economic activities of a country.
6
Accounting Earnings and Future GDP Growth
McClosky (1993) argues that accounting logic relates to country’s accounting logic especially in term of national income. He explicitly argues that firms pay employees’ wages which will be consumed. If there is an amount left from their wages, they may save it on a saving account. Meanwhile, a country supplies money for the sake of firms and its employees. Thus, McClosky (1993) concludes that the life of a firm is reflected by either its expenses or income. Therefore, it is the reflection of national income of a country.
Moreover, accounting and financial management researchers (for example Fama, 1981) have also argued that share prices or returns in the capital market reflect the inflation level and the money supply. The congeniality of variance movement between share return and the money supply as well as inflation is always harmonious. It is consistent with the arguments of Fischer and Merton (1984). They state that macro economy plays a role in improving capital market and vice versa. Study related to capital market as well as money market has been done by Harvey (1989). Harvey (1989) argues that economic growth is denominated by capital market development and bond market. Similarly, Shelvin (1990) concludes that a country’s revenue from firms’ taxes shows the marginally increasing movement from revenue and all firms’ losses within a country. These all studies show that harmonious movements between the GDP and total national income and capital market are included as money market. Either it is from the GDP or capital market as well as money market point of view; these two extremes determine the growth and improvement of each other.
On the last decade, more in depth studies have been undertaken by Kothari, et al. (2006), Lev and Nissim (2004), and Ho and Sequiera (2007). They argue that earned returns do not merely come from the movement of accounting earnings of a firm individually. However, the movement of earned returns comes from national economic movements, whilst capital market automatically levers national economic improvement. The concept of these studies changes the paradigm, from firm-specific approach to
7 Some studies concluded that macro economy is able to move a firm’s ability to earn profit (McClosky, 1993; Fischer and Merton, 1984; Harvey, 1989). In addition, other studies also provided evidences that firms’ activities reflected on accounting earnings increase the national income growth as well as GDP (Kothari, et al., 2006, Lev and Nissim, 2004), Ho and Sequiera, 2007). Thus, this preliminary study concludes that firms’ ability to earn profit and firm’s economic activities influence capital and money market. This dependency has become the basis for developing this study.
Hypothesis Development
This study argues that the aggregate of accounting earnings is useful to predict the future of GDP growth. Prior studies argue that GDP growth could be predicted not only through macro economy indicator, but also through the aggregate of accounting earnings of all listed firms in the capital market which could be deemed as good indicator (Konchitchki, 2011; Konchitchki and Patatoukas, 2014). This study has explored that the GDP growth predictor does not exist yet. Therefore, it proposes that accounting numbers aggregately can be functioned as the predictor of GDP growth.
GDP and its growth reflect all firms’ consumption as well as households’ consumption within a country. It depicts that the GDP and its growth reflect all firms’ and households’ income within a country (Bureau of Economic Analysis, 2002; 2004; 2007). Accounting earnings showing the difference between income and expenses should reflect GDP and its growth (Bureau of Economic Analysis, 2002; 2004; 2007). Thus, this study hypothesizes that the aggregate of accounting earnings earned from a country’s capital market could predict the GDP and its growth. It constructs the hypothesis statements as follows.
HA1: The aggregate of accounting earnings positively associates with the GDP growth.
HA2: The changes on the aggregate of accounting earnings positively associates with the GDP growth.
RESEARCH METHOD
Sample and Unit Analysis
8 within a country, ranging from the established year of the capital market to 2013. This study employs capital market data in Asia-Pacific and African countries as they are categorized as underdeveloped and developing countries. In addition, predicted and future GDP are obtained from central bank within a country. Predicted standard deviations are also obtained from statistics data form central bank within a country, if any. If no data were found, this study analyses yearly future predicted GDP deviation (Romer and Romer, 2000; Landefeld et al., 2008; Konchitchki and Patatoukas, 2014). Data related to GDP properties are also collected form World Bank and its website.
This study employs national-year unit analysis. Nation refers to the aggregate of accounting earnings by totaling all profits of all listed companies in the capital market within a country. Calculation process is complemented by scaling changes on the aggregate of accounting earnings with its previous year. Year refers to yearly total accounting earnings of capital market in every country. Therefore, the timeline of this study uses the aggregate of accounting earnings of all listed companies in the capital market in every country from year to year.
Variables and Measurements
This study uses three main variables, i.e. the aggregate of accounting earnings (X), GDP growth (g), and error variance of predicted GDP (E). In regards to unit analysis, variables are defined as the aggregate of accounting earnings (Xit), GDP growth (git), and variance error of the predicted GDP (eit), while “i” represents national level, ‘t” represents year. Moreover, this study calculates the aggregate of accounting earnings growth ( Xit) by subtracting the current earnings to last year’s earnings (Xit -Xit-1). This
accounting earnings growth is scaled by aggregate of total asset (Ait), aggregate of total
debt (Lit), aggregate of total revenue (Rit) or last year (t-1) aggregate of share’s book
value (Bit) of all listed companies. This scale is formulated to eliminate size bias of the
capital market from every country.
This study associates between the aggregate of accounting earnings and the next year’s predicted GDP growth (git+1). In determining the value of predicted GDP growth
(git+1), researchers have agreed on a consensus in which the predicted growth has to be
9 adjusted GDP growth (git+1). Therefore, the GDP growth used to predict variable should be (git+1) – (eit+1.git+1).This study defines predicted growth not only by predicting one year forward (lead), but also predicting the GDP with four years lag lead, so that (git+k) –
(eit+k.git+k), while k represents 1, 2, 3, and 4.
Hypothesis Testing
To test the hypotheses, this study constructs several regression models. Firstly, it examines the association between the next year’s predicted GDP and the aggregate of current accounting earnings. This test acts as initial identification that the aggregate of accounting earnings has a nature to predict the GDP growth. The regression model is as regression model with changes in earnings aggregate differentiation Xit. The second regression model is as follows.
Moreover, this study considers predictive consensus toward the GDP growth. The next testing includes previous GDP predictive elements (Abarbanell, 1991; Baghestani and Kianian, 1993; Zarnowitz and Braun, 1993; Chung and Kryzanowski, study complements linearity testing to decrease error bias by employing normality, heteroscedasticity, and multicollinearity (White, 1980). The objectives of these tests are to ensure that regression models are linear and have no dominant error bias (White, 1980). The hypothesis testing is specifically emphasizing on the coefficient of k 0 and
k> 0 to answer the direction and the strength of the influence of earnings aggregate to
10
Sensitivity Test
To complement the validity of the conclusions, this study takes a retest to separate samples into several partitions. Separation of samples is exercised country-to-country; a group of countries such as Southeast Asia, South Asia, East Asia, etc.; as well as a group of continents such as Asia and Africa. This study argues that the GDP growth behavior tends to be similar for countries in a particular area cluster. Furthermore, it makes cut-off separation from year-to-year particularly in the years of global financial crisis (2009-2010). The separation either by excluding years or cutting-off yearly period is to show the effect of global financial crisis to accounting earnings. More specifically, the error of predictive bias has largely increased its influence while world’s economy decreases drastically.
ANALYSIS AND DISCUSSION
Descriptive Statistics
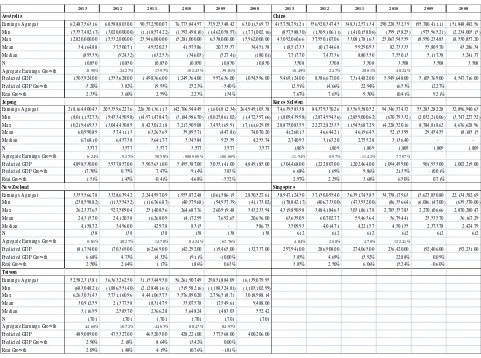
This study identifies 23 Asian countries around Pacific Oceans. Nevertheless, it only involves nine Asia-Pacific countries on the sample as there is no capital market information, earnings aggregate, or GDP growth data in eight countries. Those countries are Bhutan, Bangladesh, Cambodia, Brunei Darussalam, North Korea, Macau, Papua Nuginea, Vietnam, and Timor Leste. This study also separated developed countries from the sample, such as Singapore, Taiwan, Japan, China, and South Korea. On the other hand, there are 45 African countries. However, there are only 29 countries that have adequate information from OSIRIS database. Out of 29 countries, 13 countries (Benin, Burkina Faso, Gabon, Gambia, Liberia, Mauritus, Niger, Rwanda, Senegal, Sudan, Togo, Uganda, and Zimbabwe) experience mortality as the issuers are only one to three firms. Thus, this study employs 28 Asia-Pacific and African countries from the year of 2009-2013.
11 issuers in Indonesian capital market is -20.71%, although in average, it increases US$40,222.49 million in 2013. Predicted GDP numbers are demoniated in US$ billions so that Indonesian GDP increases US$870,275.000 billion.
As a comparison, this study also presents developed countries data in Table 1b Panel B. It shows that GDP growth and accounting earnings growth incline to be higher in developing countries, whilst it is relatively low in developed countries with highly certain future growth. Earnings aggregate growth in developed countries increase smoothly from year to year. On the other hand, it piercingly fluctuated in developing countries, for example in Indonesia and Malaysia whose earnings aggregate increased in 2010, 2011, and 2012, but deceased sharply in 2013.
12 P redict ed GDP Growt h 0.97% -1.14% 10.04% 25.14% 11.62% -0.86% 3.81% 19.21% 31.70% 5.51% Real Growt h 5.02% 4.74% 6.67% 10.21% 8.30% 5.79% 6.27% 6.49% 6.22% 4.63% P redict ed GDP Growt h 14.77% 16.60% 17.83% 22.57% 5.48% 2.69% 5.40% 16.89% 22.37% -12.46% Real Growt h 8.15% 8.20% 8.04% 8.53% 7.50% 4.75% 5.64% 5.19% 7.43% -1.51% P redict ed GDP Growt h 11.57% 17.82% 41.37% 35.19% -18.25% 2.07% -0.84% 18.80% 24.48% 2.47% Real Growt h 11.74% 12.40% 17.51% 6.37% -1.27% 3.85% 4.78% 3.42% 4.82% 4.53% P redict ed GDP Growt h 12.37% 0.37% 19.38% 17.87% 3.24% 5.82% 5.87% 8.39% 20.93% -3.25% Real Growt h 7.25% 6.34% 8.25% 8.02% 3.54% 2.89% 6.49% 0.08% 7.81% -2.33%
P redict ed GDP Growt h 8.72% 11.64% 12.30% 18.46% -2.95% 2.24% 4.22% 23.69% 17.62% -19.85%
13
Table 1a Descriptive Statistics per Nation (Continue)
Panel A: Developing Countries
Note: Earnings Aggregate, along with minimum, maximum, mean, and median is stated in US$ million; Predicted GDP is stated in US$ billion; N depicts the number of issuers listed in capital market
14
Table 1b Descriptive Statistics per Nation
Panel B: Developed Countries
Note: Earnings Aggregate, along with minimum, maximum, mean, and median is stated in US$ million; Predicted GDP is stated in US$ billion; N depicts the number of issuers listed in capital market.
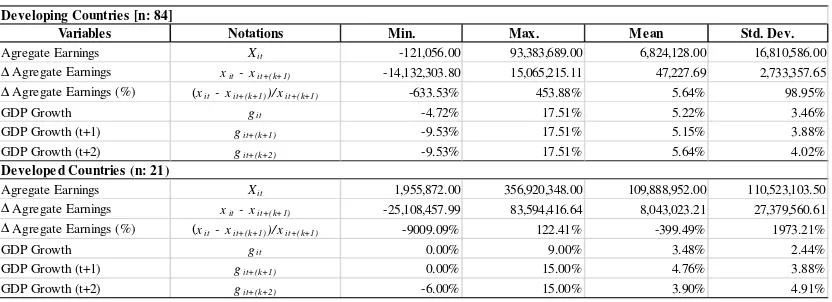
From each nation’s data, this study summarizes descriptive statistics for the sample. Descriptive statistics total is presented as weighted average. Table 2 shows descriptive statistics of this study. This study separates the sample into 2 groups, i.e. developing countries and developed countries.
Inferences which could be gained from Table 2 as comparison between developing countries and developed countries are as follows. The earnings aggregate growth of the developing countries is higher than that of the developed countries. It grows ranging from 4.00-5.00% in developing countries, whilst it is only 3.00-4.00% in developed countries. Critical point that has to be noted is GDP growth in the developing countries that grows at least 0.00%. Contrary to the developed countries, it could grow below zero point, with -9.33% at the maximum in developing countries. However, under-zero growth was only experienced by African countries which faced political
2013 2012 2011 2010 2009 2008 2013 2012 2011 2010 2009 2008
Aus tralia China
Earnings Agregat 62,487,563.16 68,588,803.00 90,572,500.07 76,773,844.97 37,925,348.42 63,011,569.73 415,758,791.21 356,920,347.45 348,312,571.34 290,228,532.39 195,780,411.11 151,848,482.56 Min (5,357,482.17) (3,020,000.00) (1,118,574.22) (1,392,498.10) (1,462,058.97) (1,771,002.16) (857,588.30) (1,309,106.11) (1,410,158.06) (399,158.25) (975,965.21) (2,234,005.15)
15 crisis and national leaderships chaos such as Malawi in 2010, Sudan in 2012, Cote d’Ivore in few years, and India in 2012.
Table 2 Descriptive Statistics
Note: Earnings Aggregate, along with minimum, maximum, mean, and median is stated in US$ million; Predicted GDP is stated in US$ billion; N depicts the number of issuers listed in capital market. Xitis the aggregate of accounting earnings; Xit = Xit - Xit-1is the aggregate of accounting earnings growth; git+1is
next year’s GDP growth; (k + n), n = 1 and 2 show lead and lag year n.
This study assures reliability of descriptive statistics data. A developed country which experienced aggregate earnings growth by -9,009.09% is Japan, when it was hit by Tsunami in 2010. Meanwhile, some developing countries also experienced aggregate earnings growth by -633.53% in 2011 when civil war occured due to leadership crisis. It depicts that leadership power seizure is usually marked by negative growth. Nevertheless, Egypt experienced stable positive GDP growth while they had three times changes in leaderships.
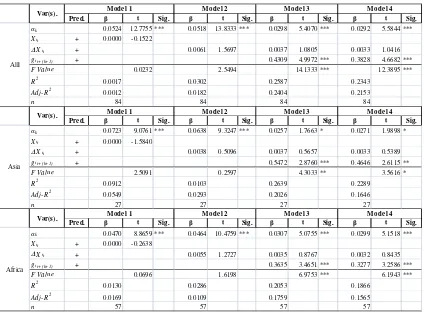
Analysis
Analysis shows that the aggregate of accounting earnings does not associate with GDP growth. Table 3 presents that the aggregate of accounting earnings (Xit) does not influence with the beta value of 0.000 and t-value of -0.1522 in Model 1. Thus, hypothesis H1 is not supported. It depicts that the aggregate of accounting earnings cannot explain or predict next year’s GDP. The same test undertaken for changes in the aggregate of accounting earnings (∆Xit) produces beta value of 0.0061 and t-value of 1.5697 in Model 2. It shows that hypothesis H2 is not supported, meaning that changes in the aggregate of accounting earnings do not associate statistically. This study proposes methodology refinement concept by changing the aggregate of accounting
Variables Notations Min. Max. Mean Std. Dev.
Agregate Earnings Xit -121,056.00 93,383,689.00 6,824,128.00 16,810,586.00
∆ Agregate Earnings xit - xit+(k+1) -14,132,303.80 15,065,215.11 47,227.69 2,733,357.65
∆ Agregate Earnings (%) (xit - xit+(k+1))/ xit+(k+1) -633.53% 453.88% 5.64% 98.95%
GDP Growth git -4.72% 17.51% 5.22% 3.46%
GDP Growth (t+1) git+(k+1) -9.53% 17.51% 5.15% 3.88%
GDP Growth (t+2) git+(k+2) -9.53% 17.51% 5.64% 4.02%
Agregate Earnings Xit 1,955,872.00 356,920,348.00 109,888,952.00 110,523,103.50
∆ Agregate Earnings xit - xit+(k+1) -25,108,457.99 83,594,416.64 8,043,023.21 27,379,560.61
∆ Agregate Earnings (%) (xit - xit+(k+1))/ xit+(k+1) -9009.09% 122.41% -399.49% 1973.21%
GDP Growth git 0.00% 9.00% 3.48% 2.44%
GDP Growth (t+1) git+(k+1) 0.00% 15.00% 4.76% 3.88%
GDP Growth (t+2) git+(k+2) -6.00% 15.00% 3.90% 4.91%
Developing Countries [n: 84]
16
next year’s GDP growth; for Model 4, dependent variable is transformed from git+1intogit+1 – eit+1.git+1 as
17 Initially, this study separates the samples into Asia-Pacific and African countries. This partition is based on capital market indicators in African countries in which the number of the issuers is relatively small and the weak form of the capital market. The test shows that the aggregate of accounting earnings is not able to predict next year’s GDP, either for Asia-Pacific or African countries. The t-value in model 1 is -0.1522 and -0.2638 for Asia-Pacific and Africa, respectively. After the partition, hypotheses H1 is not supported, again. Similarly, changes in the aggregate of accounting earnings in Model 2 produce t-value of 0.5096 and 1.2727 for Asia-Pacific and African countries, respectively. It depicts that refinement to changes in numbers is not supported and hypothesis H2 is not supported either. Nevertheless, previous year’s GDP growth predictor is consistently able to predict next year’s GDP growth. However, hypotheses H1 and H2 are not supported in Model 3 and Model 4.
The result of the test by inducing previous year’s GDP growth predictor can improve the fitness model. It can be shown by the increase in Adj-R2 from Model 1 and Model 2 valued 0.0012 and 0.0182, respectively, relative to Model 3 and Model 4 valued 0.2026 and 0.2153, respectively, for all sample. The result of sample partition into Asia-Pacific and Africa also shows the equivalence of the fitness model level as depicted on sample as a whole.
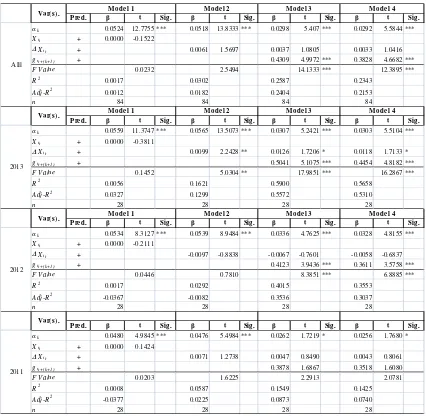
Sensitivity Test Result
This study undertakes yearly basis sensitivity test. Aside from partition test as in Table 3, this study can only undertake yearly basis sentivity test. The reason is that country basis partition cannot be done as the research period is only ranging from 2009 to 2013 and small numbers of issuers in developing countries. Likewise, most of developing countries do not have adequate data and information related to GDP growth as well as fluctuated the aggregate of accounting earnings data that could not be thought logically. The result of sensitivity test is presented on Table 4.
18
next year’s GDP growth; for Model 4, dependent variable is transformed from git+1intogit+1 – eit+1.git+1 as
19 2012, GDP growth predictor has beta value of 0.4123 and 0.3611 for model 3 and Model 4 respectively, with significant level of 1.00%.
Yearly sample partition depicts improvement in model fitness as shown on the previous test. This improvement is as a result of inducement of previous year’s GDP growth predictor. The level of model improvement can be seen from the increase in Adj-R2from Model 1 and Model 2, having the value of 0.0327 and 0.1299, respectively, relative to Model 3 and Model 4, having the value of 0.5572 and 0.5310, respectively, for 2013 partition.
Control Group: Developed Countries
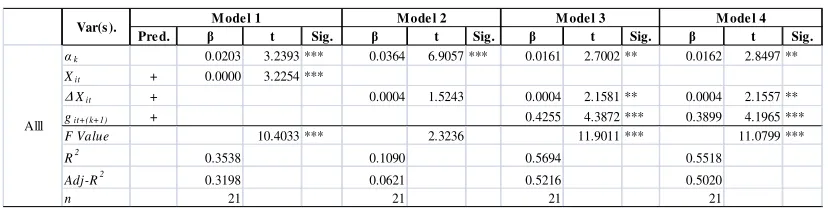
This study cannot find evidences that accounting earnings is useful to predict next year’s GDP growth although it can support it for 2013 data. Therefore, this study undertakes one-side test by using developed countries as the samples. Developed countries employed in this study are Australia, New Zealand, Taiwan, Singapore, South Korea, Japan, and China during five year period. The results are presented in Table 5.
Table 5 Developed Countries Regression Results
Note: ***, **, and * significant at 1.00%, 5.00%, and 10.00% significant level respectively. Xit is the
aggregate of accounting earnings; Xit = Xit - Xit-1 is the aggregate of accounting earnings growth; git+1 is
next year’s GDP growth; for Model 4, dependent variable is transformed from git+1intogit+1 – eit+1.git+1 as
growth modified process; (k + n), n = 1 and 2 show lead and lag year.
In developed countries, the aggregate of accounting earnings is positively associated with next year’s GDP growth, producing t-value of 3.2254 at 1.00% significant level in Model 1. Thus, hypothesis H1 is supported. It explains that the aggregate of accounting earning can predict next yaear’s GDP growth. Otherwise, changes in the aggregate of accounting earnings in Model 2 are positively associated but not statistically significant, so hypothesis H2 is not supported. After including previous year’s GDP growth predictor numbers, changes in the aggregate of accounting earnings are positively influenced amounting to 0.0004 with t-value of 2.1581 at 1.00%
Pre d. t Sig. t Sig. t Sig. t Sig.
k 0.0203 3.2393 *** 0.0364 6.9057 *** 0.0161 2.7002 ** 0.0162 2.8497 ** Xit + 0.0000 3.2254 ***
∆Xit + 0.0004 1.5243 0.0004 2.1581 ** 0.0004 2.1557 **
git+(k+1) + 0.4255 4.3872 *** 0.3899 4.1965 ***
F Value 10.4033 *** 2.3236 11.9011 *** 11.0799 ***
R2 0.3538 0.1090 0.5694 0.5518
Adj-R2 0.3198 0.0621 0.5216 0.5020
n 21 21 21 21
Alll
20 significant level in Model 3. Thus, hypothesis H2 is supported. This is consistent with Model 4. This study shows that changes in the aggregate of accounting earnings have a role as next year’s GDP growth predictor.
This study does not examine country-group basis as well as year basis for developed countries as developed countries in Asia-pacific and Africa are only seven countries which effectively elaborated to become 21 firm-years. Although it does not undertake partition test, the degree of fitness model in developing countries shows considerable result. It can be shown by high Adj-R2value amounted to 52.16% in Model 3 and 55.18% in Model 4, from only 6.21% in Model 2. Therefore, this study is able to support methodology refinement concept in which changes in the aggregate of accounting earnings acts as a next year’s GDP growth predictor in developing countries.
Discussion, Examination, and Findings
This study finds that the aggregate of accounting earnings is not associated or is not able to predict next year’s GDP growth for developing countries. Similarly, changes in the aggregate of accounting earnings are not associated with the GDP growth. Although Gonedes (1973a; 1973b) and Brown and Ball (1967) conclude that accounting earnings influences the nationals’ economy-wide, this study does not support this concept.
Konchitchki and Patatoukas (2014) and Patatoukas (2013) argue that the aggregate of accounting earnings influences national macro economy. They also depict that the aggregate of accounting earnings has informativeness level not only at firm level, but also at market-wide level and national-wide level. These studies conclude that accounting earnings has properties. This concept is true, however, it is not considering the position of that accounting earnings properties yet, meaning that those properties are true when the context is in the developed countries, not in the developing countries.
21 year to year should be on a note, when those total numbers are calculated perfectly and comprehensively.
Fama (1981), Fischer and Merton (1984), Harvey (1989), and Shevlin (1990) argue that economic growth is the denominator of capital market and bond market development. These studies argue that a national income is the sum of progressive firms taxes from all of firms’ income and profit, and conversely for all of firms’expenses and losses within a country. The point is all these studies argue that there is a conformity among the aggregate of accounting earnings, capital market, and GDP movement. However, they undertook research in a country in which the capital market is relatively close to strong form (capital market hypothesis). This hypothesis argue that resources are allocated efficiently. Contrary to developing countries, efficient resources allocation might not occur since the economic is still fractional or partial.
According to the previous discussions, this study finds that the aggregate of accounting earnings has the same properties in every capital market within a country. Nevertheless, those properties should be understood conditionally, especially in developing countries relative to developed countries. The differences of accounting earnings properties and inability of the aggregate of accounting earnings to predict the next year’s GDP are caused by some factors as follows.
First, developing countries have greater future economic uncertainty than that of developed countries. Production factors in developing countries usually rely on supplies from developed countries. Simultaneously, the price of those production factors is moving along with currency and inflation movements in developing countries. Production factor supply, inflation, and national currency in developing countries influence the fluctuation of production cost and income of firms in developing countries. It affects the volatility of accounting profit earned by firms in developing countries so that total of the aggregate of accounting earnings could not act as reliable predictor of future GDP growth. This finding is supported by greater volatility of the aggregate of accounting earnings in developing countries rather than that in developed countries.
22 not contribute to high economic productivity value. Consequently, low economic productivity causes null association between earnings aggregate and future GDP growth. Second, association between the accounting earnings and the future GDP growth could not capture the activity of real sector economy in developing countries. In addition, the aggregate of accounting earnings is not able to capture earnings from private firms and small to medium enterprises (SME). For example in Indonesia, the number of private companies are about 47,000 companies and the number of SME are 12,000 SMEs. Total accounting earnings of that private and SME firms should be higher than earnings obtained from 478 listed firms in 2012.
The above mentioned points are occuring reversely in capital market in developed countries. The point is that the aggregate of accounting earnings properties in the developing countries is different from that in the developed countries. Those properties show that the aggregate of accounting earnings has informativeness level at market-wide level and national-wide level. This study finds that those properties should consider its position, meaning that accounting earnings properties in the developed countries could relatively capture most of economic sectors within a country with efficient resources allocation. However, it does not occur in the developing countries.
Finally, most of developing countries do not have integrated national administration and accounting system to recognize and to record income productivity as well as consumption from all economic sectors. This finding relates to the second finding of this study. The developed countries relatively own formal economic form. Meanwhile, the developing countries do not have such a form yet. In other words, the developing countries are dominated by informal sectors. Futhermore, informal sectors in the developing countries are not recorded and recognized into total GDP. Simultaneously, the aggregate of accounting earnings could not record and recognize it either. Therefore, GDP as well as accounting earnings could not act primarily to assess performance activities or economic productivity of a country. On the other hand, the developed countries are able to record and to recognize or formalize underground economy productivity.
CONCLUSION, LIMITATION, AND FUTURE STUDY
Conclusion
23 earnings is not a good predictor for future GDP growth in the developing countries. This conclusion is based on the test results after partitioning the sample into Asia-Pacific and Afria group. In addition, it is also supported after this study undertakes yearly basis sensitivity test. Nevertheless, this study finds one evidence in 2013 that changes in accounting earnings is a reliable predictor for future GDP growth in the developing countries. However, it is only an incidental finding.
Aside from that incidental finding, this study concludes that developing countries in 2013 experienced economic certainty as there were few economic changes. It was influenced by previous economic climate in 2012. Additionally, this study indentifies possibilities that cause the unsupported evidences of the objectives of this study. It argues that accounting numbers are not fully reflecting economic productivity in the developing countries due toseveral arguments. Firstly, most of developing countries have greater future economic uncertainty relative to that in developed countries. This economic uncertainty is related to resources allocation that is not able to create economic value added. Secondly, the accounting numbers and GDP could not capture economic real sectors in the developing countries. In addition, the aggregate of accounting numbers could not capture most of private firms’ and SME’s profit that contribute to economic activity dominantly. Laslty, most of developing countries do not have adequate national administrative and accounting integrated system in order to recognize and to record all of income productivity as well as consumption from all economic sectors.
The three possibilities mentioned above come from internal economic climate in developing countries. This study identifies economic-political and sociocultural factors that cause the null association between the aggregate accounting earnings and the future GDP growth. Those factors are as follows. There are so many costly power seizure in developing countries. Consequently, it poorly affects economic productivity which leads to low GDP growth. Evidences show that Algeria, Sudan, Egypt, Thailand, Cambodia, Myanmar, Uganda, etc., are still in leaderhip conflict.
24 physiological and self-security, but also extended to self-esteem and self-genuine actions. This sociocultural distinction between the developed and the developing countries leads to different GDP numbers and its growth.
Limitations
This study has some limitations. Firstly, it does not consider the basis concept of GDP measurement. GDP focuses on cost of good sold, whilst accounting earnings measures aconomic value added as a result of retaining a firm’s capital which already excludes cost of good sold. The distinction concept that underlies these two measurements leads to total number of GDP is as multiplier effect of cost of good sold. Secondly, accounting earnings is a value added of private sector. This study does not induce government expenditures as next year’s GDP growth predictor. Nevertheless, this study rejects the notion that most of government expenditures are obtained from the total of private firms’ profit. Similarly, state-owned companies’ profit adjoints with private firm’s profit. However, this study could not identify the magnitude of the adjoint productivity.
Thirdly, most of developing countries have distinct accounting standards for
different sector. For example, general accounting standards are for firms listed in capital market and shariah accounting standards for firms with sharia basis. This condition shows that the aggregate of accounting earnings is not produced by one single set of accounting standards. The heterogenity of accounting standards lead to inability of earnings aggregate to predict macro economy activity regarding relative earnings aggregate produced by developed countries which generally come from one single set of accounting standards. Fourthly, most of GDP calculation in developing countries is still using multi-sector approach so that calculated GDP is not fully real. For example, informal sectors in developing countries do not record its production cost as well as income for other entities. Similarly, developed countries may record and recognize their underground economy into its GDP, but it is unrecorded in the developing countries.
Future Study
25 studies may examine ability of the aggregate of accounting earnings produced by IFRS and SFAC/S. Future studies should be able to formulate statistical-conclusion validity as next year’s GDP growth predictor.
Secondly, due to the inability of this study to support the association between the
26
REFERENCES
Abarbanell, J., (1991). Do Analysts' Earnings Forecasts Incorporate Information in
Prior Stock Price Changes? Journal of Accounting and Economics, Vol.: 14 (2), pp.
147–165.
Ang, A., Bekaert, G., and Wei, M., (2007).Do Macro Variables, Asset Markets, or Surveys Forecast Inflation Better? Journal of Monetary Economics, Vol.: 54 (4), pp. 1163–1212.
Ang, A., Piazzesi, M., and Wei, M., (2005). What does The Yield Curve Tell Us about
GDP Growth? Journal of Econometrics, Vol.: 131 (1–2), pp. 359–403.
Beaver, W.H., (1998). Financial Reporting: An Accounting Revolution, Third Edition. New Jersey: Prentice-Hall.
Becker, Gary S., Tomas J. Philipson, and Marco Mira d’Ercole (2005). The Quantity and Quality of Life and The Evolution of World Inequality. American Economics Review, Vol.: 122 (1), pp. 73-117.
Bradshaw, M.T., Drake, M.S., Myers, J.N., and Myers, L.A., (2012). A Reexamination of Analysts' Superiority Overtime-Series Forecasts of Annual Earnings. Review of Accounting Studies, Vol.: 17 (4), pp. 1–25.
Bureau of Economic Analysis, (2002).Corporate Profits: Methodology Paper. United States Department of Commerce, Economics and Statistics Administration, Bureau of Economic Analysis.
Bureau of Economic Analysis, (2004). Corporate Profits in The GDP Accounts. BEA paper series, No. 0040.United States Department of Commerce, Economics and Statistics Administration, Bureau of Economic Analysis.
Bureau of Economic Analysis, (2007). Measuring the Economy: A Primer of GDP and
the National Income and Product Accounts.United States Department of
Commerce, Economics and Statistics Administration, Bureau of Economic Analysis.
27
Fleurbey, Marc and Guillaume Gaulier (2009). International Comparisons of Living Standards by Equivalent Incomes. Scandinavian Journal of Economics, Vol.: 111 (3), pp. 597-624.
Gonedes, N.J.,(1973a). Properties of Accounting Numbers: Models and Tests. Journal of Accounting Research, Vol.: 11 (2), pp. 212–237.
Gonedes, N.J., (1973b). Evidence on theInformation Content of Accounting Numbers: Accounting Based and Market Based Estimates of Systematic Risk. Journal of
Konchitchki, Y., (2011). Inflation and Nominal Financial Reporting: Implications for
Performance and Stock Prices. Accounting Review, Vol.: 86 (3), pp. 1045–1085.
Konchitchki, Yaniv, and Panos N. Patatoukas, (2014). Accounting Earnings and Gross
Domestic Product, Journal of Accounting and Economics, Vol.: 76 (1), pp. 76-88.
Kothari, S.P., (2001).Capital Markets Research in Accounting. Journal of Accounting and Economics, Vol.: 31 (1–3), pp. 105–231. Systematic Positive Forecast Errors on the Information Content of Unexpected Earnings.http://ssrn.com/abstract =181929.
Patatoukas, P.N., (2013). Detecting News in Aggregate Accounting Earnings:
Implications for Stock Market Valuation. Review of Accounting Studies,
28 Romer, C.D., andRomer, D.H., (2000). Federal Reserve Information and The Behavior
of Interest Rates. American Economic Review, Vol.: 90 (3), pp. 429–457.
Shevlin, T., (1990). Estimating Corporate Marginal Tax Rates with Asymmetric Tax
Treatment of Gains and Losses. Journal of American Taxation Association, Vol.: 14
(1), pp. 58–79.
Sims, C.A., (2002). The Role of Models and Probabilities in the Monetary Policy
Process. Brookings Papers on Economic Activity, Economic Studies Program, Vol.:
33 (2), pp. 1–62.
Skinner, D.J., and R.G. Sloan, (2002). Earnings Surprises, Growth Expectation and Stock Returns: Don’t Let an Earnings Torpedo Sink Your Portfolio, Review of Accounting Studies, Vol.: 7 (June), pp. 249-282.
Taylor, J.B., (1993). Discretion versus Policy Rules in Practice. Carnegie-Rochester Conference Series on Public Policy, Vol.: 39 (1), pp. 195–214.
White, H., (1980). A Heteroskedasticity-Consistent Covariance Matrix Estimator and A Direct Test for Heteroskedasticity. Econometrica, Vol.: 48 (4), pp. 817–838.
Zarnowitz, V., and Braun P., (1993). Twenty-Two Years of The NBER-ASA Quarterly
Economic Outlook Surveys: Aspects and Comparisons of Forecasting Performance.