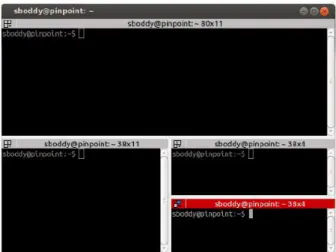
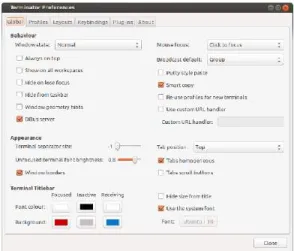
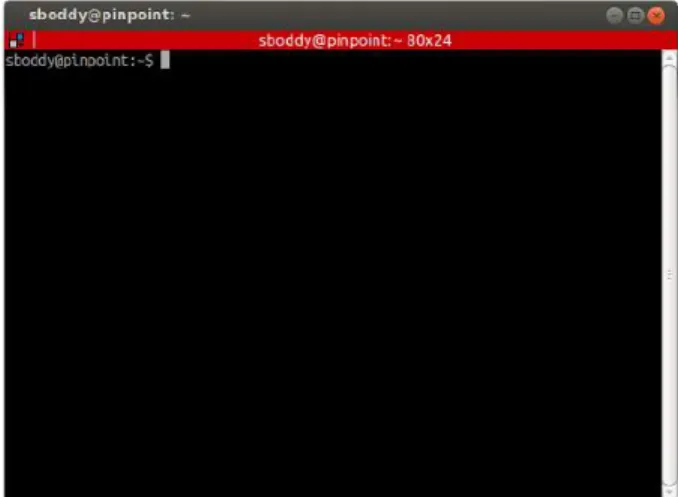
At the end of the label in the title bar, the size of the terminal is given in characters, i.e. By default, the system-defined proportional font will be used for the text in the title bar. By default, the system-defined proportional font will be used for the text in the terminal.
The code in the box shows how to replace all occurrences of stringCWD with stringDIR. This starts the search in the current folder - -name: This helps to search the file name. If we could find, for example, all the files modified in the last hour, we could use them.
The 4 Panes
The console panel is where the action takes place (located at the bottom left in the example above). The script or source panel (top left in the example above) is where you can type and save your assignments and make notes for yourself about projects. When you run a command from the source panel, the command is sent to the console panel to be executed.
The environment and history panel (located at the top right in the example above) is where you will see the different objects you create or the different datasets you import.
Calculator in RStudio
From this screenshot, you can see that this session was running R version 3.1.1 called "Sock it to Me", which was released on July 10, 2014. It is possible to have multiple sources or scripts appear in the source pane, and they will each have their own tab at the top of the pane. You will become more familiar with all of these panes as you move through the lab.
Text & Error Messages in RStudio
True/ False Questions in RStudio
These examples may seem like simple true/false questions, since we know the answers just by comparing the two values. However, imagine that 17 was a variable containing the number of arrests of one individual and 16 was another variable containing the number of arrests of a second individual.
Creating and Modifying Objects in Rstudio
Now whenever you want to see your grocery list, just type the name of the object directly into the console panel. The command below simply prints the alphabetized list to the console panel without changing the order of the list. If you want to inspect a specific list item, then enter the number of the item you want in square brackets.
Remember that you can always inspect your changes by typing the name of the object directly in the console panel.
Numerical Vectors in Rstudio
The Conceptual of This Study
This study will discuss the methods that can be applied in statistical analysis related to cancer cases. Data science in the medical term encompasses many areas, including Next Generation Sequencing (NGS) of the individual's genome, mRNA expression of normal and diseased tissues, clinical trials, drug efficacy, and medical data, such as as well as in characters. The main goals of using data in cancer research are to transform the current approaches to diagnosis and treatments that are usually done in the wet lab to a new dimension using data analytics by doing both identification and data validation.
The dry analysis using data science enables to save time and budget of the research as data is ever available in many areas and can help people to work effectively [2]. However, to apply big data technique and develop a sustainable health care system, researchers need to invest some amounts of money and time [12]. Among numerous areas, cancer research area has a large amount of data science and has covered various statistical analyzes [13-16].
Variables that affect or are affected by the disease can also be monitored to monitor the growth of the cells or the number of cases. For more advance research, the number of future cases or the amount of cells in a given time can be predicted using time series or spatial analysis. The high level of data science and statistical analysis involves collecting, modeling and analyzing data to aid in decision making.
Kernel Density and Survival Analysis A non-parametric method to identify the probability distribution of survival analysis and estimate error density Chi Square for Independence to examine the relationship between. Correlation to find and calculate the relationship and proximity between quantitative variables Significance test (hypothesis test) to measure the strength of parameters,.
Kernel Density and Survival Analysis
Chi Square Test of Independence
As one of the non-parametric tests, the chi-square test of independence is noted as a distribution-free test that does not require any assumptions to perform [20]. In general, a nonparametric test is used for data that have a nominal or ordinal level of measurement, the sample size is not necessarily equal, and a parametric assumption is violated such as the distribution of the data is skewed or kurtotic, it suffers from heteroskedasticity, or the data are no longer in ratio or interval measurement. Each subject can contribute data to one and only one cell in the chi square.
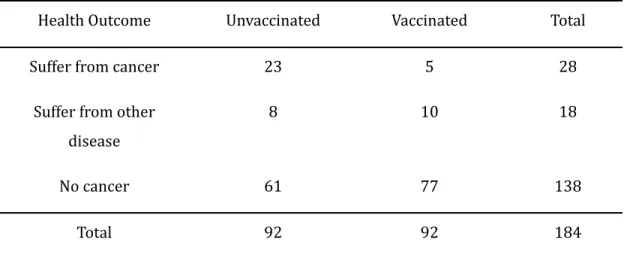
The study group must be independent and the variables must be at the nominal or ordinal level with a multinomial probability distribution. To perform this test, we need to establish the hypothesis whether there is a relationship between the variables or not [18, 20]. The table above shows the frequency of patients observed to determine the association between vaccination and health outcome.
With the data in its observed form, the researchers can continue with the values in the cells to calculate the values. Further examples and explanations of this value can be found in Table 3 of (McHugh, 2013)[20]. Once the χ2 values of the cells have been calculated, they are added to obtain the χ2 statistic for the table.
The null hypothesis is rejected if the statistic is greater than the table or if the p-value is less than the significance level. Based on the values in the cells of Table 2, the total value is 12.35, which is less than.
Correlation
To conclude the decision, the statistics obtained by the calculation should be compared with the table with degrees of freedom (number of rows-1)*(number of columns -1). Two correlation coefficients commonly used in usability research are listed as Pearson's correlation and Spearman's rank correlation [28]. Correlation values range from -1 to +1 and both values represent a very strong relationship between two variables.
However, when it is known that a causal relationship exists between independent and dependent variables, the correlation can be analyzed using a linear correlation coefficient or coefficient of determination [29]. This value provides information about the accuracy and variation of dependent variables compared to independent variables. Correlation analysis in cancer cases has been applied by Lin and Huang [30] to find the association between molecular subtypes that have a similar phenotype with their transcriptional profile.
The data analyzed in the study conducted by Lin and Huang is gene expression. Other research using correlation analysis in the case of cancer was conducted by Ling in all to find the relationship between Gene Expression and Cancer Diagnosis [31].
Significance Test (Hypothesis Test)
Meanwhile, the 0 (zero) value or any number close to zero obtained from calculation indicates the no association between variables [27]. It can analyze whether the difference in the observation is small enough to occur by chance if there is no difference in population. To perform the significance test or hypothesis test, a researcher must assume that there is no difference between two treatments [32].
The hypothesis that there is no difference is called the null hypothesis, while the alternative hypothesis states that there is a difference between the treatments. In two-tailed test, the null hypothesis states that the parameters are equal to a given value. Meanwhile, in one-tailed test, the null hypothesis will suggest that the parameter is smaller or larger than the specific value provided in the test [34].
Concluding that the data is consistent with the null hypothesis or not: rejecting or failing the null hypothesis [32, 34]. Meanwhile, the t-test should be performed when the standard deviation is unknown or the number of data is small [35]. The null hypothesis is rejected if there is a one-sided test or a two-sided test.
Similar to the t-test, where the null hypothesis is rejected if for one-tailed test and for two-tailed test, where df is degree of freedom, which is obtained from [32-35]. The hypothesis test can be performed in the case of cancer, for example, to check the effectiveness or efficiency of drugs or treatments to cure a certain disease.
Regression
In statistical hypothesis testing, a researcher must consider two types of error in order to make a good decision for their research. Assumption checking can be done by using residual plot (scatter plot of the error) of residual versus fitted model. The residuals are independent and have constant variance if the dots in the scatterplot are spread randomly along the axis.
Furthermore, the assumption of normality is met if the points follow the linear line in the QQ plot [ 36 , 37 ]. Multicollinearity is the condition where there is a strong correlation between independent variables, thus causing duplication of similar information in the estimation. Research conducted using regression analysis in the field of cancer can be found in research by Shafi et al[37].
Data Science and Cancer: An Approach to the Challenges Involved International Journal of Computer Science & Engineering Technology (IJCSET. The latest global cancer data: The burden of cancer increased to 18.1 million new cases and 9.6 million cancer deaths in 2018 .14] Swift SL, Stojdl DF (2016) Big Data Offers New Insights for Oncolytic Viral Immunotherapy 2015) Databases and Online Tools for the Study of Cancer Genomics.
Statistical data analysis of cancer cases in insurgency-affected states in Nigeria.ElsevierData February 18 p. Chi-square test of independence. 2011), Comparison of Pearson and Spearman correlation coefficient values in the same datasets, Questions Geographicae, 30(2), p. 2017), Principles of correlation analysis, Journal of the Medical Association of India, 65 (March), p.