* Paper written in Arabic. Translated into English by an anonymous translator. The editors have reviewed it for correction of any gross mistakes and slightly edited for
Monzer Kahf **
Introduction
Islamic banks, in terms of their legal modalities, structures, objectives and means of achieving those objectives, are not any different from other financial institutions. Their main difference lies in their being described as Islamic. This entails that the Islamic banks have enjoined on themselves to conduct their affairs within the limit of the rulings of Shari[ah and to comply with its overall objectives. This definition of Islamic banks would make our approach easy as we make an attempt to explore the success factors of Islamic banks as financial institutions. It must be realized that maximization of profit is an objective of the highest priority for all private investment institutions. Consequently, all private-sector financing institutions have a fundamental objective: to make as much profit as they can.
However, profit maximization is a general proposition that must be narrowed down and explicated in detail. This has been undertaken in the Section 2 of the present paper. In brief, there are different factors which are important in affecting profit maximization of Islamic banks such as boosting of all forms of deposits, improvement in the quality of customer services, expansion in the base of banking services, protection of capital, provision of humanitarian and social services, etc. and the factors that raise the profit margin, or which may be called the rules of profitability management of an Islamic bank.
The Section 3 will discuss the experience of some selected Islamic banks in achieving their objectives and measure the extent of their success.1 This
6
Success Factors of Islamic Banks:
An Empirical Study
∗has been done through an analysis of their closing accounts and annual reports for the years 1999 to 2001.2 This section also makes an attempt to present important evidence that would help us deducing the main factors in the success or failures of these Islamic banks. Specifically, this has been done through assessing assets growth, growth of invested assets, the growth of cash and deposits in other banks, the growth of customers’ deposits in Islamic banks, changes in earnings, expenses, and net profits, and the commitment to the Shari[ah and charitable and social contributions.
Section 4 will focus on the success factors of Islamic banks which could be derived from the above analysis. This section is divided into a number of subsections devoted for the study of bank’s efficiency, factors that Increase customers’ trust in the bank, efficiency of departments of investment management, financial engineering and marketing management, protecting shareholders’ and depositors’ capital, the extension of humanitarian and social services and some other factors.
2. Success Criteria of Islamic Banks
2.1 Long Term Considerations 2.1.1 Increasing Deposits
In order to realize the greatest possible profit, there is a need to distinguish between the long-term and the short-term objectives. A bank, whether Islamic or conventional, is concerned with making profit in the long- term without sacrificing its short-term perspectives. Long-term profit is influenced by the growth of deposits and other such resource that give the bank the opportunities to generate earning assets. Thus, it is necessary to consider the rate of growth of the various forms of deposits.
An Islamic bank normally has three types of deposits that determine its capacity to raise the rates of shareholders’ return. These are: current account deposits, unrestricted investment deposits in savings and mudarabah accounts, and lastly, off-balance sheet deposits in investment funds in special or restricted investment accounts. It is erroneous to think of these deposits as being independent of each other. Numerous researches have proven the existence of usually positive links between them. This has also been confirmed by the reports of the Islamic banks that are considered in this study. Therefore, the banks, in marketing and offering any type of deposit to the clients should also consider its cross effects on other types of deposits offered by it.
Although Islamic banks do not distribute returns to current account holders, this increases not only the rate of profit, but also multiplier of assets/equity rate which is reflected in the form of even a greater increase in the rate of profit. On the other hand, off-balance sheet deposits are considered an attractive way of increasing the number of clients as well as a very important vehicle to increase the rate of shareholders’ returns, because it increases the earnings from the agency activities. Moreover, these earnings are less affected by investment risks to which other banking earnings are subjected.
2.1.2 Improving the Quality of Services to Clients
Some Islamic banks may pay little attention to the quality of services they offer to their clients especially if such banks enjoy a position where they can exercise some monopolistic power in the market. Many Islamic banks were once in this situation when they were acting alone in their Islamic financial services’ markets. Today, however, the monopolistic position is weakening because of the multiplicity of Islamic banks in many countries and the entry of conventional banks into the Islamic finance markets.
The experience of American banks in the 70s and 80s, when there was fierce competition among them, has taught an important lesson. That is, improved services to customers save cost in the long-term despite the short term cost of higher spending on training and rehabilitation.3 The improved services create a climate which is conducive both for the clients and employees. It increases clients’ enthusiasm for dealing with the bank on one hand and raises the productivity of the employees on the other. This improves the cost effectiveness of each dollar spent on labour.
It may be noted that improving the quality of banking services does not only mean receiving and responding to clients’ requests. It also means the ability of the bank to discover a client and to offer him/her a service previously not used. This is a kind of commercial marketing of financial services in full sense of the word as it is familiar in goods and services marketing.
The efforts expended by the bank in improving the quality of clients services depend on the clarity of its vision about the market segment to which it is directing its services. Are the clients big financiers, businessmen or monthly salary earners, middle-level traders and industrialists? Every segment of clients has its own peculiarities. Experience has proven that banks that are able to offer specialized services commensurable with the peculiarities and objectives of every segment can attract the largest amount of deposits.4
While it is neither morally wrong nor against the principle of profit maximization that a bank should offer its big clients special services that correspond to the level of profit it makes from dealing with them and their financial transactions, experiences have shown that banks that are able to improve the services they offer to medium depositors and small traders can still make huge profits through economies of scale. Clearly a bank can offer improved services to all clients in addition to the higher segment of clients by offering all of them an enjoyable banking practice. This can be achieved through the following means:
Personalizing the banking services: by that we mean making banking services individually tailored to every client such that he feels a personal link with the bank he deals with.
Raising the professional level of employees who deal directly with clients such that they can offer professional services quickly and efficiently and gain the client’s confidence.
Strong concern in the investment department to realize for investors - depositors or shareholder- a rate of profit higher than other banks that operate in the same market serviced by the bank, especially other competing Islamic banks.
Improving the working environment and making it comfortable and enthusiastic for the bank employees.
Providing social services that are noticeable by the segment of the society from which the bank derives its clientele and staff. The word “noticeable”
should be underlined because the objective behind services to the social environment is to raise profit and as such the choice of the type of social services has an impact on its returns. For instance, it may be better for a bank to award a scholarships of Dinars 1,000 each to 10 school graduates in a public ceremony that will be talked about by people than quietly awarding a single scholarship of Dinars 10,000 to the best student.
Finally, raising the quality of banking services may depend on improvement of three elements: professionalism, knowledge of clients and establishing personal rapports with them. Correct banking professionalism is the first point of departure for creating confidence in the bank and its employees. Improving professionalism, therefore, centres around improving the bank employees’ knowledge and perfection of their jobs, It also focuses on the staff's ability to carry out a client’s needs quickly, efficiently and accurately, which would generate a great deal of confidence in the mind of clients regarding the bank and its employees., The knowledge of clients is
based on keeping and maintaining a continuous relation with them which is, to some experts, the most important managerial rule5: Success in banking services means the ability to interact with and relate to the client’s desires, anticipate their wishes, and to offer such services that are specific to these desires and wishes.6
There may be several parameters by which the quality of banking services offered to a customer could be measured. These might include monitoring of customers’ satisfaction, which may be done through administration and analysis of periodic questionnaires. Another way is to conduct a time and motion study i.e. computing the time taken to perform services and linking it with the record time. Another parameter may compute the number of new customers whom marketing staff can draw to the bank. The extent of success of the management of direct services to customers as a whole can also be measured by the change in the volume of market transactions the customers conclude with the bank.
2.1.3 Expanding the Base of the Banking Services
Numerous studies conducted by research bodies in the USA have shown that 80-90 per cent of bank customers’ material assets are kept outside the banks that customers deal with. This ratio increases every time bank activities are restricted to current accounts, granting loans and issuing credit cards.7 This means that ample opportunities exist for banks to attract new deposits and investments even without expanding customer base. It is only in the last few years that some Islamic banks have turned their attention towards expanding the base of their services by extending services of agency for investment such as creating investment funds and offering special investment accounts.
However, what cannot be marginalized in contemporary banking is that the ability of the bank to increase its deposits and other investment funds, which largely depends on the strength and activity of its financial engineering department. This is what guarantees continued expansion of its deposits and as such it has the capacity to constantly increase its investments assets.8 This principle is even more valid for the Islamic banks than other commercial banks because the nature of these banks is based on new innovations in the art of banking that are far from being the prominent pillars of conventional banking operation: lending and borrowing. Inventing a flow of investment products offers customers attractive alternatives that induce them to move their material assets from other banks or from outside the banking sphere to the Islamic bank, while, at the same time, attracting new customers with new deposits. This continuous innovation process is both the foundation and the
assurance of growth of Islamic banking. In this regard, financial engineering management becomes the strong engine that moves banking marketing.
Without the engineering activity, marketing management cannot attract new deposits on a continuous basis as to guarantee continuous growth for the Islamic bank’s activities and profits.
A measurement of expanding base of banking services is possible by meaning the growth of non-conventional investments, especially off-balance sheet investments through the agency contract with fixed or declining commissions. It can also be done by measuring the growth of new innovations through reckoning the volume of operations in the invented products.
2.1.4 Preservation of Capital
Protection of capital is one of the important considerations in maximizing profit in the long run because evaporation of capital not only causes banks to loose new deposits, it also deprives them of the means to achieve the very objectives of their existence.
Undoubtedly, two most important elements in capital preservation are the extent of the bank’s diversification of its investments and the extent of synchronization between the maturity of its investments and the maturity of its deposits. One of the common errors in the circles of Islamic banking theorists is their continuous call for financing through partnership (musharakah) and non-voting equity (mudarabah) that are both of a long-term nature, while the greater part of the banks deposits are short-term deposits in current accounts and short-term investment accounts. Although there are attempts to reduce financing through murabahah in favor of an increased financing through mudarabah and musharakah, these attempts should take into account that musharakah and mudarabah financing should not exceed the safe limit in terms of proportionality with the sources of financing and their maturities.
In addition, protection of deposits requires setting of clear red lines that should not be crossed with regard to the degrees of risks the Islamic bank cannot bear, whether they are investment risks or foreign currency risks.
Even though it is clear that Islamic banks are moving towards taking generally conservative positions towards investment risks, some of them have landed investors and depositors into pure failure because of the absence of these red lines and the weakness of check and balance processes in their management style.
One of the most important criteria in capital preservation is the structure and power of the bank’s risk management department and its professional conduct. This should not be limited to central bank guidelines and to what is usually known, in a conventional banking, as the rules of banking prudence,9 but should also include tying mudarabah and musharakah investments to long- term investment deposits, setting up red lines of potential risks and rules for checks and balances in taking investment decisions. Such rules of prudence must be applicable to all decision makers in the bank including the CEO.
2.1.5 Humanitarian and Social Services
There is no doubt that providing humanitarian and social services to the local community increases the bond between the bank and its local environment. This has a positive effect on the volume of deposits and other banking transactions. We should however note that banks are like other institutions in any society. They are made up of a group of individuals dealing with people in a particular social environment. There is no way that this group will not be influenced by its social environment or affected by the ideas, concepts and events that emerge in that environment. This is why banks participate in many charitable works and set programs of participation in charitable and social work, regardless of, and indeed above the demands of the principle of profit maximization. Banks contribute to public charitable works and set aside funds in their annual budgets for such purposes.
Islamic banks are also looked at to participate in the charitable activities in their societies. In fact, that is more expected from them than from conventional banks because they are governed by the Islamic Shari[ah which requires the wealthy to contribute to social and humanitarian works. Surely it is possible -and may even be better- that the distribution of zakah is left to the individuals -investors or shareholders- to spend it on causes they consider closer to Allah. But it is erroneous to think that good deeds are limited only to the enjoined zakah. One of the distinguishing factors of the Islamic bank is its commitment to Qur’anic morals and values all of which are based on goodness, righteousness and benevolence. Islamic banks must portray these values in the same way as required of individuals.
We must note that the social charitable objective is distributive not productive by its very nature. In other words, Islamic banks deal with their customers on the basis of fairness, justice and kindness then spend money on the path of righteousness and charity. Thus spending on charitable social objectives is a form of redistributing net resources, even though the bank, purely for tax purposes, categorizes such expenses as part of its public expenses.
In fulfilment of its Islamic character, the Islamic bank should always set aside for righteous causes some money since it carries the banner and ideals of the Islamic values. Prophet (Pbuh) has promised replacement for every spending and that money is not going to diminish as a result of spending. The compensation or reward may be in the form of customers’ confidence in the bank and their conviction about its Islamic characteristics. Consequently, their interest in dealing with the Islamic bank is going to grow.
2.2 Short-Term Considerations
Profits, higher than the competing Islamic and conventional banks, is in the final analysis, are the ultimate objective and the quantitative criterion for measuring the success of any bank. Besides the role that every human being or every group of people plays in participating in righteous deeds in the society, of which the Islamic bank is expected to do more because of its identity and character, any talk about non-profit objectives is either a rhetoric about interim objectives that are mere means to the primary objective or it is a form of marketing or public relations propaganda that serves the objective of profit maximization.
We shall devote the remaining part of this Section to recall the rules of managing the profitability of Islamic banks. These rules can be summarized under the following six points: pricing of banking services, cost/earning efficiency of bank’s operation, selecting high return investments, reducing idle assets as much as possible, benefiting from economies of scale, compliance with institutional process for the flow of information to management to make timely decisions.
2.2.1 Pricing of Banking Services
It is usual for new banks to seek to use the pricing list of existing banks.
But a bank that is keen on offering quality services must set its own price list on the basis of analytical studies of its own architectural cost, compare it with other banks, set its own fees to be commensurate with the value of banking service provided and the affordability of the proposed price to the average client (statistically it is preferable to take the mode because it is the most frequent), and then work to increase the price of banking services to the highest level possible, without sacrificing the bank’s competitiveness. Pricing of banks’ services includes setting the rage of charges on non-investment services and determining the share of mudarib/agent of the returns on unrestricted, restricted and special investment deposits.
2.2.2 Cost/Earning Efficiency
This is measured by the ratio of total expenses to total earning. As the ratio decreases, so does the efficiency of every Dinar spent by the bank. The Islamic bank can increase its profitability by increasing the efficiency of its workforce, through constant training and injecting joy and happiness in the work environment.
2.2.3 Selecting High Returns Investments
Investment selection is linked to risk management because, as it is known, an increase in the expected return is normally linked to an increase in investment risk. But it is to a large extent also linked to the bank size itself.
The financial sector is like a jungle where the fatter the prey the larger the predator animal that is needed to devour it. The bank that enters the market with huge capital is able to find higher return investments, in addition to it being able to instill greater confidence in investors, thus making them to come forward to it with their investments. It is not enough for the Islamic bank to start with high investment; rather it should back such an investment with a strategy for continuous growth, either through geographical coverage or through the size of deposits and assets or through mergers or purchase of other financial institutions.
2.2.4 Minimizing Idle Assets As Much As Possible
Every bank needs cash reserves. Some of these needs are compulsory while others are required by the rules of banking prudence. But Islamic banks are known of having higher cash reserves for reasons, part of which are technical caused sometimes by the bank’s relations with the central bank, others for purely administrative reasons. The Islamic bank can minimize idle reserves by reconsidering its managerial philosophy, improving its style of applying the rules of banking prudence and seizing the little opportunities available to use its cash assets to increase income.
2.2.5 Utilization of Economies of Scale
This comes about by means of increasing invested assets, because an increase in investment propels the multiplier of the ratio of profit-bearing assets to equities towards profit maximization.
2.2.6 Compliance with an Institutional Approach of Information Flow to Management to Enable it to Take Timely Decisions Timely decision making and shorter implementation gap are quite important elements in making profit as well as in safeguarding of capital. The time span between a need for a decision and when it is taken cannot be reduced unless information reaches the management in an institutional and regular manner. Banks in the Arab world particularly often aim at getting information to the management for seeking decisions. This approach ties the customer’s time directly with the chain of getting to the management, such that her transaction has to be signed by the bank’s senior management.
Servicei can be improved by adopting a method of delegating middle-rank management to conclude provision of services to the customer, and then link up with the senior management to ensure that the information reaches there at the appropriate time. There is no doubt that the centralized style of management increases the cost and engages the top management in trivialities that take up the time that is better devoted to planning and drawing up growth programs.
3. Experience of Some Islamic Banks in Meeting their Objectives This section shall make an attempt to study the experiences of some Islamic Banks in meeting their objectives as well as to measure the extent of their success through a study of their final accounts for the period from 1999 – 2001. Since this period is rather short, hence, it shall not be possible to identify any long term trends.
I must make certain reservations beforehand about the results. It is necessary to do so because this attempt neither covers the totality of Islamic banks nor a random sampling of the Islamic banks has been done in this study. It is merely confined to an analysis of some available financial information and annual reports. The information at hand cannot explain all the causes of differences between banks. Such explanation of the differences requires an identification of the various factors, such as management methods, bank’s relations with customers, employees, as well as the employment policies. For example, the employee salary levels and other benefits, the quality of employees’ technical qualifications, the levels of their knowledge of banking, particularly of Islamic banking. Also important are the different kinds of services offered to customers, methods of their delivery as well as categories of financial products and their development over time etc.
which must also be considered in an in-depth analysis. However, any
information on these variables is generally not available in the published annual reports.
Despite these shortcomings, this section still provides important evidence that will help in identifying the factors that are responsible for the success or the failure of Islamic banks, whether in the countries where the 7 banks are located in Arab and Islamic countries or elsewhere.
3.1 Growth of Assets and Invested Assets
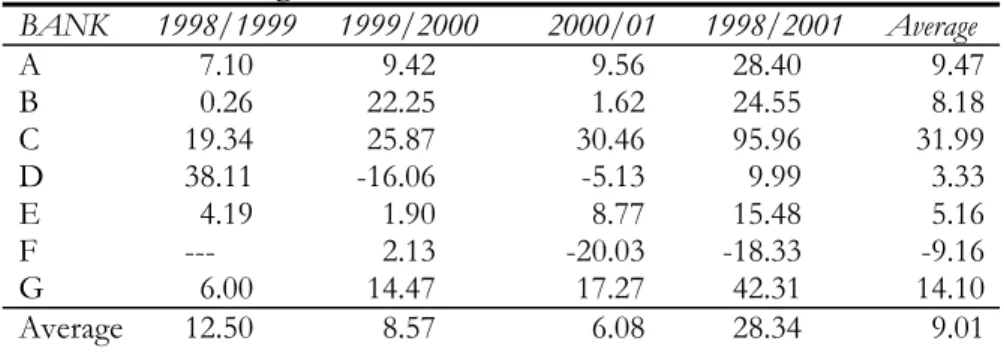
Islamic banks vary greatly in their ability to increase their overall assets in general and their invested assets in particular. Tables 1 and 2, show the growth of assets and invested assets respectively in case of some Islamic banks.
It may be observed at Table 1 that, while one of the banks (bank C) was able to increase its assets by 96 per cent over three years followed by bank G with a growth of 42 per cent, a decline may be noticed in the assets of another bank (bank F) by 18 per cent.
Surely this increase in assets is strongly indicative of the bank’s ability to grow and succeed. More importantly, it indicates the bank’s ability to generate earnings because growth in asset does not merely increases in the amount of money the bank can invest, but increases the bank’s ability to invest in projects with higher returns. In other words, the bank is able to improve the quality of its investment. The two points are reflected in an increased profitability of the Islamic bank.
Table 1: Percentage Growth of Total Assets in Some Islamic Banks BANK 1998/1999 1999/2000 2000/01 1998/2001 Average
A 7.10 9.42 9.56 28.40 9.47
B 0.26 22.25 1.62 24.55 8.18
C 19.34 25.87 30.46 95.96 31.99
D 38.11 -16.06 -5.13 9.99 3.33
E 4.19 1.90 8.77 15.48 5.16
F --- 2.13 -20.03 -18.33 -9.16
G 6.00 14.47 17.27 42.31 14.10
Average 12.50 8.57 6.08 28.34 9.01
When the growth of assets in Table 1 is examined, it is found that the general increase in assets alone does not give the complete picture. We should attempt to understand the phenomena and factors behind this increase. Here we would find two Islamic banks C and G that were able to maintain steady
annual growth at high levels. In other words, these two banks were able to maintain a high and stable annual growth average in assets.
Figure 1
This gives some important indication about the quality of management and method of dealing with customers. It could say something about its ability to keep the bank’s customers and to increase them by attracting new ones. In contrast, it may be observed that banks D and E whose assets rose by 10 per cent and 15 per cent respectively over a three year period 1998- 2001, recorded their increases mainly during 1999 (bank D) and 2001 (bank E). In other years, the growth was either modest or negative. For bank B whose assets grew by 25 per cent, its boom occurred in 2000 and it was an increase in assets caused by an increase in the paid up capital of that bank.
But in the two other years, the bank was only able to register an almost negligible increase. On the other hand, bank A was able to maintain a stable growth rate each year, which was higher than the average taken over all banks each year. Its assets rose by 28 per cent in the three years (see Table 1).
Comparison of Changes in Assets and in Invested Assets 1998-2001
-10-8 -6-4 -20 24 68 1012 1416 1820 2224 2628 3032 3436
A B
C D
E F
G
Change in Assets Change in Invested Assets
It is also important to search for the causes of asset increase. While we find that the cause of increase in the assets of banks C and G is customers’
deposits, the increase in the assets of bank B is an increase in capital. Hence, the banks C and G were really able to relate to customers in ways fundamentally different from other banks, such that they were able to gain the confidence of many of their customers. It is noticeable; however, that bank G is the sole provider of Islamic services in its market while bank C faces strong competition in its domestic market. Also both banks are old in the market; one of them is the oldest Islamic commercial bank and the other is one of the first few banks.
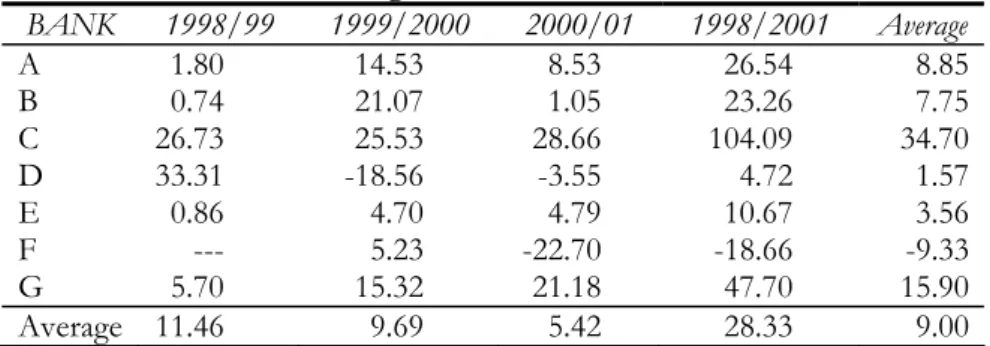
However, the increase in total assets is also a partial indicator of the ability of Islamic bank to achieve high profitability. That is why it is necessary to look at Table 2 to complete that picture. This table shows the growth of invested assets.
Table 2: Percentage of Increase in Invested Assets
BANK 1998/99 1999/2000 2000/01 1998/2001 Average
A 1.80 14.53 8.53 26.54 8.85
B 0.74 21.07 1.05 23.26 7.75
C 26.73 25.53 28.66 104.09 34.70
D 33.31 -18.56 -3.55 4.72 1.57
E 0.86 4.70 4.79 10.67 3.56
F --- 5.23 -22.70 -18.66 -9.33
G 5.70 15.32 21.18 47.70 15.90
Average 11.46 9.69 5.42 28.33 9.00
An initial look at Table 2 does not give a right picture of the achievements of many of the Islamic banks. With the exception of just two, no bank was able to maintain the same rates of increase in assets when it comes to their investments. In other words, five of these Islamic banks were unable to absorb in their investments the rate of increase in their assets, making the growth rate of their invested assets lower than the growth rate in total assets as illustrated in Figure 1 above.
Bank C, which recorded the greatest increase in total assets, was able to raise its investment index, since it was able to make more increase in its investments than that of the total assets by more than 9 points. Next is Bank G, which was able to raise its investment index during the period under study. Its invested assets grew more than its total assets by more than 5 per cent. To explain the causes of this achievement for bank G, its method of administration needs to be studied. So too should be the qualification of the
managerial levels, especially the middle-level and the way the bank and its employees treat their clients. It is apparent that this bank is able to attract and hold on to its clients, and it knows how to sell itself to potential customers.
This is one of the key factors of success. We should however not disregard the monopolistic position enjoyed by the bank in the local market of Islamic services and the fact that it’s been well entrenched, as an older Islamic bank, in the international market.
Here, we should note that the least lucky of the five remaining banks in keeping its investments in accord with its assets is bank D, which experienced persistent drop in both its total assets and invested assets in the last two years. Perhaps part of the reason is that the bank was unable to achieve a high rate of investment in 1999, which made investors turn away from it in the next two years. If the gross margin between its assets and investments was big in 1999, it was equally big in 2001. Next is bank E whose investment index dropped by 5 points. As for the 3 other Islamic banks, they share with these two banks a disparity between the growth in assets as a whole and the growth in invested assets, but to a lesser extent. This has serious significance on the level of training and technical qualification in the investment managements and the ability of the management to reach out to businessmen and to attract them to use the bank’s services. This phenomenon also casts a shadow on the management method of taking investment decisions and on the accuracy and speed of information fed to the management so as to enable it to make decisions with the appropriate speed and efficiency.
Tables 1 and 2 did not touch on the index of invested assets to total assets. This ratio is undoubtedly influenced by the central bank’s monetary policy, the bank’s investment approach, its patterns of waiting for opportunities and its adopted limits of banking soundness. The Jordanian central bank for example is known to tend towards extreme conservatism in this regard. Nevertheless Table 3 has important significance: it does not only outline the ratio of investment to total assets, but it also points to the bank’s efforts in using its available assets and the changes of these efforts from time to time.
Table 3: Percentage of Invested Assets/Total Assets
BANK 1998 1999 2000 2001 Average 98/99 99/00 00/01 98/01 A 68.41 65.02 68.06 67.42 67.22 -4.95 4.67 -0.94 -1.45 B 94.81 95.27 94.35 93.82 94.56 0.49 -0.96 -0.56 -1.04 C 84.88 89.88 89.64 88.40 88.20 5.89 -0.27 -1.38 4.15 D 97.09 93.72 90.92 92.43 93.54 -3.47 -2.98 1.66 -4.79 E 88.64 85.81 88.17 84.95 86.89 -3.19 2.75 -3.66 -4.16 F --- 83.51 86.05 83.17 84.24 --- 3.04 -3.35 -0.41 G 89.96 89.70 90.36 93.37 67.51 -0.29 0.74 3.33 3.79 Average 87.30 86.13 86.79 86.22 83.17 -0.92 1.00 -0.70 -0.56
A look at Table 3 reveals that all banks are capable of increasing their investment rates. This is so since for 6 of them, this index in 2001 did not reach the rates they actually attained in the previous years. This reinforces our earlier conclusion that there is a genuine need for these 6 Islamic banks to review their management and investment policies. More important, this index helps understand the success factors because it shows clearly the need and benefit of finding highly qualified investment management as one of the success factors of an Islamic bank. What is required of this management is to continuously work to raise the investment index shown in Table 3.
3.2 Increasing Cash and Bank Assets
Table 4 depicts the growth of cash and deposits with other banks in the 7 Islamic banks during the three years that ended in 2001. It indicates that the efforts of Islamic banks to minimize idleness of their funds have produced uneven results.
While some banks achieved temporary success in some years, only bank G was able to introduce genuine reduction of its available cash during the period covered by the study. But with bank F, despite of the negative value that indicates a drop in its cash assets. This decline was accompanied by a bigger drop in its invested assets, which means that the ratio of cash to total assets has increased instead of dropped. Additionally, three other banks have reached disturbing high figures in the average increase of their cash and deposits with other banks to an extent that one doubts the very existence of departments for liquidity and investment management in these banks!
Table 4: Percentage increase in Cash and Deposits with Banks BANK 1998/99 1999/2000 2000/01 1998/2001 Average
A 18.83 12.55 11.31 48.87 16.29
B -10.61 103.39 -39.17 10.61 3.54
C -26.83 54.60 61.65 82.86 27.62
D 206.98 10.61 -9.59 206.98 68.99
E 31.79 -14.72 54.42 73.56 24.52
F --- -13.31 0.42 -12.94 -6.47
G 1.47 13.35 -39.53 -30.46 -10.15
Average 36.94 23.78 5.64 54.21 17.76
Ongoing awareness of the need to make reduce funds idling has special interest in the Islamic banks because they can’t resort to the money market very short-term investment since it is normally interest-based. As such its liquidity management should take a very different course from what is in
conventional banks. Awareness of the Islamic bank about the importance of liquidity management is a matter that should never be taken lightly. We must understand that the success of liquidity management in the Islamic bank depends on its continuous ability to find profit-bearing uses of any cash injection that reaches the bank. It would be untenable to say that a bank’s capital has increased and a huge cash flow has been injected so much as to cause failure of the liquidity management department to absorb it, as happened with bank B in 2000, when it needed a whole year to absorb just a part of the increase in capital!
Part of what could help investing available cash is for the bank to have short-term investment windows, by opening up to markets and short-term financial transactions that are at the same time Shari[ah compatible. This is what a number of Islamic banks did by resorting to short-term international murabahah transactions. The leasing instruments which the Bahrain Monetary Agency issued and the government musharakah and the banking certificates which are still being issue by the Government of Sudan for the last 4 years are all moving in the direction of facilitating the use of cash in profitable short-term investments rather than keeping it idle.
Table 5 below depicts the index of cash and deposits in banks to total assets. It also shows the annual growth of this index.
Table 5: Percentage of Cash and Deposits in Banks/Total Assets
BANK 1998 1999 2000 2001 Avg. 98/99 99/00 00/01 98/01 A 32.72 35.94 35.42 35.59 34.92 9.82 -1.43 0.47 8.76 B 4.23 3.77 6.28 3.76 4.51 -10.83 66.37 -40.14 -11.20 C 10.81 6.63 8.14 10.09 8.92 -38.69 22.83 23.90 -6.69
D 2.56 5.68 7.49 7.14 5.72 122.27 31.76 -4.70 179.10 E 8.65 10.95 9.16 13.01 10.44 26.50 -16.31 41.97 50.29
F --- 12.39 10.52 13.20 12.04 ---- -15.11 25.57 6.59 G 6.94 6.65 6.58 3.39 5.89 -4.28 -0.98 -48.44 -51.13
Average 10.99 11.71 11.94 12.31 11.78 17.46 12.45 -0.20 25.10
In this table we find that one Islamic bank (bank G) was able to steadily reduce the cash index throughout the whole three years. This is consistent with our earlier observation about the quality of management in this bank and the market environment of its operation. But bank B has reduced the final figure of this index, even if it was unable to achieve a reduction in all the years. Another bank, D, was able to decrease the rapidity of increase in this index despite its inability to change its course. On the other hand the liquidity index in the four other banks witnessed an increase during the three year period.
3.3 Growth of Deposits in Islamic Banks
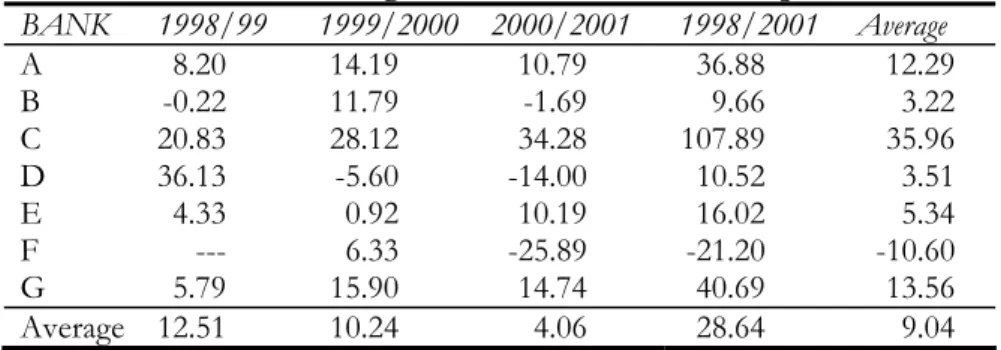
Customers’ deposits are the foundation of a bank’s activity and the source of its profitability. Table 6 outlines the development and growth of customers’ deposits in the 7 banks we are studying. We find that banks that increased their assets by a high proportion are those that were able to substantially raise customers’ deposits, as is the case with banks G and C.
Table 6: Percentage Growth in Customers’ Deposits
BANK 1998/99 1999/2000 2000/2001 1998/2001 Average
A 8.20 14.19 10.79 36.88 12.29
B -0.22 11.79 -1.69 9.66 3.22
C 20.83 28.12 34.28 107.89 35.96
D 36.13 -5.60 -14.00 10.52 3.51
E 4.33 0.92 10.19 16.02 5.34
F --- 6.33 -25.89 -21.20 -10.60
G 5.79 15.90 14.74 40.69 13.56
Average 12.51 10.24 4.06 28.64 9.04
On the other hand, banks that are unable to realize high increases in their deposits are those that remained at the lowest rank of growth in their assets, as is the case with banks B, D, F and E. We should keep in mind, however, that the other source to increase assets is an increase in equities through bringing new funds from shareholders (bank B) or retaining large chunks of realized profit as done by all other banks without exception.
In addition to retaining profits, bank A started with a modest deposit growth average in 1999, but because it offered new financial instruments it was able to attract new deposits in 2000 and 2001. This re-emphasizes, time and again, the utmost importance of the efforts of the departments of financial engineering and marketing in the success of the Islamic bank, as it is these efforts that determine the bank’s ability to attract new customers and to increase its transactions with the old ones.
Yet, Table 6 has some very important significance: the market for Islamic financial services in the countries where these banks operate, particularly in Kuwait, United Arab Emirate and in Bahrain to some extent, still have a tremendous capacity to absorb more Islamic financial services offers. If one bank is able to increase its deposits at a rate of more than 40 per cent or 170 per cent over three years, there must be a sort of market’s thirst for such services and a high capacity to accommodate more Islamic financial services institutions.
Before concluding this sub-section we need to look at the components of these deposits. Clients’ deposits are either demand (current) accounts, unrestricted short-term investment accounts of 3-6 months, medium-term, 1 year and above, or restricted/special investment accounts. The last type of accounts mostly operate on the basis of agency or hired manager, such that the bank gets a price of its services regardless of the result achieved to the deposit owner. Since returns of investment on current deposits are assigned to shareholders, not to depositors (because these accounts are guaranteed), their impact on shareholders’ profit is direct and on a one to one basis. On the other hand, since Islamic banks usually service these accounts free of charge (even though some of them have started to charge monthly service fees), it very important to minimize the cost of these services or at least make it within the limit of their expected return.
Table 7 depicts the growth in current accounts in only 5 banks because one of the banks did not show the volume of its current account deposits in its annual report and the other is an off shore bank, it does not provide current account services.
Table 7: Percentage of Growth in Current Account
BANK 1998/1999 1999/2000 2000/2001 1998/2001 Average
A 2.42 24.29 16.06 47.73 15.91
B 3.88 63.55 -14.29 45.63 15.91
C 11.55 16.56 14.91 49.41 16.47
D --- --- --- --- ---
E -14.57 2.84 2.77 -9.72 -3.42
F --- 36.50 -10.05 22.78 11.39
G --- --- --- --- ---
Average 0.82 28.75 1.88 31.17 11.15 Three banks were able to increase their current account deposits by almost 50 per cent over three years. But this increase was accompanied by an even higher increase in the total deposits of bank C, while the growth rate of current account surpassed the rate of increase in total deposits in banks A and B. This shows the importance of marketing current account services as a means of getting other deposits that would enable the Islamic bank to improve shareholders’ profitability. We have pointed out that to a large extent this depends on improving customer relations. It striking that throughout 2000 and 2001 bank E has maintained a modest growth in its current deposits that are significantly lower than the growth of its total deposits.
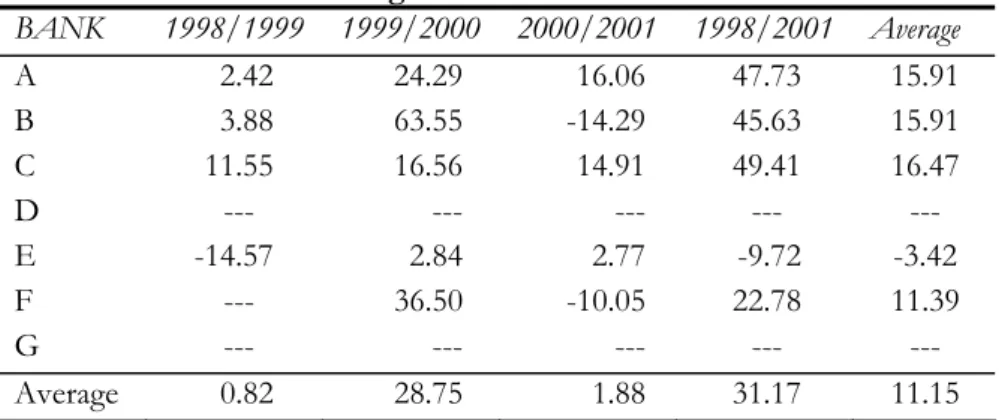
It is important to bring in Table 8, despite its scanty information, because it points out a significant success factor of Islamic banks; that is the role of deposits in special and restricted accounts, as a factor of a substantial influence both positively and negatively. Whenever a bank is able to increase deposits in these accounts, its profitability rises, even with a weaker growth in its unrestricted deposits; and a failure to promote these ff-balance sheet deposits always reflects negatively on all components of total deposits.
Table 8: Percentage Growth of Restricted and Special Investments BANK 1998/99 1999/2000 2000/2001 1998/2001 Average
A 51.91 70.77 16.82 203.06 67.69
B --- --- --- --- ---
C --- --- --- --- ---
D --- --- --- --- ---
E --- --- --- --- ---
F --- 11.05 -37.68 -30.79 -15.40
G --- --- --- --- ---
Average 51.91 40.91 -10.43 86.13 26.15
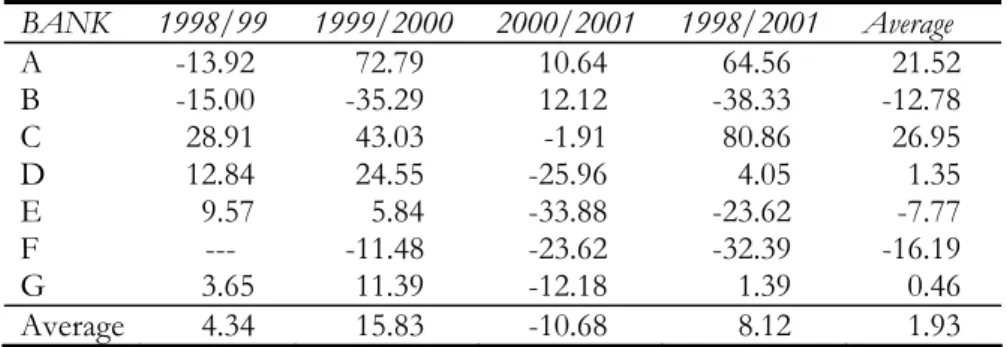
Before concluding this sub-section, we need to take a brief look at the changes in depositors’ share of profit, in terms of absolute changes and deposits’ profitability index in relation to the size of deposits. This is what is illustrated in Tables 9 and 10.
Table 9: Percentage Growth of Depositors’ Profit Share
BANK 1998/99 1999/2000 2000/2001 1998/2001 Average
A -13.92 72.79 10.64 64.56 21.52
B -15.00 -35.29 12.12 -38.33 -12.78
C 28.91 43.03 -1.91 80.86 26.95
D 12.84 24.55 -25.96 4.05 1.35
E 9.57 5.84 -33.88 -23.62 -7.77
F --- -11.48 -23.62 -32.39 -16.19
G 3.65 11.39 -12.18 1.39 0.46
Average 4.34 15.83 -10.68 8.12 1.93
From Table 9 we find that the absolute value depositors’ share has dropped in three out the seven banks over 3 years. In banks B and F, this drop can be explained in part by the drop in investment deposits. But in bank E, depositors’ share dropped despite the increase in investment deposit as
confirmed in Table 10, which shows a rapid drop in the ratio of deposits share to customers’ deposits, as indicated by the negative signs in Table 10.
Table 10: Profit Share of Investors/Customers’ Deposits
BANK 1998 1999 2000 2001 Avg. 98/99 99/00 00/01 98/01 A 2.66 2.12 3.20 3.20 2.79 -20.45 51.32 0.14 20.22 B 4.36 3.71 2.15 2.45 3.17 -14.81 -42.12 14.05 -43.76 C 4.06 4.33 4.83 3.53 4.19 6.68 11.63 -26.95 13.00 D 5.17 4.29 5.66 4.87 5.00 -17.11 31.93 -13.91 -5.85 E 4.02 4.22 4.43 2.66 3.88 5.02 4.88 -39. 99 -33.91
F --- 6.66 5.55 5.72 5.98 --- -16.75 3.06 14.20 G 4.56 4.47 4.30 3.29 4.16 -2.03 -3.89 -23.46 -27.93
Average 4.14 4.26 4.30 3.67 4.16 -7.12 5.29 12.48 -16.92
The importance of cooperation between the investment and marketing departments is strikingly shown in these two tables. There is an apparent link between a depositor’s share of profit and her desire to keep on depositing in the bank’s investment accounts, or even in the current account that he is used to.
If the rate of return is so important to depositors that we find a positive relationship between the size of investment deposits and the profit, though at a lag, Table 10 points out a fact, often forgotten, that through improvement in its services, a bank can lure customers to remain with it – what is called customers’ loyalty – even with weak a return on deposits. This may explain why even a smart researcher will not find a perfect correspondence between highest deposits and highest returns. This kind of “second line of defence” is imperative for the Islamic bank should take: improved services and high confidence/reliability can be leaned on if high returns become temporarily scarce.
3.4 Change in Earnings and Expenses
A study of the expenses and earnings of the Islamic banks enable us to understand the efficiency of the policy adopted in expenses and in pricing its services. Tables 11 and 13 show the growth of expenses and earnings, separately, while Table 12 ties expenses to investment deposits. Table 14 illustrates the change in the relation between expenses and earnings of the 7 Islamic banks. It should be noted that depositor’ share of profits is not considered in an Islamic bank as part of the expenses, in contrast to interests in a conventional bank.
Cost efficiency is usually defined as the gap between the expense of a given bank and the expense of the lowest other bank for providing the same
service under the same economic, environmental and social conditions. Apart from the difficulty of assessing the cost efficiency of a bank, because there is in fact no such thing as “same conditions” for any two banks, its evaluation requires information not available in the annual financial reports.
For this reason, we will assume that Islamic financial services provided by Islamic banks are similar so that we may compare their expenses but we will use changes on expenses instead of absolute numbers as depicted in Table 11.
Table 11: Percentage of Expenses Growth
BANK 1998/99 1999/2000 2000/2001 1998/2001 Average
A 0.75 2.99 7.25 11.28 3.76
B 14.29 -37.50 133.33 66.67 22.22
C -25.81 -10.33 32.12 -12/10 -4.03
D 6.25 -5.88 0.00 0.00 0.00
E -0.87 48.92 9.33 61.40 20.47
F --- 1.92 0.00 1.92 0.96
G -7.77 -2.46 8.63 -2.27 -0.76
Average -2.19 -0.33 27.24 18.13 6.09
Consequently, our consideration of the cost efficiency will be in the form of answering the following question. If a bank can reduce its expenses why can’t another bank do the same? It is evident from the table that two Islamic banks were able to reduce their costs, and they happens to be the same banks that realized the highest level of deposits and assets during the period covered by the study. In contrast, we notice that two other banks had their costs increased by an annual average of more 20 per cent, despite only a very modest increase in their investments and deposits.
Keeping in mind that the overall objective of spending is to serve the bank’ investment, we should quickly move to the ratio of expenses to assets, which is illustrated in Table 12 in an attempt to discover the indication of this index as to how the Islamic bank achieves its objectives.
Four banks were able to reduce their cost/invested assets index. Two of them were able to reduce this index by 56 per cent and 33 per cent respectively during the three years. This index rose in three other banks by 45 per cent, 35 per cent and 25 per cent respectively during the same time!
Furthermore, this index as is declining in banks A and G and, to some extent, C as indicated by its yearly changes. This implies that these banks look after their cost efficiency. On the other hand, it takes an upward movement in banks D, E, and F, and, to some extent, B.
Table 12: Percentage of Expenses/Invested Assets
BANK 1998 1999 2000 2001 Avg. 98/99 99/00 00/01 98/01 A 2.75 2.72 2.45 2.42 2.59 -1.03 -10.08 -1.19 -12.06 B 1.42 1.61 0.83 1.92 1.45 13.44 -48.38 130.90 35.22 C 3.73 2.19 1.57 1.61 2.28 -41.29 -28.56 2.69 -56.93 D 1.96 1.56 1.80 1.87 1.80 -20.30 15.56 3.68 -4.50 E 3.04 2.99 4.25 4.44 3.68 -1.72 42.23 4.33 45.83 F --- 1.29 1.25 1.62 1.39 --- -3.14 29.37 25.31 G 2.06 1.80 1.52 1.36 1.68 -12.74 -15.41 -10.35 -33.83 Average 2.49 2.02 1.95 2.18 2.12 -10.61 -6.83 22.78 -0.14
It does without saying that the index of expenses to invested assets helps in the bank’s investment planning because it measures the cost of managing invested assets: every one hundred Dinars of invested assets costs 2.12 Dinars in the seven banks’ average. This cost of investment is above average in banks E, A, C while bank F was able to provide the services with the lowest cost of all.
With regard to revenues (a term used to cover returns to both shareholders and depositors together because our concern here is focused on the bank’s ability to generate income) Table 13 shows that revenues increased by an average of 19 per cent in bank C; an expected high rate in line with all other growth indices observed in this bank over three years. The increase in revenues is a sign of one or two measures: rational policy in services pricing and a higher return on investment. The latter is in turn an indication of an increase in the size of invested assets and an improvement in their quality. All these matters are very instrumental in the success of any bank and the success of Islamic banks in particular because they do not have the choice of both attractive and guaranteed investment at the same time as conventional banks do.
Table 13: Percentage of Growth in Earnings
BANK 1998/1999 1999/2000 2000/2001 1998/2001 Average
A -11.65 26.99 1.45 13.82 4.61
B -4.21 -35.16 69.49 5.26 1.75
C 15.41 23.13 10.32 56.77 18.92
D 11.93 12.30 -21.53 -1.38 -0.46
E 3.69 13.72 -2.01 15.55 5.18
F --- -6.66 -14.84 -20.51 -10.26
G 1.59 7.46 -0.62 8.48 2.83
Average 2.79 5.97 6.04 11.14 3.23
However, to arrive at a meaningful conclusion regarding the revenues we need to explain the income pattern in other banks too. In this regards, we shall take into account the financial and business boom of 1999/2000 that
had a sizable impact on financial results, especially that the effect of the stock market crisis did not affect the Arab region until late 2000. Except for bank F, the Islamic banks were only little affected because of the scantiness of their investments in the global market. That is why we see high earning figures with all the banks for year 2000 that were not attributable to their management style or to their ability to innovate or market their banking instruments or services.
Additionally, bank A was able to introduce two new types of investment instruments that fetched it 20 per cent and 24 per cent of the total earnings for 2000 and 2001 respectively. This enabled the bank to make up for the drop in the bank’s investment earnings, to increase customers’ deposits (restricted and special accounts) by 23 per cent and 24 per cent respectively and to improve depositors’ share of profit. For bank F, while the average decline in its total deposits was close to the decline in average earning, the drop in its investment deposits exceeded the decline in earning by about one half. In banks B, D and E, there was no visible increment in their revenues other than what was caused by to boost of year 2000. What remains is to focus on bank G.
A careful look at this bank’s balance sheet reveals a weakness of its investment selection policy. While the average return on its murabahah and istisna[ investments hovers around 10 per cent, revenues on most of its other investments are very weak. This resulted in a drop of the average ratio of total revenues to invested assets from 8.79 per cent to 6.46 per cent, i.e. an average of more than one quarter over three years as shown in Table 14. Perhaps the most important reason of this decline is its dependence on low-yielding investments such as short–term international murabahah that increased by more that five and a half times, until it reached almost one half of the bank’s investments in 2001.
Table 14: Percentage of Revenues/Invested Assets
BANK 1998 1999 2000 2001 Avg. 98/99 99/00 00/01 98/01 A 7.63 6.62 7.34 6.86 7.12 -13.21 10.89 -6.53 -10.05 B 6.42 6.11 3.27 5.49 5.32 -4.92 -46.45 67.73 -14.60 C 8.01 7.32 7.18 6.15 7.16 -8.67 -1.91 -14.26 -23.19 D 13.35 11.21 15.45 12.57 13.15 -16.04 37.88 -18.64 -5.82 E 8.48 8.72 9.47 8.85 8.88 2.80 8.62 -6.49 4.41 F --- 8.75 7.60 8.38 8.19 --- -11.30 10.18 -2.27 G 8.79 8.45 7.87 6.46 7.89 -3.89 -6.81 -17.99 -26.55 Average 8.78 8.14 8.31 7.82 8.24 -7.32 -1.30 2.00 -11.15
Table 14 shows the revenues/investment index. Any conclusion to be made from the table should take note of the different economic and financial
conditions in the countries where the banks are located. Nevertheless, lack of better information has forced us to categorize the banks into three groups:
Bank D alone; Banks E and F; and Banks A, C, G, and B. Bank D is very selective in its investments; it chooses high-yield assets. Despite the decline in its assets and deposits, it was able to maintain high returns. The second group, banks E and F, maintained a satisfactory level of return. Bank C contended itself with conventional financing, at an acceptable rate of return without going for international murabahah as an easy way to place idle funds since it does not require any detailed study or plan. Bank F benefited from its size to diversify investment. Three of the four banks in the third group relied on international murabahah with its low return. As for bank A, it got no more that 4-5 per cent return on its investment in local murabahah either because of the pricing of its services or because of the narrowness of the market from which it chooses its customers. That is, despite its non-recourse to international murabahah that did not exceed 6.55 per cent and 5.66 per cent of its invested assets in 2001 and 2002 respectively.
Additionally, the average column in Table 14 shows that all banks have weak asset turnover ratios. This is caused by the fact that most of their assets were held in the form of debts that come from murabahah and istisna[
contracts. Debt assets cannot be turned into liquid for reinvestment. Efforts to change the financing structure from murabahah to musharakah, (an alternative to murabahah especially in financing letters of credit which is different from the known production partnership) and to expand the murabahah/ijarah combined portfolios would enable the Islamic banks to sell their invested assets to the central bank or to other banks in order to have sufficient liquidity that enable them to raise the rate of asset turnover. Until such efforts take their full scale, we should not be surprised by low and declining revenue indices for all the 7 Islamic banks as shown in Table 14.
We turn now to the index of expenses to revenues which we find in Table 15. Three banks were able to reduce this index while it rose dramatically in three other banks. The two biggest increases in this index (banks B and F) came from a decline in revenues. The third increase was caused by an increase in cost.
However, we can detect the big impact of using advanced technology on cost reduction, which becomes apparent when bank G is compared with Bank A, since both of them are similar in terms of large number of current accounts but are greatly different in deploying advanced technology in banking operations. Finally, we must remember that bank D is an off-shore bank dealing only with few people and is selective in its investments, a factor that enabled it to occupy the best position in the expenses to revenues index.
Table 15: Percent of Expenses to Revenues
BANK 1998 1999 2000 2001 Avg. 98/99 99/00 00/01 98/01 A 36.04 41.10 33.33 35.24 36.43 14.04 -18.91 5.71 -2.23 B 22.11 26.37 25.42 35.00 27.23 19.31 -3.60 37.67 58.33 C 46.62 29.97 21.83 26.14 31.14 -35.72 -27.17 19.76 -43.93 D 14.68 13.93 11.68 14.88 13.79 -5.07 -16.19 27.44 1.40 E 35.87 34.30 44.91 50.11 41.30 -4.40 30.95 11.57 39.67 F --- 15.06 16.44 19.31 16.94 --- 9.20 17.43 28.22 G 23.41 21.25 19.29 21.09 21.26 -9.21 -9.23 9.32 -9.91 Average 28.79 26.00 24.70 28.82 26.87 -3.51 -4.99 18.41 10.22
3.5 Changes in Net Profits
In this sub-section we shall focus on the profitability of the Islamic bank by studying the changes in net profits, the profit to invested assets index and the ratio of profit to shareholders’ equity taking the rate of equity growth into account. For a meaningful comparison we have taken profits figures before reserves and tax because our focus is on the achievement of the bank’s management itself, though analysis of after tax profit is also possible.
Table 16: Net Profit/Invested Assets
98/01 01/00
00/99 99/98 Avg.
2001 2000 1999 1998 BANK
70.03 190.74 -84.55
278.55 1.61
1.55 0.53 3.44 0.91 A
51.44 20.47 5.54
19.11 1.26 1.54 1.27 1.21 1.01 B
-6.23 -0.31 -5.94
335.76 0.74
1.12 1.13 1.20 -0.51 C
-27.12 -24.83 0.23
-3.27 2.13 1.70 2.26 2.25 2.33 D
-6.87 62.10 -32.51
-14.87 1.61 1.79 1.10 1.64 1.92 E
31.46 132.87 -43.55
---- 0.40
0.55 0.24 0.42 ---- F
-17.30 -11.06 -7.03
0.01 2.63
2.31 2.60 2.80 2.80 G
13.63 52.85 -23.97
102.55 1.48
1.51 1.30 1.85 1.41 Average
Table 16 shows the index of net profits to invested assets. From this table it is observed that two Islamic banks were able to realize profits of more than 2 per cent on their invested assets. A third bank also exceeded the average profitability of the seven banks while three of them hovered around the average, leaving two other banks at positions far below the average.
We should however note the effect of the drastic change that took place in the management concepts, style and approaches to investment and to customer relation that took place in bank C. This made this bank move from low profitability, or loss, to a higher level in one year, 1999. But the bank
could not sustain that big move and its profitability index stabilized around 1.1 per cent to 1.2 per cent over the three years. Also a look at the profitability index of banks F, B, C, and to some extent, E and A, indicates a weakness in their ability to improve profit rates.
Finally, Table 16 emphasizes the result we arrived at earlier: low turnover in all these banks. While it is high turnover rate that is a major factor of profit making in conventional banks.
It is perhaps useful to compare revenues, expenses and net profits indices all together, in such a way as to facilitate an observation of the relationship between them. This would assist the annual planning of the Islamic bank.
Figure 2 puts these three indices together side by side. Observing the profitability index alongside the expenses and revenues indices helps understand the phenomenon of chronic weakness of profit making in banks.
It is such an important matter in management that Islamic banks should be in constant alert to avoid it. Chronic weaknesses of profit making are characterized by an increase in spending, stagnancy of revenues, slowness in introducing any substantial managerial change, and modality of conducting their affairs pertaining to relations with customers as well as investment policies.
It is noticeable from Figure 2 that there are differences between Islamic banks in concurrence of investment profitability index with the index of their revenues. While bank D achieved the highest revenue index, it was not the bank with the highest profit on investment; just like bank F which was able to squeeze spending but did not make high profit on investment despite attaining a high rate in the revenue index. Also, bank G achieved the highest profitability on investment while its achievement in the areas of expenses and earnings was modest. The reason for this disparity is found in the differences of pricing of services offered by Islamic banks to owners of all kinds of investment deposits and the differences in the ratio of non-investible parts of deposits. These prices belong to the realm of distribution in the Islamic banks and do not appear in Figure 2.
Revenues, Expenses, Profits as percentage of Invested Assets
0 2 4 6 8 10 12 14
A B C D E F G
Banks
%
Revenues/ Invested Assets Expenses/ Invested Assets Profits/ Invested Assets
Figure 2
Table 17 shows the trend of change in the net profits, regardless of its relationship to invested assets. What is striking is that bank F was able to raise the rate of growth of its profits from 40 per cent to 80 per cent between 2000 and 2001 despite the decline in its total earnings in the same period. The reason is that the bank re-priced some of its services and was able to increase the bank’s share of investment returns from unrestricted and restricted investment deposits from 4 per cent and 12.4 per cent in 1999 to 14.6 per cent and 13.7 per cent in 2000; then to 18.1 per cent and 20.3 per cent in 2001 respectively. This had a big impact on the bank’s net profit despite the decline in deposits and investments. What the bank did was very important in affecting the bank’s profitability, thus emphasizing the importance and effectiveness of bank’s pricing policy in achieving results.
Table 17: Growth Rate of Shareholders’ Net Profit
BANK 1998/99 1999/2000 2000/2001 1998/2001 Average
A -40.91 15.38 -53.33 -68.18 -22.73
B 20.00 27.78 21.74 86.67 28.89
C 26900.00 18.07 28.26 51.44 17.15
D 28.95 -18.73 -27.50 -23.68 -7.89
E -14.13 -29.34 69.87 3.07 1.02
F --- -40.59 80.00 6.93 3.47
G 5.71 7.21 7.77 22.14 7.38
Average 4483.27 -2.84 18.12 11.20 3.90