A COLLECTION OF ACCOUNTING CASE STUDIES ANALYZING FINANCIAL REPORTING
By Jessica Pearson
A thesis submitted to the faculty of The University of Mississippi in partial fulfillment of the requirements of the Sally McDonnell Barksdale Honors College.
Oxford May 2018
Approved by
Advisor: Dr. Victoria Dickinson
Reader: Dean Mark Wilder
ii
© 2018 Jessica Lee Pearson
ALL RIGHTS RESERVED
iii Abstract
The following thesis contains a group of twelve accounting case studies that were completed between August 2016 and May 2017. The cases deal with a number of
different accounting topics including depreciation, inventory valuation, formatting financial statements, the new revenue recognition standard, leases, using the Codification Research System, internal controls, stock-based compensation, and deferred income taxes. Each of these cases were picked to follow along with what was being taught in Intermediate Accounting at the time, and they were useful in building on the information I was already learning. The cases provided a different way of looking at each of the topics, and they took my understanding on those topics to a higher level. Each chapter that follows contains one case that is unrelated to any of the other ones, and they should be viewed independently. Even though they are unrelated, when the cases are put together they form a complete work that showcases the journey take over those ten months.
iv
TABLE OF CONTENTS
CASE ONE………1
CASE TWO………...………17
CASE THREE………...…22
CASE FOUR……….…...…..26
CASE FIVE………...29
CASE SIX………..…34
CASE SEVEN………..……….39
CASE EIGHT………...…….43
CASE NINE………..……….48
CASE TEN……….………56
CASE ELEVEN……….………61
CASE TWELVE………...……….67
v
LIST OF TABLES
TABLE 1A Home Heaters account balances following journal entries for the year TABLE 1B Journal entries made throughout the year for Home Heaters
TABLE 1C Home Heaters trial balance following journal entries TABLE 1D Glenwood Heating additional information journal entries
TABLE 1E Glenwood Heating additional information journal entries continued TABLE 1F Eads Heaters additional information journal entries
TABLE 1G Eads Heaters additional journal entries continued TABLE 1H Eads Heaters additional journal entries continued (2) TABLE 1I Glenwood Heating trial balance
TABLE 1J Eads Heaters trial balance
TABLE 4A Analyzing Fraud Schemes and Internal Control Procedures
1
Case Number One:
Home Heaters: A Comparison of Glenwood Heating, Inc. and Eads Heaters, Inc.
The following case study is a look at two companies which are described below. This case study involved making journal entries for the companies, making their adjusting entries, and preparing financial statements for both Glenwood Heating, Inc and Eads Heaters, Inc. Lastly, a recommendation was made about which company seemed better
off financially and which one was preferred to lend money to.
2
Two companies began operations at the beginning of 20X1. One was Glenwood Heating, Inc., and the other was Eads Heaters, Inc. These two companies sell heating units, and they had the same transactions during their first year of operations. Below are the journal entries for their 12 first year transactions, and a trial balance for them also.
Both companies sold stock and took out a loan to acquire cash of $560,000 total. They also both bought a building, equipment, and land for a total of $500,000. Their $398,500 worth of sales were all on credit, and they collected $299,100 of that during the year.
They spent $239,800 on their inventory and paid off $213,360 of that before year end.
They also paid for advertising, supplies, insurance, and wages, and they paid dividends of
$7.25 per share. The following tables show the account balances for Home Heaters, the journal entries made, and trial balance following those entries.
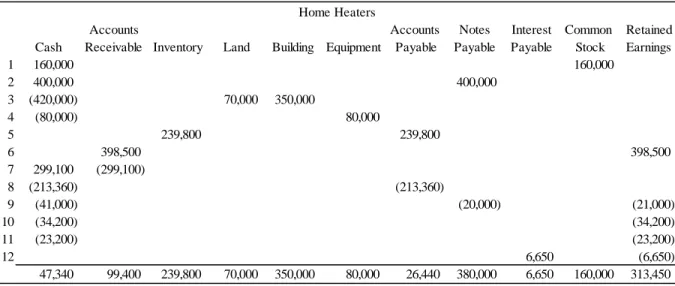
Table 1A: Home Heaters account balances following journal entries for the year
Accounts Accounts Notes Interest Common Retained
Cash Receivable Inventory Land Building Equipment Payable Payable Payable Stock Earnings
1 160,000 160,000
2 400,000 400,000
3 (420,000) 70,000 350,000
4 (80,000) 80,000
5 239,800 239,800
6 398,500 398,500
7 299,100 (299,100)
8 (213,360) (213,360)
9 (41,000) (20,000) (21,000)
10 (34,200) (34,200)
11 (23,200) (23,200)
12 6,650 (6,650)
47,340
99,400 239,800 70,000 350,000 80,000 26,440 380,000 6,650 160,000 313,450 Home Heaters
3
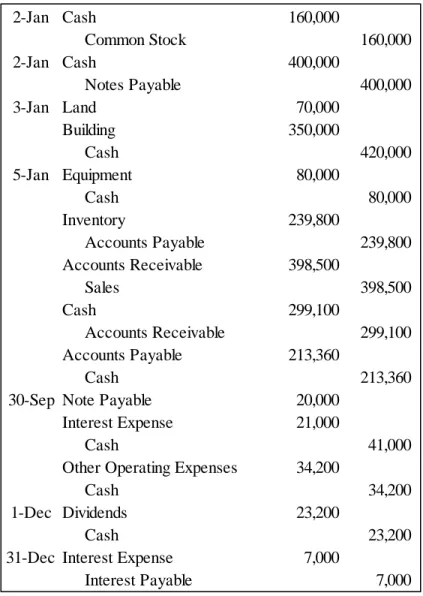
Table 1B: Journal entries made throughout the year for Home Heaters
2-Jan Cash 160,000
Common Stock 160,000
2-Jan Cash 400,000
Notes Payable 400,000
3-Jan Land 70,000
Building 350,000
Cash 420,000
5-Jan Equipment 80,000
Cash 80,000
Inventory 239,800
Accounts Payable 239,800
Accounts Receivable 398,500
Sales 398,500
Cash 299,100
Accounts Receivable 299,100
Accounts Payable 213,360
Cash 213,360
30-Sep Note Payable 20,000
Interest Expense 21,000
Cash 41,000
Other Operating Expenses 34,200
Cash 34,200
1-Dec Dividends 23,200
Cash 23,200
31-Dec Interest Expense 7,000
Interest Payable 7,000
4
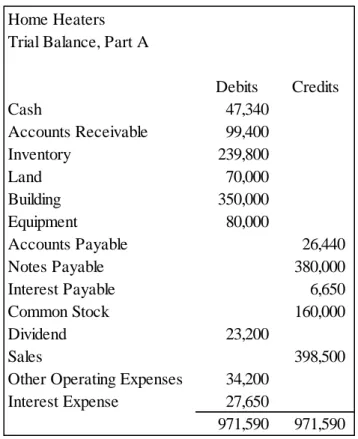
Table 1C: Home Heaters trial balance following journal entries Home Heaters
Trial Balance, Part A
Debits Credits
Cash 47,340
Accounts Receivable 99,400
Inventory 239,800
Land 70,000
Building 350,000
Equipment 80,000
Accounts Payable 26,440
Notes Payable 380,000
Interest Payable 6,650
Common Stock 160,000
Dividend 23,200
Sales 398,500
Other Operating Expenses 34,200 Interest Expense 27,650 971,590
971,590
5
Glenwood Heating, Inc. and Eads Heaters, Inc. made different decisions when it came to how to make their adjusting entries on December 31st. Glenwood Heating predicted that one percent of accounts receivable will be uncollected, and Eads Heaters predicted that five percent will be. Therefore, Glenwood’s bad debt expense is $994, and Eads Heater’s is $4,970. Glenwood picked to use FIFO to keep track of their inventory and Eads used LIFO. This resulted in Glenwood having a higher ending inventory and a lower cost of goods sold. They also depreciated the building and equipment differently with Glenwood using straight-line for both, and Eads using straight-line depreciation for the building and double-declining balance depreciation for the equipment. Both
companies are renting operating equipment. Glenwood is renting the equipment by the year, and Eads is signing a lease to rent it for eight years with eight percent interest.
Finally, both Glenwood Heating and Eads Heaters are paying 25 percent of their net income to taxes to avoid a late payment penalty. Below are the journal entries and a trial balance for each company after these five adjusting entries.
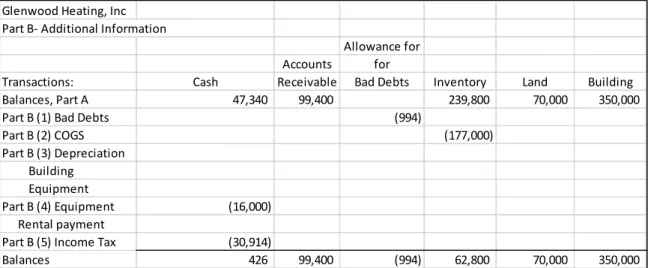
Table 1D: Glenwood Heating additional information journal entries
Glenwood Heating, Inc Part B- Additional Information
Allowance for
Accounts for
Transactions: Cash Receivable Bad Debts Inventory Land Building
Balances, Part A 47,340 99,400 239,800 70,000 350,000
Part B (1) Bad Debts (994)
Part B (2) COGS (177,000)
Part B (3) Depreciation Building
Equipment
Part B (4) Equipment (16,000) Rental payment
Part B (5) Income Tax (30,914)
Balances 426 99,400 (994) 62,800 70,000 350,000
6
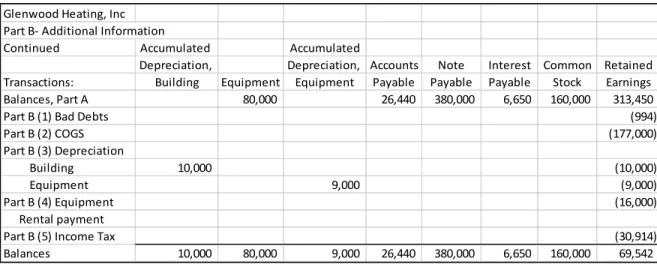
Table 1E: Glenwood Heating additional information journal entries continued
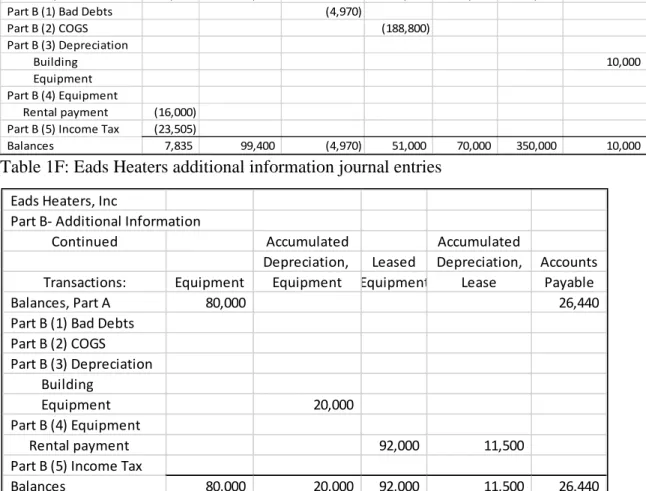
Table 1F: Eads Heaters additional information journal entries
Table 1G: Eads Heaters additional journal entries continued
Glenwood Heating, Inc Part B- Additional Information
Continued Accumulated Accumulated
Depreciation, Depreciation, Accounts Note Interest Common Retained
Transactions: Building Equipment Equipment Payable Payable Payable Stock Earnings
Balances, Part A 80,000 26,440 380,000 6,650 160,000 313,450
Part B (1) Bad Debts (994)
Part B (2) COGS (177,000)
Part B (3) Depreciation
Building 10,000 (10,000)
Equipment 9,000 (9,000)
Part B (4) Equipment (16,000)
Rental payment
Part B (5) Income Tax (30,914)
Balances 10,000 80,000 9,000 26,440 380,000 6,650 160,000 69,542
Eads Heaters, Inc
Part B- Additional Information
Allowance for Accumulated
Accounts for Depreciation,
Transactions: Cash Receivable Bad Debts Inventory Land Building Building
Balances, Part A 47,340 99,400 239,800 70,000 350,000
Part B (1) Bad Debts (4,970)
Part B (2) COGS (188,800)
Part B (3) Depreciation
Building 10,000
Equipment Part B (4) Equipment
Rental payment (16,000) Part B (5) Income Tax (23,505)
Balances 7,835 99,400 (4,970) 51,000 70,000 350,000 10,000
Eads Heaters, Inc
Part B- Additional Information
Continued Accumulated Accumulated
Depreciation, Leased Depreciation, Accounts
Transactions: Equipment Equipment Equipment Lease Payable
Balances, Part A 80,000 26,440
Part B (1) Bad Debts Part B (2) COGS Part B (3) Depreciation Building
Equipment 20,000 Part B (4) Equipment
Rental payment 92,000 11,500
Part B (5) Income Tax
Balances 80,000 20,000 92,000 11,500 26,440
7
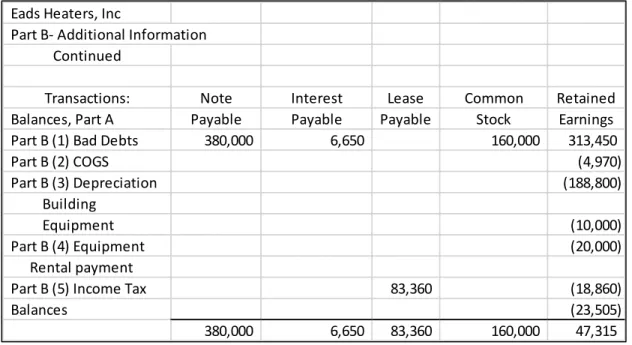
Table 1H: Eads Heaters additional journal entries continued (2)
Eads Heaters, Inc
Part B- Additional Information Continued
Transactions: Note Interest Lease Common Retained
Balances, Part A Payable Payable Payable Stock Earnings
Part B (1) Bad Debts 380,000 6,650 160,000 313,450
Part B (2) COGS (4,970)
Part B (3) Depreciation (188,800)
Building
Equipment (10,000)
Part B (4) Equipment (20,000)
Rental payment
Part B (5) Income Tax 83,360 (18,860)
Balances (23,505)
380,000
6,650 83,360 160,000 47,315
8 Table 1I: Glenwood Heating trial balance
Glenwood Heating, Inc Trial Balance, Part B
Debits Credits
Cash 426
Accounts Receivable 99,400
All for Bad Debts 994
Inventory 62,800
Land 70,000
Building 350,000
Accumulated Depreciation, Building 10,000
Equipment 80,000
Accumulated Depreciation, Equipment 9,000
Accounts Payable 26,440
Notes Payable 380,000
Interest Payable 6,650
Common Stock 160,000
Dividend 23,200
Sales 398,500
Cost of Goods Sold 177,000
Other Operating Expenses 34,200
Bad Debt Expense 994
Depreciation Expense, Building 10,000 Depreciation Expense, Equipment 9,000
Rent Expense 16,000
Interest Expense 27,650
Provision for Income Tax 30,914
Total 991,584 991,584
9 Table 1J: Eads Heaters trial balance
Eads Heaters, Inc Trial Balance, Part B
Debits Credits
Cash 7,835
Accounts Receivable 99,400
All for Bad Debts 4,970
Inventory 51,000
Land 70,000
Building 350,000
Accumulated Depreciation, Building 10,000
Equipment 80,000
Accumulated Depreciation, Equipment 20,000 Leased Equipment 92,000
Accumulated Depreciation, Lease 11,500
Accounts Payable 26,440
Notes Payable 380,000
Lease Payable 83,360
Interest Payable 6,650
Common Stock 160,000
Dividend 23,200
Sales 398,500
Cost of Goods Sold 188,800 Other Operating Expenses 34,200 Bad Debt Expense 4,970 Depreciation Expense, Building 10,000 Depreciation Expense, Equipment 20,000 Depreciation Expense, Lease 11,500 Interest Expense 35,010 Provision for Income Tax 23,505
Total 1,101,420 1,101,420
10
Below you will find a copy of Glenwood Heaters, Inc. and Eads Heaters, Inc.
financial statements. This includes an Income Statement, a Statement of Changes in Stockholders’ Equity, a Balance Sheet, and a Statement of Cash Flows for each company.
Sales 398,500
Cost of Goods Sold 177,000
Gross Profit 221,500
Operating Expenses
Bad Debt Expense 994 Depreciation Expense, Building 10,000 Depreciation Expense, Equipment 9,000 Other Operating Expenses 34,200
Total Operating Expenses 54,194
Income from Operations 167,306
Other Expenses
Rent Expense 16,000
Interest Expense 27,650
Total Other Expenses 43,650
Income before Taxes 123,656
Income Tax Expense 30,914
Net Income 92,742
Glenwood Heating, Inc Income Statement
For the Year Ending December 31, 20X1
Common Retained Total Stock Earnings Equity Beginning Balance 160,000 - 160,000
Net Income 92,742 92,742
Cash Dividends (23,200) (23,200)
Balance, December 31, 20X1 160,000 69,542 229,542 Glenwood Heating, Inc
Statement of Changes in Stockholders' Equity For the Year Ended December 31, 20X1
11 Current Assets
Cash 426
Accounts Receivable 99,400
Less Allowance for Doubtful Accounts (994)
Inventory 62,800
Total Current Assets 161,632
Plant Assets
Buildings and Equipment 430,000 Less Accumulated Depreciation (19,000)
Buildings and Equipment, Net 411,000
Land 70,000
Total Plant Assets 481,000
Total Assets 642,632
Current Liabilities
Accounts Payable 26,440
Interest Payable 6,650
Total Current Liabilities 33,090
Long Term Liabilities
Notes Payable 380,000
Total Liabilites 413,090
Common Stock 160,000
Retained Earnings 69,542
Total Equity 229,542
Total Liabilites and Equity 642,632
Assets
Liabilities
Equity
Glenwood Heating, Inc Classified Balance Sheet As of December 31, 20X1
12 Cash from operating activities
Net Income 92,742
Depreciation Expense 19,000 Increase in Bad Debt Expense 994 Increase in Accounts Receivable (99,400) Increase in Inventory (62,800) Increase in Accounts Payable 26,440 Increase in Interest Payable 6,650
Net cash used by operating activities (16,374) Cash from investing
Cash paid for land (70,000)
Cash paid for equipment (80,000) Cash paid for building (350,000)
Net cash used by investing (500,000)
Cash from financing
Cash paid for dividends (23,200) Cash received from issuing stock 160,000 Cash received from note 380,000
Net cash provided by financing 516,800
Net change in cash 426
Beginning Cash -
End Cash 426
Glenwood Heating, Inc Statement of Cash Flows For the Year Ended December 31, 20X1
13
Sales 398,500
Cost of Goods Sold 188,800
Gross Profit 209,700
Operating Expenses
Bad Debt Expense 4,970
Depreciation Expense, Building 10,000 Depreciation Expense, Equipment 20,000 Depreciation Expense, Lease 11,500 Other Operating Expenses 34,200
Total Operating Expenses 80,670
Income from Operations 129,030
Other Expenses
Interest Expense 35,010
Total Other Expenses 35,010
Income before Taxes 94,020
Income Tax Expense 23,505
Net Income 70,515
Eads Heaters, Inc Income Statement
For the Year Ending December 31, 20X1
Common Retained Total Stock Earnings Equity Beginning Balance 160,000 - 160,000
Net Income 70,515 70,515
Cash Dividends (23,200) (23,200)
Balance, December 31, 20X1 160,000 47,315 207,315 Eads Heaters, Inc
Statement of Changes in Stockholders' Equity For the Year Ended December 31, 20X1
14 Current Assets
Cash 7,835
Accounts Receivable 99,400
Less Allowance for Doubtful Accounts (4,970)
Inventory 51,000
Total Current Assets 153,265
Plant Assets
Buildings and Equipment 522,000 Less Accumulated Depreciation (41,500)
Buildings and Equipment, Net 480,500
Land 70,000
Total Plant Assets 550,500
Total Assets 703,765
Current Liabilities
Accounts Payable 26,440
Interest Payable 6,650
Lease Payable 83,360
Total Current Liabilities 116,450
Long Term Liabilities
Notes Payable 380,000
Total Liabilites 496,450
Common Stock 160,000
Retained Earnings 47,315
Total Equity 207,315
Total Liabilites and Equity 703,765
Assets
Liabilities
Equity Eads Heaters, Inc.
Classified Balance Sheet As of December 31, 20X1
15 Cash from operating activities
Net Income 70,515
Depreciation Expense 41,500 Increase in Bad Debt Expense 4,970 Increase in Accounts Receivable (99,400) Increase in Inventory (51,000) Increase in Accounts Payable 26,440 Increase in Interest Payable 6,650
Net cash used by operating activities (325) Cash from investing
Cash paid for land (70,000)
Cash paid for equipment (80,000) Cash paid for building (350,000)
Net cash used by investing (500,000)
Cash from financing
Cash paid for dividends (23,200) Cash paid on equipment rental note (8,640) Cash received from issuing stock 160,000 Cash received from note 380,000
Net cash provided by financing 508,160
Net change in cash 7,835
Beginning Cash -
End Cash 7,835
Eads Heaters, Inc Statement of Cash Flows For the Year Ended December 31, 20X1
16
Based off these financial statements, Glenwood Heaters, Inc. has a higher net income than Eads Heaters, Inc. by almost $20,000. It seems like Eads Heaters is being more cautious when they are stating their assets and inventory. They have a higher Allowance for Doubtful Accounts than Glenwood Heaters, and they depreciated their equipment at a faster rate giving them $11,000 less in equipment than Glenwood.
Glenwood rented their operating equipment by the year, and Eads Heaters signed an eight-year lease. This gives Glenwood the option not to rent it next year if a better deal or better equipment comes around, but by Eads having a rental agreement already in place, they do not have to worry about the price going up on the equipment they already have.
At this point in time, Glenwood only has $426 in cash while Eads has almost $8,000.
Glenwood Heaters has a higher income from operations than Eads while Eads seems to be better at keeping cash on hand. Both companies have some strong points and some not so strong points.
Based off the current ratio, Glenwood has the better ability to pay their short-term debts than Eads with a ratio of 4.88 percent. Eads has a current ratio of 1.32 percent.
Glenwood just has less debt in general, so I would be more comfortable lending them money. Also, Glenwood has a better return on total assets than Eads. Both companies have their strengths. They are very close in many aspects, but given all this information, I would rather invest or lend money to Glenwood Heaters, Inc. Even though Eads Heaters is being more cautious than Glenwood, Glenwood seems to be doing a better job of turning what assets they do have into a profit.
17
Case Number Two:
Totz and Doodlez: Researching Income Statement Questions Using the Codification Research System
This case introduced me to the Codification Research System which contains the accounting standards adopted by FASB. It answers questions relating to the income
statement by pulling information from the Codification. The specific information regarding the companies in this case is listed below.
18
Totz manufactures is a clothing store that sells high quality children’s clothing. These stores also contain art studios where kids can take a variety of art classes. These art studios are called Doodlez. The following information was determined after reading and researching some questions Totz had about how to report a few items on their income statement. The questions and answers are stated below.
1. In 2016, Totz had sales of $86.5 million, an increase of $12 million from 2015. This revenue was partly because of an increase in revenue from Doodlez. Doodlez had net sales of $11.2 million, and the remaining part of the increase was because the average transaction value for sales increased. On the income statement, we believe that these two sales numbers should be stated separately based on ASC 225-10-S99-2. An excerpt from ASC 225-10-S99-2 says,
“Net sales and gross revenues. State separately:
(a) Net sales of tangible products (gross sales less discounts, returns and allowances),
(b) operating revenues of public utilities or others;
(c) income from rentals;
(d) revenues from services; and (e) other revenues.”
Based on this statement, Totz net sales and Doodlez net sales should not be put together, but they should be listed separately when you are listing your sales on the income statement.
19
2. Gross profit also increased during 2016 a total of 8.6%. Just as net sales were not stated together, we think that the expenses should also be separated out from each other. Totz and Doodlez expenses should be distinct based off ASC 225-10-S99-2 again. Another part of the regulation states,
“Costs and expenses applicable to sales and revenues. State separately the amount of
(a) cost of tangible goods sold,
(b) operating expenses of public utilities or others, (c) expenses applicable to rental income,
(d) cost of services, and
(e) expenses applicable to other revenues.”
Totz does not include depreciation in cost of sales. This is allowable, but that information needs to be disclosed when showing the cost of goods sold. ASC 225-10-S99-8 answers any questions about this by saying,
“If cost of sales or operating expenses exclude charges for depreciation, depletion and amortization of property, plant and equipment, the description of the line item should read somewhat as follows: "Cost of goods sold (exclusive of items shown separately below)" or "Cost of goods sold (exclusive of depreciation shown separately below)." To avoid placing undue emphasis on "cash flow,"
depreciation, depletion and amortization should not be positioned in the income statement in a manner which results in reporting a figure for income before depreciation.”
Therefore, just like the sales, we believe the cost of sales should be separated out based on whether it was used in Doodlez or not when you are making the income statement.
20
3. Also, during 2016, Totz moved its corporate headquarters to Mountain View, California. They abandoned the building and had a gain of $1.7 million. Originally ASC 225-20-45-4 said the sale of the building should not be recorded as an
extraordinary item, but ASC 225-20-45-4 has been superseded by ASU 2015-01 which eliminates the use of extraordinary items at all. Here is a part of ASU 2015-01.
“The objective of this Update is to simplify the income statement presentation requirements in Subtopic 225-20 by eliminating the concept of extraordinary items. Extraordinary items are events and transactions that are distinguished by their unusual nature and by the infrequency of their occurrence. Eliminating the extraordinary classification simplifies income statement presentation by
altogether removing the concept of extraordinary items from consideration.”
ASC 225-20-45-16 also states that this gain should be reported as a separate component of income from continuing operations. This statement is still pending because the original statement referred to extraordinary items which are no longer used. ASC 225-20-45-16 states,
“A material event or transaction that an entity considers to be of an unusual nature or of a type that indicates infrequency of occurrence or both shall be reported as a separate component of income from continuing operations. The nature and
financial effects of each event or transaction shall be presented as a separate component of income from continuing operations or, alternatively, disclosed in notes to financial statements. Gains or losses of a similar nature that are not individually material shall be aggregated. Such items shall not be reported on the
21
face of the income statement net of income taxes. Similarly, the EPS effects of those items shall not be presented on the face of the income statement.”
Therefore, the gain on the abonnement of the corporate headquarters should be placed in income from continuing operations as a separate component.
4. There was a class action settlement against one of Totz fabric suppliers. The lawsuit was settled, and Totz received $2.7 million in it. This money should be considered a cash flow from operation activities based off ASC 230-10-45-16 which says,
“All of the following are cash inflows from operating activities: …
c. All other cash receipts that do not stem from transactions defined as investing or financing activities, such as amounts received to settle lawsuits and refunds from suppliers.”
Based off (c) in ASC 230-10-45-16, settling a lawsuit is considered a cash flow from operating activities, and it should be reported as such on the income statement.
22
Case Number Three:
Rocky Mountain Chocolate Factory, Inc: Completing and Formatting Financial Statements
Below you will find an income statement, a statement of changes in stockholders’ equity, a classified balance sheet, and a statement of cash flows for Rocky Mountain Chocolate Factory for the fiscal year ended February 28, 2010. The purpose of this case was to learn how to format financial statements in excel and to get a sense of how financial statements
are put together.
23
Sales $ 22,944,017
Franchise and Royalty Fees 5,492,531
Cost of Goods Sold 14,910,622
Gross Profit 13,525,926
Operating Expenses
Franchise Costs 1,499,477
Sales and Marketing 1,505,431 General and Administrative 2,422,147
Retail Operating 1,756,956
Depreciation and Amoritization 698,580 7,882,591
Income from Operations 5,643,335
Other Expenses
Interest Expense -
Interest Income 27,210 27,210
Income before Taxes 5,670,545
Income Tax Expense 2,090,468
Net Income 3,580,077
Rocky Mountain Chocolate Factory Income Statement
For the Year Ending February 28, 2010
Common Retained Total Stock Earnings Equity Beginning Balance $ 179,696 $ 5,751,017 $ 5,930,713 Issue Common Stock 1,112 1,112
Net Income 3,580,077 3,580,077
Cash Dividends (2,407,167) (2,407,167)
Balance, January 28, 2010 180,808 6,923,927 7,104,735 Rocky Mountain Chocolate Factory
Statement of Changes in Stockholders' Equity For the Year Ending February 28, 2010
24 Current Assets
Cash and Cash Equivalents $ 3,743,092 Accounts Receivable (Less Doubtful Accounts) 4,427,526 Notes Receivable, Current 91,059
Inventory 3,281,447
Deferred Income Taxes 461,249
Other 220,163
Total Current Assets 12,224,536
Property and Equipment, Net 5,186,709
Other Assets
Notes Receivable, Less Current Portion 263,650
Goodwill, Net 1,046,944
Intangible Assets, Net 110,025
Other 88,050
Total Other Assets 1,508,669
Total Assets 18,919,914
Current Liabilities
Accounts Payable 877,832
Accrued Salaries and Wages 646,156
Other Accrued Expenses 946,528
Dividend Payable 602,694
Deferred Income 220,938
Total Current Liabilities 3,294,148
Deferred Income Taxes 894,429
Total Liabilities 4,188,577
Common Stock 180,808
Additional Paid-In Capital 7,626,602
Retained Earnings 6,923,927
Total Equity 14,731,337
Total Liabilites and Equity 18,919,914
Assets
Liabilities
Equity
Rocky Mountain Chocolate Factory Classified Balance Sheet As of February 28, 2010
25 Cash from operating activities
Net Income $ 3,580,077
Depreciation Expense 698,580 Increase in Accounts Receivable (197,793) Increase in Notes Receivable, Current (91,059) Decrease in Inventory 783,164 Increase in Deferred Income Taxes (92,052) Decrease in Other 4,215 Decrease in Accounts Payable (196,811) Increase in Accrued Salaries and Wages 222,367 Increase in Other Accrued Expenses 414,587 Increase in Deferred Income 78,938 Increaese in Dividend Payable 3,708
Net cash provided by operating activities 5,207,921 Cash from investing
Cash paid for Equipment (631,691)
Net cash used by investing (631,691)
Cash from financing
Cash paid for dividends (2,403,458) Cash received from issuing stock 316,434
Net cash used by financing (2,087,024)
Net change in cash 2,489,206
Beginning Cash 1,253,947
End Cash 3,743,153
Rocky Mountain Chocolate Factory Statement of Cash Flows For the Year Ending February 28, 2010
26
Case Number Four:
Cash and Receivables: Examining Potential Fraud Schemes and Internal Control Procedures
This case focused on fraud and how to detect that fraud. It was completed by working in groups to brainstorm different fraud schemes, and then an internal control was paired
with each fraud scheme that could help detect that fraud. This case is about a local business in Oxford, Mississippi that needs help with their internal controls, and more
information is discussed below.
27
As the owner of a small craft shop in Oxford, Mississippi, Ms. Kayla Stevens faces the possibility that fraud schemes are occurring at her local business. To safeguard the craft shop’s operations, Kayla should implement internal control systems, which include checks and balances created to prevent and detect fraud. Table 4A identifies various fraud schemes and recommends internal control procedures to protect the business.
Fraud Scheme Internal Control
Lucy may understate or not record sales as she has the power to both record sales and prepare bank deposits. Thus, Lucy could understate sales and pocket cash that she does not include with the bank deposits.
Separation of duties – Kayla should separate the responsibilities for receiving, depositing, recording, and reconciling cash so that an employee cannot both commit and conceal fraud. Clerks should collect cash during sales. A different individual should record daily sales, and Lucy may prepare bank deposits.
Kayla takes deposits to the bank and reconciles bank statements. This current system allows for embezzlement.
Separation of duties – While dividing all responsibilities may be difficult since the business is small, separation of duties provides greater internal control. One person should take deposits to the bank, and Kayla can reconcile bank statements.
Inventory purchases could be fraudulent since Kayla pays bills and monitors, records, and orders inventory. One could order inventory but then keep it for personal purposes instead of recording it in the inventory account. One could also write fraudulent checks for fake invoices.
Separation of duties – One clerk will order inventory with Kayla’s authorization, and another clerk will record the inventory once it arrives in the store. Then, Kayla can pay invoices. Thus, no one has enough power to steal inventory and hide such behavior in the records.
Clerks may input fake or inaccurate transactions as they have authority for entering all types of transactions in the registers. The shop’s new coupon program may allow clerks to enter false discounts and pocket the difference between the money collected and the sale recorded.
Access control – The types of transactions clerks can enter should be restricted, and employees should receive authorization before they can issue a refund or enter any irregular transaction into the cash register.
This internal control should limit a clerk’s ability to record an erroneous sale.
28
Fraud Scheme Internal Control
The clerks’ unlimited authority in entering transactions also allows Amanda, Becca, Sam, or Wendy to steal cash directly from the cash register.
Access control – Clerks should not remove cash without authorization. Requiring unique codes to use the register allows employee activity to be tracked, and Kayla should require the reconciliation of cash to check that the amount of cash on hand matches the receipts. To find a culprit, Kayla can give her employees vacation and see if cash discrepancies continue or end during a certain employee’s time off.
The credit card machine is behind the cash registers. Clerks may steal credit card information or perform fraudulent actions since customers cannot see that their credit card transactions are performed correctly.
Physical control – Kayla should relocate the credit card machine next to the cash registers to ensure that the credit card is swiped, and that the transaction is properly completed at the correct price.
The amount recorded for sales or cash earned may be manipulated or presented inaccurately as the store’s information system automatically updates inventory accounts while Lucy manually records sales in the accounting software.
Application and access control – Kayla can consider purchasing more sophisticated software that automatically records sales to prevent manipulation of data. If Lucy must enter sales manually, an access control should limit her access to other parts of the accounting software.
If transactions have no identification number or if register tape is not compared to the amount of sales journalized, Lucy or clerks can alter transactions without any matching supplemental records, and their actions will go unnoticed.
Application control – Kayla should use software that indexes each sale with details like the transaction number, date, amount, and clerk’s name. This internal control provides unaltered evidence of sales for audits and allows the actual cash balance to be reconciled to the register tape’s sales.
Lucy’s locked office may allow her to operate in secret.
Physical control – Any business space is property of the business, and Kayla needs a key to Lucy’s office to discourage any unauthorized actions. Kayla should keep a safe in her locked office for security.
Kayla has control of all other accounting functions, so she has the ability to commit fraud schemes such as embezzlement, misrepresenting net income, and stealing inventory.
Independent verification – Kayla should consider using an objective accountant to ensure the integrity of financial records.
For example, a physical inventory count by external and internal parties can reconcile perpetual inventory records with the true amount of product sold.
Table 4A: Analyzing Fraud Schemes and Internal Control Procedures
29
Case Number Five:
Answering Inventory Questions using Selected Financial Statement Information
The following case contains questions and answers that were compiled using financial statements and other selected information that was originally provided, and this case focuses on inventory questions including inventory ratios and inventory obsolescence
questions. More information is provided below.
30
Given selected financial statement information from 2011 and 2012, different questions about the inventory account for this company were answered.
1. Describe the three different types of inventory.
Raw materials inventory consists of all the goods bought to manufacture the products. These goods have not yet been changed or processed. Work in process inventory is all the unfinished products plus any direct labor that has been used to manufacture the products. Also, a part of factory overhead is attributed to the work in process inventory. Finished goods inventory consists of the products that are finished and have not yet been sold and all costs associated with those goods.
2. What are inventories recorded net of?
Inventories are recorded net of an estimated allowance for inventory that is not likely to be sold. This inventory is either obsolete or unmarketable, and therefore needs to be taken out of the inventory cost to accurately reflect the amount of inventory that can be sold.
3. Here is the information for the allowance for obsolete and unmarketable inventory account for 2012:
Balance, beginning of the year $10,800
Provision 13,348
Write-offs, disposals, and other (11,628) Balance, end of the year $12,520
31
a. Where does this account appear on the company’s financial statements?
This account should appear stated with the inventory accounts under current assets on the balance sheet. Gross inventory would be stated, and then less the allowance for obsolete and unmarketable inventory which would give you net inventory. Since it’s a contra account to inventory, it behaves much like allowance for doubtful account.
b. What is the gross amount for inventory at the end of the last two years?
The gross amount of inventory at the end of 2012 should be the net amount for 2012 plus the balance of the allowance for obsolete and unmarketable inventory account. So, 233,070 plus 10,800 which is 243,870 dollars at the end of 2012. The 2011 gross amount of inventory should be 224,254 dollars which is 211,734 plus 12,520.
c. What portion of the reserves for obsolete inventory comes from each of the three types of inventory?
Most of the allowance for obsolete and unmarketable inventory comes from the raw materials inventory and the finished goods inventory. Goods are more likely to come in unusable or become obsolete than they are to break while they are being made. Approximately 40% of the allowance for obsolete and unmarketable inventory comes from raw materials and finished goods each, and 20% comes from work in process inventory.
32
4. Recreate the entries that were used to record the activity in the reserve account.
Cost of Goods Sold 13,348 Allowance for obsolete and unmarketable inventory 13,348 Allowance for obsolete and unmarketable inventory 11,628
Finished Goods Inventory 11,628
5. Set up five t-accounts and use them to analyze inventory activity during 2012.
6. Compute the company’s inventory turnover ratio for 2011 and 2012.
The inventory turnover ratio is equal to the cost of sales divided by the net of the average inventories. For 2011 this comes out to 2.29 which is 575,226 divided by the average of 268,591 and 233,070. For 2012 the inventory turnover ratio is 2.63.
Accounts Payable 39,012 438,561 432,197
45,376
Raw Materials Inventory 46,976
438,561
442,068 43,469
Work in Process Inventory 1,286
126,000
442,068 568,735 619
Finished Goods Inventory 184,808
13,348 568,735 572,549 167,646
Cost of Goods Sold 0
13,348 572,549 585,897
33
7. What is the inventory holding period for 2011 and 2012?
The inventory holding period is defined as 365 divided by the inventory turnover ratio. Therefore, for 2011 it is 365/2.29 or 159.39 days, and in 2012 it is 138.78 days.
8. What percent of finished goods does the company estimate to be obsolete for 2012?
Since the reserve for obsolete inventory relates entirely to finished goods, the company estimates that 7.22% of their finished goods inventory will be obsolete.
That is 13,348 divided by 184,808. As an analyst, I would have liked to have known the purchases of this company for 2012. This would have made reconstructing the t-accounts easier.
34
Case Number Six:
Answering Depreciation and Income Questions Using Selected Information
This case focuses on depreciation, and it contains questions and answers relating to WorldCom and their fraudulent activities. More specific information is provided below,
and these questions relate to appropriate depreciation techniques.
35
WorldCom was a company that incorrectly capitalized approximately $3.9 billion worth of costs around 2002. They were caught and eventually filed bankruptcy soon thereafter. The following questions were asked and answered regarding the incorrect capitalization that WorldCom reported.
A. FASB’s Statement of Concept No. 6 describes the building blocks on which financial statements are reported.
i. Explain how SCON 6 describes assets and expenses.
Assets are anything that are going to benefit the company in the future in an economic way. Expenses are when you either use assets or incur liabilities to carry out business activities. These activities should have to do with the business’s central operations.
ii. In general, what costs should be expensed and what costs should be capitalized as assets?
Expenses should be capitalized if they are going to create a long-lasting benefit with an asset. Then these costs are depreciated over the life of the asset.
B. What becomes of these “costs” after their initial capitalization?
After costs are capitalized, they become part of the asset, and they are depreciated as the asset is depreciated. If a cost is capitalized, then income will be higher that
36
year because the cost is going to be spread out over the life of the asset. Assets will also be higher than if the cost was expensed immediately.
C. What did the company report as line costs for 2001, and what are these line costs?
Prepare the journal entry to record them.
Line costs are “access charges and transport charges” according to the reading.
The journal entries to record line costs were as followed:
Line Cost Expense 14,739,000,000 Cash 14,739,000,000
D. Describe the types of costs that were improperly capitalized by WorldCom. What gives rise to these costs, and do they meet the definition of an asset as stated in part A?
Line costs were improperly capitalized at WorldCom. These transactions
consisted of charges paid to local telephone companies to complete calls. I do not think that these line costs meet the definition of an asset as described in part A because these costs were not going to benefit the company in the future like an asset does.
E. Prepare a journal entry to record the improper capitalization of the line costs.
Where should these costs appear on the balance sheet and income statement?
37
These improperly capitalized costs appeared on the asset section of the balance sheet, and they were included in the operating activity section on the statement of cash flows. The journal entry to improperly capitalize these line costs is:
Property, Plant, and Equipment 3,055,000,000 Line Cost Expense 3,055,000,000
F. Based on the information given, calculate and record the depreciation expense for 2001.
The depreciation expense for 2001 is calculated based on a useful life of 22 years.
The calculation and journal entry follows:
771,000,000/22 years *(4/4 quarters) = 35,045,000 610,000,000/22 years *(3/4 quarters) = 20,795,000 743,000,000/22 years *(2/4 quarters) = 16,886,000 931,000,000/22 years *(1/4 quarters) = 10,580,000 $83,306,818 Depreciation Expense 83,306,818
Accumulated Depreciation 83,306,818
G. Determine WorldCom’s net income if the line costs had not been improperly capitalized.
38
The difference in WorldCom’s net income is substantial. Using a tax rate of 35%, the actual net income for 2001 is calculated below.
Income before Taxes, Reported $2,393,000,000
Add Depreciation 83,306,818
Deduct Line Costs (3,055,000,000) Loss before Taxes, Restated (578,693,182) Add Income Tax Benefit 202,542,613 Add Minority Interest 35,000,000 Net Loss, Restated $(341,150,568)
39
Case Number Seven:
Targa Company: Answering Restructuring Questions Using the Codification Research System
For this case, we once again returned to the Codification Research System to find information, but this time it is related to restructuring. Targa Company is the company
that is talked about in this case, and more information about them can be found on the next page.
40
Targa Co. is discontinuing the development of a line in their business called Armor Track. Doing this will cause them to need to layoff many of their employees at one of their facilities, and this restructuring will also come with a relocation of a
manufacturing operation to a different area. The following information was determined from researching in the Codification Research System.
1. The termination plan the company is going to use involves terminating 120 out of their 140 employees at this one facility. The ten-week termination benefit is estimated to cost $2.5 million, and the normal two-week severance should cost
$500,000. This meets the criteria of being a one-time employee termination benefit based off ASC 420-10-25-4. ASC 420-10-30-6 says,
“If employees are required to render service until they are terminated in order to receive the termination benefits and will be retained to render service beyond the minimum retention period, a liability for the termination benefits shall be measured initially at the communication date based on the fair value of the liability as of the termination date.”
This tells us that the liability should be recorded on the communication date, and the fair value of the liability is equal to the numbers above since the time between the events is so short. Also, the facility manager gets a lump-sum of $50,000 when the facility closes. Based off ASC 715-30-25-10, this lump-sum should be recorded as a liability and then a loss when it is paid. ASC 715-30-25-10 says,
41
“An employer that provides contractual termination benefits shall
recognize a liability and a loss when it is probable that employees will be entitled to benefits and the amount can be reasonably estimated.”
These benefits should be put in the financial statements as a component of income from continuing operations. ASU 420-10-S99 supports this and says,
“Question 1: May such restructuring charges be presented in the income statement as a separate caption after income from continuing operations before income taxes…? Interpretive Response: No. FASB ASC paragraph 225-20-45-16 (Income Statement Topic) states that items that do not meet the criteria for
classification as an extraordinary item should be reported as a component of income from continuing operations.”
2. There will also be a relocation cost of $500,000, and a staff training cost of $1.5 million. Lastly, there are irrevocable contracts with other parties that will be relevant for the next eighteen months. Since these contracts will provide no economic benefit to the company, ASC 420-10-25-13 tells us that they should be put on the books at the “cease-use date” as a liability. The exact wording is,
“A liability for costs that will continue to be incurred under a contract for its remaining term without economic benefit to the entity shall be recognized at the cease-use date.”
42
The relocation costs are supposed to be recognized when they are incurred and not before even if they come directly from the termination plan. This comes from ASC 420-10-25-15 which says,
“The liability shall not be recognized before it is incurred, even if the costs are incremental to other operating costs and will be incurred as a direct result of a plan. A liability for other costs associated with an exit or disposal activity shall be recognized in the period in which the liability is incurred.”
43
Case Number Eight:
Merck & Company: Answering Questions About Stockholder’s Equity Using Selected Financial Information
This case focuses on stockholder’s equity, and it is about Merck & Company. More information about the company is below. The topics for the questions include common
shares, dividends, and treasury stock. Also provided is amounts and ratios for the company at year end.
44
Merck & Co. is a global pharmaceutical company that is listed on the New York Stock Exchange. They are research driven with the goal of improving human and animal health. Below is information and questions about their company from 2006 and 2007.
These questions were answered using the financial statements and other information given.
A. Consider Merck’s common shares.
a. How many common shares is Merck authorized to issue?
5,400,000,000
b. How many common shares has Merck issued as of December 31, 2007?
2,983,508,675
c. Reconcile the number of shares issued to the dollar value reported on the balance sheet.
(2,983,508,675) (.01) = $29,835,087
d. How many common shares are held in treasury at December 31, 2007?
811,005,791
e. How many common shares are outstanding at December 31, 2007?
2,983,508,675 - 811,005,791 = 2,172,502,884
45
f. If Merck’s stock price is $57.61 per share, calculate the total market capitalization of Merck on that day.
(2,983,508,675) (57.61) = $171,879,934,800
B. Why do companies pay dividends on their common shares? What happens to a company’s share price when dividends are paid?
It gives investors a return on their investment, and it shows them that the
company is doing well. Also, it could signal to the investors that the company has run out of growth opportunities, so they’re paying dividends instead of reinvesting that money into the company.
C. In general, why do companies repurchase their own shares?
There are many reasons companies might repurchase their own shares. One is that they feel the stock is undervalued, so they buy it low to resale it at a higher price.
Also, they might be trying to “privatize” the company to prevent a takeover by someone. Lastly, these companies could be trying to stimulate a fake demand for their stock by buying it back.
D. Prepare a single journal entry that summarizes Merck’s common dividend activity for 2007.
Retained Earnings 3,310,700,000 Dividends Payable 3,400,000
Cash 3,307,300,000
46
E. During 2007, Merck repurchased a number of its own common shares on the open market.
a. Describe the method Merck uses to account for its treasury stock transactions.
They use the cost method where the treasury stock is recorded at cost as opposed to par value.
b. How many shares did Merck repurchase on the open market during 2007?
26,500,000 shares
c. How much did Merck pay on average to buy back its stock during 2007?
In total Merck paid $1,429,700,000 which is $53.95 per share.
d. Why doesn’t Merck disclose its treasury stock as an asset?
Treasury stock is a contra-equity account, not an asset account. Also, you can’t have an economic benefit with your own stock, and that’s the definition of an asset.