Vol. 20, Issue 3, 2020, pp. 289–335, DOI: 10.2478/revecp-2020-0015
© 2020 by the authors; licensee Review of Economic Perspectives / Národohospodářský obzor, Masaryk University,
Financial Literacy, Behaviour and Well-Being of Millennials in Poland Compared to Previous
Generations: The Insights from Three Large-Scale Surveys
Andrzej Cwynar
1Abstract: There are many concerns about financial competences of Millennials. Initial research on this generation suggests that it is less financially knowledgeable and exhibits less healthy financial behaviours compared to other generations. The goal of the article is to compare Millennials to non-Millennials as a whole, as well as to other generations treated in isolation, to check whether Millennials diverge in terms of financial literacy, behaviour and well-being. To that end, this study uses three distinct datasets from three surveys conducted in 2017 and 2018 on different samples of Poles.
The applied statistic tests of significant differences do not confirm that Millennials diverge from other generations with respect to financial literacy as well as behaviours related to cash management, saving and investment. However, the surveyed Millennials perform significantly less healthy credit management and insurance behaviours compared to non-Millennials. We also found that Millennials report significantly higher levels of financial well-being compared to all previous generations.
Keywords: financial literacy, debt literacy, financial behaviour, financial well-being, Millennials
JEL codes: D14, D15, G51, G53
Received: 13 December 2019 / Accepted: 1 September 2020 / Sent for Publication: 9 September 2020
1. Introduction
The term “Millennials” refers to the generation that will soon have a pivotal influence on labour markets, financial markets and entire economies worldwide (EY 2015;
Kobler, Hauber, and Ernst 2015). On the one hand, financial outcomes of Millennials, both individual and aggregate, are contingent on their financial behaviour and related choices. On the other hand, it is well-documented that consumers’ financial behaviours – including Millennials – are strongly related to financial literacy, with more literate individuals performing more healthy behaviours across all domains of household financial management (see Stolper and Walter 2017 for a comprehensive overview).
However, the literature on the financial life of Millennials is often alarming as to both
1 Institute of Public Administration, Business and Management, University of Economics and Innovation, Lublin, Poland. ORCID: 0000-0003-2702-0397, [email protected]
their financial competences and their financial behaviour. Specifically, the literature indicates that Millennials are less financially literate and exhibit less healthy behaviours compared to previous generations (Kim, Anderson, and Seay 2019; Global Financial Literacy Excellence Center and PwC 2015) implying that, as a result, Millennials may struggle with poorer financial achievements next to other generations, including their parents (i.e., Baby Boomers).
To some extent, the Millennial gap in financial literacy and behaviours is understandable. Financial choices being made by young adults today are more challenging than they have been in the past (Lusardi and Oggero 2017), both in developed countries and in emerging markets. The challenges can be attributed to increasing individual responsibility for own financial fate (e.g., entailed by demographic trends and related shifts in pension systems), extremely complex financial products, and more precarious occupational status, just to mention a few. Much has been written about these aspects of the US Millennials’ financial living (e.g., Kim, Anderson, and Seay 2019; Friedline and West 2016; Simon and Houghton 2003). However, the issue is largely unexplored in Europe and, particularly, in Central and Eastern European countries (CEE, henceforward). Yet, as opposed to Western countries, there is a huge gap in these countries between Millennials and their parents (that is, Baby Boomers) in terms of life experiences shared by each of these generations. In CEE countries, Baby Boomers spent most of their lives in the world of deficits and centrally-planned economy. Their Millennial children know about this world only from stories or, in the worst case, from very early childhood experiences. Intergenerational differences seem to be particularly sizeable in this post-Soviet part of Europe.
The goal of this article is to examine financial literacy, behaviour and well-being of Millennials in Poland – one of the CEE countries – compared to previous generations, with particular reference to credit- and debt-related issues. We contribute to the existing literature in two ways. First, to our best knowledge, this is the first study on generational differences in financial literacy, behaviour and well-being in the CEE countries that uses such a rich dataset (more than 3,000 respondents, in total). Although the data do not allow to disentangle cohort effect from age effect, we believe that our findings are informative and robust, given that we used three distinct data sets obtained via three different large-scale surveys. The shift of focus from financial outcomes (assets, debt, wealth) of different generations to their financial behaviours gives us at least partial insight into intergenerational differences in the financial domain. Financial outcomes can be objectively and strongly constrained (e.g., income, assets or savings) or induced (e.g., debt) by factors being out of consumers’ control and, at the same time, closely linked to the stage of life-cycle (Modigliani and Brumberg 1954; Ando and Modigliani 1963). Behaviours seem to be a more appropriate foundation of cross-generational comparisons than outcomes. For instance, although it is clear that younger adults – for objective reasons – may have more difficulty in accumulating wealth and, as a result, they may exhibit lower savings relative to older birth cohorts, they are equally supposed to save from every paycheque – even small amounts – because this is a desirable financial behaviour regardless of age. Similarly, even though younger respondents are expected to be more active in the credit market (and, on average, to be more indebted due to the life-cycle patterns), the expectation that they are less likely to make, for instance, a ‘comparison shopping’ when looking for a loan is hardly warranted. Second, given that indebtedness seems to be an emblem of Millennials’ financial life (Hodson
and Dwyer 2014), in our study we paid particular attention to credit- and debt-related issues. Accordingly, we developed and applied a novel credit management behaviour scale to compare how Millennials and non-Millennials behave in this particular domain of household financial management.
We found that Millennials do not differ significantly from non-Millennials in terms of financial literacy, both actual and perceived, as well as concerning those financial behaviours that relate to wealth accumulation (savings and investment) and daily routine (cash management). However, Millennials report significantly less healthy credit management and insurance behaviours compared to non-Millennials. Despite this, the Millennial generation – relative to the others – is significantly more satisfied with its overall current financial situation. Given that previous empirical evidence suggests a strong positive relationship between not only financial literacy and financial behaviours (Behrman et al. 2012; Disney and Gathergood 2013; Hastings and Mitchell 2011; Van Rooij, Lusardi, and Alessie 2011; Yoong 2010), but also between financial literacy and financial satisfaction or well-being (Xiao and Porto 2017; Xiao, Chen, and Chen 2014), the disparity in credit management and insurance behaviours – as well as in financial well-being – between Millennials and non-Millennials must be attributed to factors that are different from financial literacy. We show that some personal (psychological) characteristics may be responsible for the dissimilarity. This implies that to enhance some financial behaviours through policy interventions, the Millennials’ specificity in terms of psychological disposition needs to be taken into account.
2. Literature review Theoretical framework
On the one hand, this work is interdisciplinary and locates primarily at the intersection of economics and sociology. On the other hand, the work is mostly descriptive, and it does not aim to examine a theory-derived relationship or, even more, the causality of a relationship. It focuses, instead, on the significant intergenerational differences in financial literacy, behaviour and well-being. For these reasons, it was difficult to embed the work within a theoretical framework, particularly a single one. We assumed that the appropriate conceptual basis to pursue the goal of this article on the ground of economics is the model proposed by Huston (2010). The model considers financial literacy, financial behaviour and financial well-being as key elements of an overarching model explaining how consumers acquire financial competences, how these competences translate into downstream financial actions, and how these actions determine financial well-being of individuals. Treated collectively, these three variables – financial literacy, financial behaviour and financial well-being – provide a broad perspective on the financial life of Millennials compared to other generations. For this reason, the model of Huston (2010) has been selected as the adequate conceptual framework even though the analyses conducted in this article do not examine the links between financial literacy, behaviour and well-being.
The model of Huston (2010) is a conceptual framework. Huston (2010) provides a conceptual definition of financial literacy, along with conceptual proposition of how it relates to financial behaviour and well-being, but the article doesn’t operationalise any
of these concepts. For this reason, to measure financial literacy (as well as financial behaviour and well-being) we applied both: the instruments known from previous empirical studies and the self-designed instruments (they are described in the relevant Methods sections of this article). The assumed underlying order in the model of Huston (2010) is that to attain financial well-being, an individual must first acquire financial literacy and then to apply the knowledge and skills constituting the literacy. In this model, financial literacy is a prerequisite of healthy financial behaviours, though it is not the only factor shaping the behaviours. In turn, financial well-being is treated as the ultimate outcome of financial education and self-improvement.
The model of Huston (2010) is embedded in the human capital theory that was first formalised by (Becker 1962). The theory perceives financial literacy as a domain- specific human capital that requires an investment. In light of the theory, human capital is reflected in the individual resources of knowledge and skills and can be multiplied – through education or experiences, for instance – to increase the return on this peculiar form of capital. For the first time, financial literacy has been investigated on the grounds of human capital theory by Delavande, Rohwedder, and Willis (2008). The simple two- period model of financial literacy acquisition proposed by Delavande, Rohwedder, and Willis (2008) was later developed into more complex multi-period models by Jappelli and Padula (2013) as well as by Lusardi, Michaud, and Mitchell (2013). Given that both these models allow for changes in financial literacy in accordance with the life cycle stages, one may assume that the suitable, though very broad, theoretical foundation for financial literacy studies is the well-known life-cycle hypothesis (Modigliani, and Brumberg 1954; Ando and Modigliani 1963). The hierarchical relations among financial literacy, financial behaviour and financial well-being are also modelled theoretically (and verified empirically) by Shim et al. (2010) and Xiao et al. (2011) at the intersection of economics, psychology and sociology.
This article assumes that financial behaviour reflects how consumers transact in financial markets. There is a consensus in the literature as to what should be deemed healthy (desirable) financial behaviour (Dew and Xiao 2011). This also applies to debt- related behaviour – an issue exposed in this article. Specifically, by debt behaviour we mean how individuals borrow (i.e., for what purposes they borrow, do they make a
‘comparison shopping’ when looking for a loan, are they late when paying off their debts, etc.), assuming that such debt behaviour – as the behaviour in any other life domain – may be more or less desirable (see also Cwynar et al. 2019a).
On the grounds of sociology, this study relates to the concept of technological culture (Bijker 2001, 2006), which can be defined as the expression of all the modes through which individuals and societies appropriate technology (Godin and Gingras 2000). In light of this definition, technology filters through all aspects of culture, including norms and values, and has the power to shape generational identity and individual personality.
Intergenerational differences in the available technology may result in significant divergencies between different generations in their formation in terms of norms, values, and needs. In the past, both parents and children were raised within a similar technological environment. The generation gap and resultant generational conflict involved different generations having different views on, after all, essentially the same values. However, modern societies are predominantly shaped by technology (Guggenheim and Nowotny 2003), and rapid technological development resulted in
children being raised nowadays in completely different technological setting compared to their parents. As a consequence, children rarely rebel against their parents’ values today, because these values are quickly losing relevance for the youngest generations (Szlendak 2019). The issue of shifting values is highly debated nowadays in the context of post-modernism (Marody 2014). For instance, a striking feature of the youngest generations that mark them out is their attitude to work. A lot has been written about the alleged millennial lack of commitment to a job, deficits in responsibility and loyalty, as well as about the entitlement attitude. These characteristics may result from the pressures technology exerts on the millennial generation. The modern agora for this generation is the internet with a plethora of virtual and digital spaces, such as YouTube or Instagram, which socialise them more than any other socialisation agent. To an unprecedentedly high extent, the looking-glass self (or ego) of young adults is nowadays shaped by reactions of their peers that are shared in the digital world. This peculiar environment trains the individuals to assess their activity – or the lack of thereof – through a filter of a fast feedback and related pleasure. If an action fails the test of pleasure, then the outcome is a quick withdrawal from the activity. The attitude to employment and work can be easily explained in this particular framework:
performing the professional duties is appreciated only as long as it brings pleasure.
Given the goal of this article, we expect that the same mechanisms related to cross- generational differences in technological culture may explain, at least to a degree, the differences in financial behaviour between generations. For instance, in the contemporary environment of pleasure-seeking and instant gratification, money may be perceived instrumentally as a leverage of present-biased financial behaviours – perhaps unconsciously performed – aimed at achievement of fast satisfaction contingent on the verdict of one’s social network in the virtual world.
Sociodemographic status of Millennials
In this article, we define a generation as all individuals – considered collectively – born and living at approximately the same time, who are shaped by the same socio-historical events (Pilcher 1994; Wiktorowicz et al. 2016). Defined in this way, generation incorporates individuals who share common thoughts, values, and experiences – mainly in cultural terms. As a result, the individuals have similar motivations, attitudes and behaviours.
The term ‘Millennials’ was introduced to the literature by Strauss and Howe (1991) to name a generation of Americans who came of age around the turn of the 21st century.
Millennials are one of the five generations currently living – next to the Silent Generation, Baby Boomers, Gen X and Gen Z.2 In social sciences, a generally accepted span of birth years of Millennials does not exist. Different authors use different ranges of birth years to define Millennials, both in the Western and the Polish literature.
2 Millennials are often referred to as ‘generation Y’ (de Bassa Scheresberg and Lusardi 2014;
Kobler, Hauber, and Ernst 2015; Lusardi and Oggero 2017). Accordingly, generation Z is considered as a birth cohort following Millennials. However, some authors (e.g., Wiktorowicz et al. 2016) equate generation Z with younger Millennials (while generation Y is equated with older Millennials). Due to their extremely small population, we do not distinguish the Great Generation (i.e., those born before the Silent Generation) in this article.
Generally, the research on Millennials assumes that the generation includes individuals born between the beginning of the 1980s and the end of 1990s. Nevertheless, the differences between definitions used in the literature that focuses on this generation’s financial life are sometimes large (see Moreno et al. 2017 for comparison). Given that there is no official set of birth years to distinguish Millennials from other generations in Poland, this study adopts the definition of the US Census Bureau. In this definition, the birth years that mark the start and the end of the Millennial generation are 1982 and 2000 (i.e., Millennials are individuals between 20 and 38 years of age in 2020). Also, the US Census Bureau definitions were used in this article to distinguish other generations (Gen X – born between 1965 and 1981; Baby Boomers – born between 1946 and 1964; Silent Generation – born 1945 and earlier).
Obviously, socio-cultural specificity of a country may make the span of birth years used to distinguish generations incomparable to other countries. Differences in this regard are likely to occur between the Western countries, including the US, and the CEE countries, including Poland, due to different socio-economic inheritance of the 75 post-war years.
However, it is argued that the differences between countries in the way the same generations are defined are the least with regard to the youngest generations, including Millennials (Wiktorowicz et al. 2016). These generations are the most globalised and unified through the internet and social media.
In the US, Millennials became the largest generation in 2015 (Y. Chien and Morris 2018) and, at the same time, the largest generation in US history (de Bassa Scheresberg and Lusardi 2014; Kim, Anderson, and Seay 2019; Fair Isaac Corporation 2014) with the number of individuals within the range of 70 to 80 million, depending on the source (de Bassa Scheresberg 2013; Yakoboski and Lusardi 2018; Fair Isaac Corporation 2014). This accounts for approximately 30% of the US entire population. In Poland, the share of Millennials in the total population reaches almost 30%, which equates to about 11 million (NEWSERIA News Organization 2016). The share is comparable in other CEE countries (Mazur-Werzbicka 2016). In terms of sociodemographic variables, the US Millennials have higher educational attainments, are more racially diverse, and are more likely to defer marriage and children compared to members of earlier generations (Kurz, Li, and Vine 2018; Global Financial Literacy Excellence Center and PwC 2015).
They also delay transitioning from financial dependence to independence (Xiao, Chatterjee, and Kim 2014) and, as a result, to adulthood, given that independence in financial terms is deemed a marker of being an adult (Arnett 2000). The sociodemographic characteristics of Millennials in Poland are similar (Wiktorowicz et al. 2016).
The common experiences shared by Millennials are mainly related to the internet, digital revolution and globalisation. Due to extreme comfort with technology, Millennials are commonly referred to as the first ‘digital natives’ (Thompson and Blomquist 2017; Haefele, Smiles, and Carter 2017; Barton, Fromm, and Egan 2012).
Relative to previous generations, Millennials are also more connected in terms of social networks, mainly online (Barton, Fromm, and Egan 2012). This is also the first generation comprising individuals who were raised in a society of rapidly improving status of children – their expectations, their needs, but also their wants. As a result, Millennials are characterised as having unprecedentedly high self-esteem, confidence,
optimism, and aspirations (Lusardi and Oggero 2017; Edelman 2018; de Bassa Scheresberg and Lusardi 2014).
The literature indicates that there are many stereotypes regarding Millennials, presumably more than about any other generation (Barton, Fromm, and Egan 2012;
Robson and Loucks 2018; CBRE 2016). Millennials are often referred to as ‘lazy’,
‘spoiled’, ‘entitled’, ‘narcissistic’ or ‘technologically obsessed’ by the members of earlier generations (Haefele, Smiles, and Carter 2017; Barton, Fromm, and Egan 2012;
CBRE 2016). However, many of these features – if not all of them – are age-specific instead of being generation-specific. The features are shared by all young individuals, and they elapse as the individuals grow older (Robson and Loucks 2018; CBRE 2016).
Among many, often stereotypic, features of Millennials, the irresistible need for instant gratification deserves closer attention (de Bassa Scheresberg and Lusardi 2014). Barton, Fromm, and Egan (2012, p. 6) point that ‘the US Millennials are all about instant gratification’ and that they are characterised by the attitude ‘I want it fast, and I want it now’. Nielsen, a transnational corporation, described Millennials as #we, #more, #now (NEWSERIA News Organization 2016). ‘Now’ relates to the phenomenon known as
‘fear of missing out’ (FOMO) – overwhelming anxiety that something exciting may be happening elsewhere. This may entail impatience and, consequently, less resistance to wants.
The economic and financial status of Millennials
In terms of financial outcomes, the US Millennials have low incomes and low, even minimal, wealth (Global Financial Literacy Excellence Center and PwC 2015; Kim, Anderson, and Seay 2019; Mottola 2014; Hodson and Dwyer 2014). This comes as no surprise in light of the life-cycle hypothesis (Ando and Modigliani 1963; Modigliani and Brumberg 1954), which posits that both low income and the lack of wealth are objective indicators of the initial life stage. However, Kurz, Li, and Vine (2018, abstract) report that ‘Millennials are less well off than members of earlier generations when they were young, with lower earnings, fewer assets, and less wealth’. This suggests that American Millennials are at a financial disadvantage compared to previous generations. It is argued that the disadvantage emerges as a consequence of the Great Recession (e.g., economic prospects worse than those of other generations at the time they were entering the labour market, including higher unemployment and lower wages, as well as rapid increases in costs of higher education) (Kim, Anderson, and Seay 2019;
Mottola 2014; Y. Chien and Morris 2018). Although there is no data comparing Millennials’ and non-Millennials’ incomes and wealth at the same life stage in Poland, it is indicated that the hallmark of the Polish Millennials’ circumstances is precarity – that is, the overwhelming experience of insecure and uncertain occupational status (Andrejczuk 2017). This renders Polish Millennials similar to their US counterparts.
The US Millennials display a low, or medium at best, level of financial literacy (National Endowment for Financial Education 2016), which is even lower compared to earlier generations (Yakoboski and Lusardi 2018; Kobler, Hauber, and Ernst 2015;
Global Financial Literacy Excellence Center and PwC 2015). For instance, in Yakoboski and Lusardi (2018), Millennials answered 44% of the financial literacy test questions correctly, on average. For comparison, the average result among the US adults
reached 50%. Gen Xers and Baby Boomers also fared better in the test, on average (49% – Gen Xers; 55% – Baby Boomers). The only study that compares Millennials to other generations in terms of financial literacy in Poland (Defratyka and Morawski 2018) reports that the younger the generation, the more likely to answer the literacy test question incorrectly. However, the results of the study should not be overestimated, because the surveyed respondents were asked only one question.
There is a lively debate in the literature regarding the effect age has on financial literacy. A growing body of academic opinion tends to believe that the relationship between these two variables resembles an inverted U-curve, at least in Western economies (see, for instance, the following cross-national studies: Atkinson and Messy 2012; Roa, Garrón, and Barboza 2019; Kadoya and Khan 2019; Karakurum-Ozdemir, Kokkizil, and Uysal 2019; Nicolini, Cude, and Chatterjee 2013). This could suggest that, generally, financial literacy is low at a young age regardless of the generation.
However, the evidence from other studies and, especially, from developing countries as well as emerging economies (including CEE states), suggests that the inverted U-shaped pattern may not be universal (Cwynar, Cwynar, and Wais 2019). In some of these studies positive relationship has been established (Alhenawi and Elkhal 2013;
Yakoboski, Lusardi, and Hasler 2018; Xiao, Chen, and Sun 2015; O’Connor 2019), while other found a negative association between age and financial literacy (Klapper, Lusardi, and Van Oudheusden 2015; Klapper and Panos 2011; Cwynar et al. 2019b).
These inconclusive results may indirectly imply a role for generation-specific factors in explaining financial literacy heterogeneity across generations.
The issue of age having an impact on financial literacy is particularly important given the matter of concern assumed in this article. Age and generation are intrinsically interrelated. As a result, what is often taken as an impact of age can equally be the generation-specific effect, better known as the cohort effect in the literature (Schulhofer-Wohl and Yang 2011). To avoid misinterpretations, these two effects should be disentangled. However, only a few recent studies on financial literacy implemented procedures allowing for such decoupling of cohort effect from pure age effect (Gamble et al. 2015; Finke, Howe, and Huston 2017). This comes as no surprise given that cohort effect can be isolated from age effect due to addressing the same questions to (optimally the same) respondents at different stages of their lives. Such longitudinal studies are still rare, especially when no national-wide surveys conducted on a regular basis are implemented. This kind of longitudinal data is missing in Poland, too. For this reason, the findings of this article must be interpreted with caution given that the underlying data did not allow to disentangle cohort effect from age effect.
De Bassa Scheresberg and Lusardi (2014) report that there is a disparity between actual and perceived financial literacy among American Millennials who are very confident about financial knowledge they possess. 69% of respondents rated themselves at least 5 on a 1-7 scale of self-assessed financial knowledge, confirming that they believe their financial knowledge is high. At the same time, 74% of the survey participants reported agreement with the statement ‘I am good at dealing with day-to-day financial matters, such as checking accounts, credit and debit cards, and tracking expenses’ (de Bassa Scheresberg and Lusardi 2014). Thompson and Blomquist (2017) add that majority of Millennials may hold elevated opinions of their financial competences: 64% of the
Millennial respondents felt they understood their holdings and investments as well as a professional.
The literature is inconclusive with regard to financial outcomes of the US Millennials as well as on their financial behaviour in general (Y. Chien and Morris 2018). Friedline and West (2016) report that 35% of Millennials save for an emergency, while nearly 60% have a retirement account (National Endowment for Financial Education 2016). De Bassa Scheresberg and Lusardi (2014) contend that 88% of them have either a checking account or a savings account, while 51% have a retirement account. In the study of Kim, Anderson, and Seay (2019) 41% of participating Millennials had an emergency fund, while 47.4% had at least one retirement account. Mottola (2014) provides a comparison of Millennials with earlier generations in terms of saving outcomes. 33% of Millennial respondents have rainy day funds, which is slightly more than among Gen Xers and significantly less than among Baby Boomers and Silent Generation. Only about 40% of the surveyed Millennials (which is significantly less compared to any of the previous generations) report saving for retirement. Kurz, Li, and Vine (2018) compared retirement savings of Millennials with those of Gen Xers at the same point in the life when the Gen Xers were of comparable age. The comparison revealed, somewhat surprisingly, that Millennials saved more (in terms of the amount put aside), which partly reflects the transition from defined-benefit retirement plans to defined- contribution retirement plans. Y. Chien and Morris (2018) showed that Millennials display a higher propensity to save for retirement compared to Gen Xers. The same has been documented in Poland. Defratyka and Morawski (2018) compared three generations (Gen Xers, older Millennials, labelled as ‘generation Y’, and younger Millennials, labelled as ‘generation Z’) and showed that the younger the generation, the greater percent that reports having a savings fund, although the magnitude of average savings funds increases for older generations. The Credit Information Bureau (2014) confirms these patterns, adding that about 45% of Millennials reported that they were saving. Kim, Anderson, and Seay (2019) report that about 30% of surveyed Millennials had an investment outside their retirement accounts, while de Bassa Scheresberg and Lusardi (2014) indicate that the share of those in the Millennial generation who have investments in stocks, bonds, or mutual funds is one-fourth.
The key marker of Millennials’ financial life is indebtedness – often unsustainable.
National Endowment for Financial Education (2016) reports that the share of American Millennials who have at least one long-term debt exceeds 70% (34% have more than one long-term debt). The share is even larger among the best-educated Millennials.
According to the Global Financial Literacy Excellence Center and PwC (2015), 81% of college-educated Millennials have at least one long-term debt. Kurz, Li, and Vine (2018) show that Millennials took on more debt than their parents – i.e., the members of Baby Boomer generation – during the same, initial stages of their adult lives. Y. Chien and Morris (2018) report that in 2016 Millennials – compared to Gen Xers in 2001 – were slightly more indebted on average, with a larger amount of student loans, but less amount of mortgages and credit card debts. Hodson and Dwyer (2014) show not only that Millennials are more indebted compared to Gen Xers at the same point of life, but also that the structure of Millennials’ debts is worrying. Specifically, Millennials have more non-collateralised debts (including consumer loans and student loans) and fewer mortgages compared to other generations. Mottola (2014) reports that non-banking (i.e., more costly) borrowing is fairly common among Millennials. They heavily rely on
alternative financial services (AFS). Over one-third of the Millennial generation use this kind of expensive financing (National Endowment for Financial Education 2016), in spite of their relatively high educational attainment. In the study of Friedline and West (2016), the share is even larger, reaching 44%. Millennials often apply for AFS even if they have a bank account or credit card (de Bassa Scheresberg and Lusardi 2014).
Nearly 30% of Millennials are overdrawing on their chequing accounts, while over 20%
of those who have retirement accounts took loans or made hardship withdrawals in the past year (Global Financial Literacy Excellence Center and PwC 2015). It is also evidenced that Millennials use credit cards in ways that generate high costs (de Bassa Scheresberg and Lusardi, 2014). Ultimately, they struggle slightly more than previous generations to pay their bills and meet their financial obligations (Mottola 2014). All in all, debt became an identification mark of Millennials in the US – the truth that has been well summarised by Hodson and Dwyer (2014, p. 3): ‘for young Americans, the transition to adulthood, is a transition to holding debt’.
To a large extent, the reliance of American Millennials on credit – including their toxic relations with loans – can be explained by the conditions of the US financial market and the whole economy at the turn of 2000s and 2010s. Three events need to be indicated here as key sources of economic pressure to take on debt. First, the typical economic nuisances of the initial stage of the life-cycle – that is, low incomes and meagre wealth – were compounded by weak macroeconomic performance in the years following the Great Recession (being the same years Millennials were entering the labour market).
Second, the access to credit was made considerably easier during the same years due to both the historically low-interest rates and the development of financial services, including services alternative to banking. Third, financial services offered to households became unprecedentedly complex for young, unexperienced adults to navigate.
The economic circumstances of Millennials in Poland differ in many respects from those of American ones. Poland avoided the economic downturn in the aftermath of the latest global crisis. As a result, Polish Millennials were entering the labour market and their family lives more smoothly compared to their American counterparts.
Additionally, Poland belongs to countries where the ratio of household debt to GDP is relatively low, and the dependence of the household sector on credit is significantly lower compared to the US (Morawski and Wieczorek 2018). In particular, as opposed to young adults in the US, Polish Millennials were coming of age in an economy with much less prevalent credit card usage (Milleninum Bank 2016 – about 25% in Poland;
Edelman 2018 – about 68% in the US) and, most of all, much less costly access to tertiary education (Polish Bank Association 2018). Generally, full-time studies at state (public) universities in Poland are free of charge. The tuition at extramural studies (as well as at non-public universities) depends on the major and ranges from ca. 1,000 to 3,000 euro annually. As a result, student loans are not very popular in Poland. To put it into perspective, 398,000 student loans were granted in 1998-2017 (Ministry of Science and Higher Education 2018), while the number of students reached 1,291,900 only in 2017 (Polish Bank Association 2018).
Nevertheless, the Credit Information Bureau (2014) indicates that 46% of the Millennial generation in Poland took on at least one credit or loan. However, 25% of those who have never been in debt justify this with a lack of creditworthiness. Additionally, the share of debtors increases with age. A large majority (79%) of Polish Millennials
borrow from banks (Credit Information Bureau 2014). 19% reported that they borrow because of temporary financial problems. The same percentage indicated that they borrow because of a lack of funds for basic necessities. Statistics also show that among all age groups in Poland, the fastest growth in outstanding debts during 2013-2018 was observed in the cohort of young adults – those who approximately comprise the Millennial generation. Specifically, these debts increased 3.3 times in the 26-35 age group, and as much as almost 15 times in the 18-25 age group. At the same time, the number of delinquent debtors rose by 25% and 437% for these groups, respectively (Defratyka and Morawski 2018). Surprisingly, younger Millennials (labelled
‘generation Z’ by Defratyka and Morawski 2018), compared to both the older Millennials (labelled ‘generation Y’) and the Gen Xers, are less likely to borrow to finance entertainment and fun purposes. However, the youngest generation has the largest problems in repaying debt. Generally, 36% of all Millennials failed at least once to pay off a bill (in this group, 10% failed to pay a loan instalment, while 8% failed to pay a credit instalment; 6% failed to pay off a credit card debt).
The data on the US Millennials’ propensity to seek financial advice is mixed. Global Financial Literacy Excellence Center and PwC (2015) reports that only 27% of surveyed Millennials are seeking professional financial advice on saving and investment. Kobler, Hauber, and Ernst (2015) established that 84% of Millennials seek financial advice, despite that they are sceptical about the advisors. In the 2018 edition of the Edelman study (Edelman 2018), 25% of surveyed Millennials reported having a personal financial planner/advisor, while 12% had a robo-advisor for financial advice.
Millennials are visibly more inclined to consider technology as an important feature of financial advice. Thompson and Blomquist (2017) report that 67% of Millennials, compared to 30% of Gen Xers and Baby Boomers, want computer-generated recommendations (robo). Barton, Fromm, and Egan (2012) indicate that Millennials, compared to earlier generations, also have a different view of an ‘expert’. For them, peers or close friends who have had first-hand experience may be more appreciated advisors than someone with professional or academic credentials. The increasing role of peers, who act as an advisor in the first instance in financial consultations of Millennials, is also underlined by Kobler, Hauber, and Ernst (2015).
The evidence about the financial well-being of American Millennials is mixed. In the study of Global Financial Literacy Excellence Center and PwC (2015), 34% of them reported – on a scale of 1 to 10 – that they were very unsatisfied (1 – 3 on the scale) with their current financial situation. 18% were not at all satisfied (1 on the scale).
Friedline and West (2016) report that the average level of satisfaction on a scale from 1 to 10 reached 5.115 in the sample of n=6,865 US Millennials. Taylor and Keeter (2010) show that 31% of US Millennials say they earn enough money to lead the kind of life they want, compared to 46% for Gen Xers and 52% for Baby Boomers. However, Mottola (2014) indicates that the share of respondents who are satisfied with their personal financial situation is similar across generations: it reaches 23% for Millennials, compared to 17% for Gen Xers, 25% for Baby Boomers, and 42% for Silent Generation. At the same time, 51% of the US Millennials feel that they have too much debt (National Endowment for Financial Education 2016).
In the next section, we provide details on three studies from which we retrieved data to compare Millennials to non-Millennials in terms of financial literacy, behaviour and well-being.
3. Study 1: Purposive sample of Facebook users who participated in the credit market
Methods
Data and participants
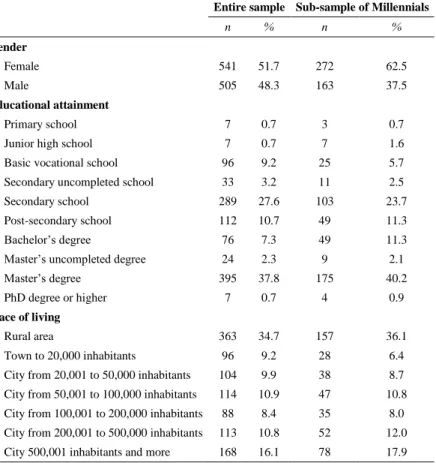
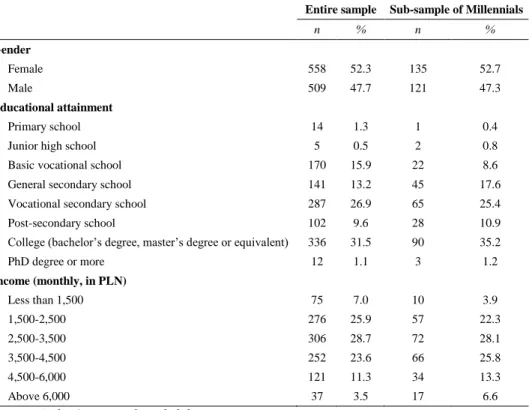
The data were collected through Computer-Assisted Web Interviewing (CAWI) from a purposive sample of 1,055 Facebook users in Poland who participated in the credit market in the last five years. The survey was fielded during the period of 28 May – 6 June 2017 through the online panel provided by Pollster Institute – a professional market and opinion research agency. There are more than 89,000 panellists enrolled on this platform. Sociodemographic composition of the sample has been adjusted to correspond to the distribution of key characteristics (gender, age, education, place of residence) of the entire Polish population. Nevertheless, due to problems with the information sources needed for the sampling frame of credit holders from Poland active on Facebook, we were constrained to the non-probabilistic selection of respondents to our research. As a consequence, results cannot be generalised to the whole population of credit holders in Poland. Table 1 compares the distribution of selected sociodemographic traits in the sample and in the subsample of Millennials. The sample composition in each of the three studies analysed in this article vis a vis the composition of the entire Polish population is demonstrated in Table 20 in the Appendix.
In all three studies – including study 1 – we followed the US Census Bureau in defining Millennials in terms of a span of birth years, as individuals born between 1982 and 2000 (we also adopted the definitions of the Bureau when selecting other generations from our sample – Gen X (1965-1981), Baby Boomers (1946-1964) and Silent Generation (born 1945 and earlier)).
Measures Financial literacy
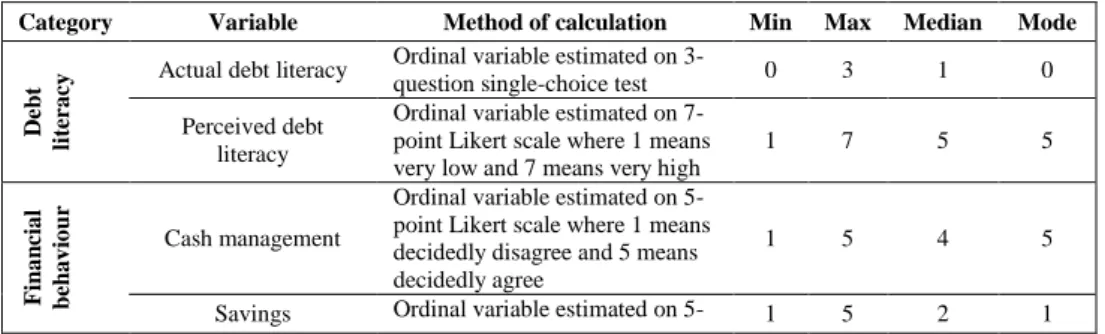
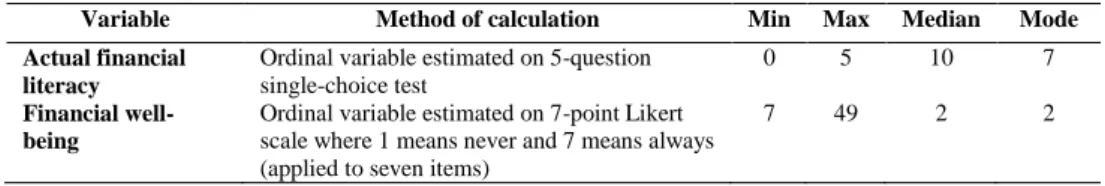
Table 2 reports the key characteristics of all variables used in study 1. Generally, in this article, we define financial literacy as ‘knowledge of basic economic and financial concepts and the ability to use that knowledge and other financial skills to manage financial resources’ (Hung, Parker, and Yoong 2009, p. 12). However, in study 1 we focused on debt literacy – a little aspect of financial literacy – and on debt-related behaviour. More specifically, in study 1 it is assumed that financial literacy in debt- related domain reflects consumers’ knowledge of basic concepts regarding credits, loans and borrowing, as well as their ability to apply the knowledge in the debt-related domain. We measured debt literacy in two ways – through a test and through self- reports. We used the nomenclature proposed by Allgood and Walstad (2016) to name these two measurement instruments – that is, actual and perceived debt literacy, respectively. Actual debt literacy was measured with the instrument designed by
Lusardi and Tufano (2015) being a three-question, single-choice test. Lusardi and Tufano (2015) indicate that this test concentrates on three debt-related competencies: (i) the comprehension of interest compounding, (ii) the knowledge of how to pay off credit card effectively, and (iii) the understanding of the time value of money concept (the exact wording of the questions is provided in the Appendix). Correct answers were coded as 1 while all remaining options (incorrect answers, ‘Don’t know’ responses and
‘Prefer not to answer’ responses) were coded as 0. Hence, the actual debt literacy index ranged between 0 and 3 in value.
Table 1. Study 1: Sample composition in terms of main sociodemographic variables
Entire sample Sub-sample of Millennials
n % n %
Gender
Female 541 51.7 272 62.5
Male 505 48.3 163 37.5
Educational attainment
Primary school 7 0.7 3 0.7
Junior high school 7 0.7 7 1.6
Basic vocational school 96 9.2 25 5.7
Secondary uncompleted school 33 3.2 11 2.5
Secondary school 289 27.6 103 23.7
Post-secondary school 112 10.7 49 11.3
Bachelor’s degree 76 7.3 49 11.3
Master’s uncompleted degree 24 2.3 9 2.1
Master’s degree 395 37.8 175 40.2
PhD degree or higher 7 0.7 4 0.9
Place of living
Rural area 363 34.7 157 36.1
Town to 20,000 inhabitants 96 9.2 28 6.4
City from 20,001 to 50,000 inhabitants 104 9.9 38 8.7 City from 50,001 to 100,000 inhabitants 114 10.9 47 10.8 City from 100,001 to 200,000 inhabitants 88 8.4 35 8.0 City from 200,001 to 500,000 inhabitants 113 10.8 52 12.0 City 500,001 inhabitants and more 168 16.1 78 17.9 Source: Author’s own study and elaboration
Respondents were also asked to self-report on their perception of the degree to which they are knowledgeable in debt-related domains. Specifically, perceived debt literacy came from the survey item that asked: ‘On a scale of 1 to 7, where 1 means very low, and 7 means very high, how would you assess your debt knowledge?’ This question preceded test of actual debt literacy.
Financial behaviours
In this article, by financial behaviour, we mean how individuals act when confronted with financial matters – from those related to daily routine and to the long-term and sizeable in terms of amounts involved – assuming that such ‘financial behaviour’ – as the behaviour in any other domain – may be more or less unhealthy (unbeneficial, unsustainable, undesirable). For instance, in this article credit management behaviour reflects how consumers transact in debt markets or, in other words, how they borrow (i.e., for what purposes they borrow, do they make a ‘comparison shopping’ when looking for a loan, do they pay off debts timely, etc.)
The questionnaire used in study 1 contained a series of questions allowing us to infer about a range of respondents’ financial behaviours. The following survey items were used to gather data on cash management, savings and investment behaviours, respectively: (i) ‘I compare prices before I decide to purchase a product’, (ii) ‘I have a term deposit(s) in a bank or in other financial institutions’, (iii) ‘I put some money aside for retirement’. The responses were measured on a 5-point Likert scale where 1 meant
‘Decidedly disagree’ and 5 meant ‘Decidedly agree’. We also applied two binary questions (1=Yes; 0=No; respondents were also allowed to refuse to answer these questions) regarding debt behaviour. The questions were as follows: (i) ‘Have you ever got into arrears?’, (ii) ‘Have you ever been a subject to a loan collection process?’
The questionnaire also included two items on credit- or debt-related help-seeking behaviour of surveyed individuals. First, they were asked if they sought credit- or debt- related advice from an expert: ‘In the last 5 years, have you asked for any advice from a professional about any of the following: (a) a credit choice, (b) legal aspects of a contractual credit agreement, (c) debt counselling?’ For each of these three specific behaviours, a binary variable indicator was created (1=Yes; 0=No). Second, we asked the survey participants to report any individual social capital resources made available as a help, a support or a form of assistance that can be received from family, friends or acquaintances. The variable – labelled as ‘Network resources’ – was measured with the following ‘Yes/No’ question: ‘If you were in need, would there be someone you could turn to for help on the following matters: (a) Borrowing several thousand PLN? (b) Escaping the vicious circle (spiral) of debt? (c) Temporarily sharing a flat or a house?
(d) Contacting a financial/credit advisor? (e) Recommending a credit product? (f) Recommending how to invest funds? (g) Help in the evaluation of credit contractual agreements? (h) Help in reducing the indebtedness? (i) Bringing a claim against a lending institution?’ The question was asked separately in relation to family, friends and acquaintances. As a result, the variable ‘Network resources’ ranged from 0 to 27 in value (Yes=1, No=0). The variable has been designed to refer to the Resource Generator – a well-known questionnaire aimed at probing social capital embedded in personal networks (Van Der Gaag and Snijders 2005).
Financial well-being
In this article, we followed the view that financial well-being is a component of general well-being and, as such, can be defined as a ‘state of being healthy, happy, and free of financial worries’ (Joo and Grable 2004, p. 27). We used a diversified range of instruments to measure financial well-being in the three studies we refer to in this
article. In study 2, we adopted the Financial Anxiety Scale (Archuleta, Dale, and Spann 2013) as a proxy for financial well-being. In study 3 we applied a more direct indicator of financial well-being: a single question tool that is widespread in the relevant literature (Shim et al. 2010; Plagnol 2011; Robb, Babiarz, and Woodyard 2012;
Archuleta, Dale, and Spann 2013; Hunter and Heath 2017). However, in study 1 we applied the following question introduced by Lusardi and Tufano (2015) as a proxy for the satisfaction with current debt load: ‘Which of the following best describes your current debt position? (i) I have too much debt right now, and I have or may have difficulty in paying it off, (ii) I have about the right amount of debt right now, and I face no problems with it, (iii) I have too little debt right now. I wish I could get more, (iv) I just don’t know’. If financial well-being reflects, among others, a lack of financial worries, then a respondent who reports having too much debt must experience a financial strain and, presumably, resultant worry.
Other measures
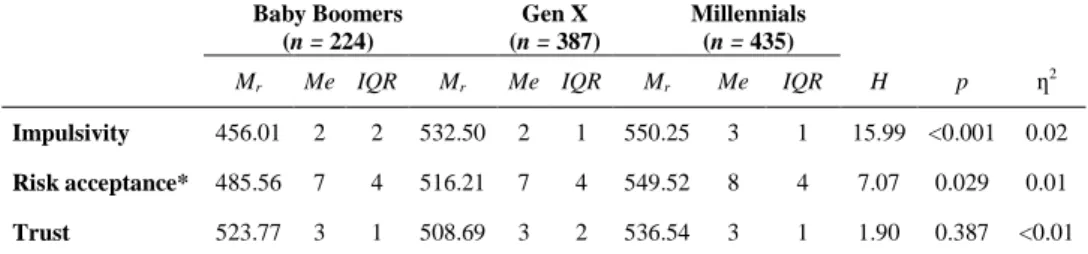
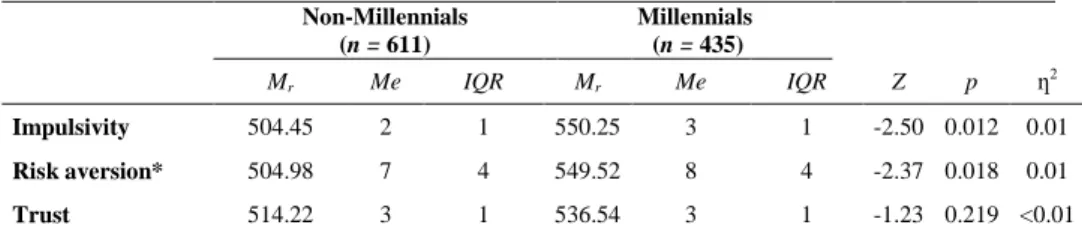
We applied several additional survey items allowing us to learn the financial behaviour- relevant attitudes and psychological dispositions (personality traits). First, we collected self-reports on impulsivity in buying (these reports can be alternatively used as a marker of materialism), which may trigger excessive borrowing. The variable, labelled as Impulsivity, was measured by confronting the respondents with the following statement and asking them to state if they agree or disagree on a 1–5-point scale: ‘I buy goods under the influence of advertisements’. Second, three survey items were used to capture risk aversion: (i) ‘Life without risk is boring’, (ii) ‘I often exceed the speed limit’, (iii) ‘I visit dangerous places and countries’. Again, respondents were to express their agreement or disagreement. Third, we confronted respondents with a statement allowing them to reveal their trust towards lending institutions: ‘I do not trust lending institutions’.
Tests and analyses
Using the variables described in the section ‘Measures’, in all three studies demonstrated in this article Millennials were first compared to the remainder of the entire sample (that is, to ‘non-Millennials’). A Mann-Whitney U test was used to conduct the comparisons. Then, Millennials and all other generations (i.e., Gen Xers and Baby Boomers) were compared peer-to-peer using the H Kruskal Wallis test. A chi- squared test was used for comparisons of non-ordinal variables.
Table 2. Definitions and descriptive statistics of the variables used in study 1
Category Variable Method of calculation Min Max Median Mode
Debt literacy Actual debt literacy Ordinal variable estimated on 3-
question single-choice test 0 3 1 0
Perceived debt literacy
Ordinal variable estimated on 7- point Likert scale where 1 means very low and 7 means very high
1 7 5 5
Financial behaviour
Cash management
Ordinal variable estimated on 5- point Likert scale where 1 means decidedly disagree and 5 means decidedly agree
1 5 4 5
Savings Ordinal variable estimated on 5- 1 5 2 1
point Likert scale where 1 means decidedly disagree and 5 means decidedly agree
Investment
Ordinal variable estimated on 5- point Likert scale where 1 means decidedly disagree and 5 means decidedly agree
1 5 3 3
Credit management_arrears
Nominal variable equals 1 if the respondent provides a positive response, and 0 otherwise
0 1 0 0
Credit management_loan
collection
Nominal variable equals 1 if the respondent provides a positive response, and 0 otherwise
0 1 0 0
Debt advice- seeking_credit choice
Nominal variable equals 1 if the respondent provides a positive response, and 0 otherwise
0 1 x 0.462*
Debt advice- seeking_legal aspects
Nominal variable equals 1 if the respondent provides a positive response, and 0 otherwise
0 1 x 0.168*
Debt advice- seeking_debt
counselling
Nominal variable equals 1 if the respondent provides a positive response, and 0 otherwise
0 1 x 0.153*
Debt avice- seeking_number of
advice themes
Ordinal variable: 4=four themes;
3=three themes; 2=two themes;
1=one theme; 0=no advice- seeking
0 4 1 0
Network resources
Ordinal variable estimated on 7- question single-choice test asked separately in relation to family(1), friends(2) and acquaintances(3)
0 27 9 0
Financial well-being
Debt-related well- being
Ordinal variable: 0= I just don’t know’; 1= I have too little debt right now. I wish I could get more; 2= I have about the right amount of debt right now and I face no problems with it; 3= I have too much debt right now and I have or may have difficulty in paying it off
0 3 2 2
Other variables
Impulsivity
Ordinal variable estimated on 5- point Likert scale where 1 means decidedly disagree and 5 means decidedly agree
1 5 2 3
Risk aversion
Ordinal variable estimated on 3- question test with respondents’
self-assessments on a 5-point Likert scale (where 1 meant
‘Decidedly disagree’ and 5 meant ‘Decidedly agree’)
3 15 7 9
Trust in lending institutions
Ordinal variable estimated on 1- question test with respondents’
self-assessments on a 5-point Likert scale (where 1 meant
‘Decidedly disagree’ and 5 meant ‘Decidedly agree’)
1 5 3 3
Note: *Share of positive answers (equals 1); ** Share of male respondents (equals 1) Source: Author’s own study and elaboration
Results
Financial literacy
We did not find significant differences in either actual debt literacy or in perceived debt literacy between Millennial and non-Millennial respondents in terms of the Mann- Whitney U test (Z = -0.08; p = 0.935 for actual debt literacy; Z = -1.93; p = 0.054 for perceived debt literacy). The average score in the test of debt literacy on a scale of 0 to 3 reached M = 0.70 (Me = 1.0; SD = 0.74; IQR = 1) for Millennials and M = 0.72 (Me = 1.0; SD = 0.80; IQR = 1) for non-Millennials. The average self-reported debt literacy on a scale of 1 to 7 was M = 4.49 (Me = 5.0; SD = 1.50; IQR = 3) for Millennials and M = 4.66 (Me = 5.0; SD = 1.53; IQR = 3) for non-Millennials.
The H Kruskal Wallis test brought the same result for the comparison of Millennials versus other generations distinguished in our study – that is, the lack of significant differences between Millennials and previous generations (H(2) = 0.32; p = 0.853 for actual debt literacy; H(2) = 3.71; p = 0.157 for perceived debt literacy). The generations examined in study 1 achieved the following average results in the debt literacy test:
Baby Boomers – M = 0.76 (Me = 1.0; SD = 0.84; IQR = 1), Gen Xers – M = 0.70 (Me = 1.0; SD = 0.77; IQR = 1), Millennials – M = 0.70 (Me = 1.0; SD = 0.74; IQR = 1). Their average self-reports on the literacy reached the following levels: Baby Boomers – M = 4.65 (Me = 5.0; SD = 1.55; IQR = 3), Gen Xers – M = 4.67 (Me = 5.0; SD = 1.52; IQR = 3), Millennials – M = 4.49 (Me = 5.0; SD = 1.50; IQR = 3).
Financial behaviour
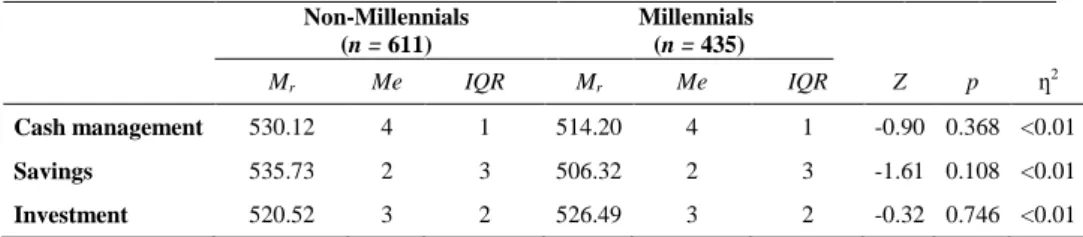
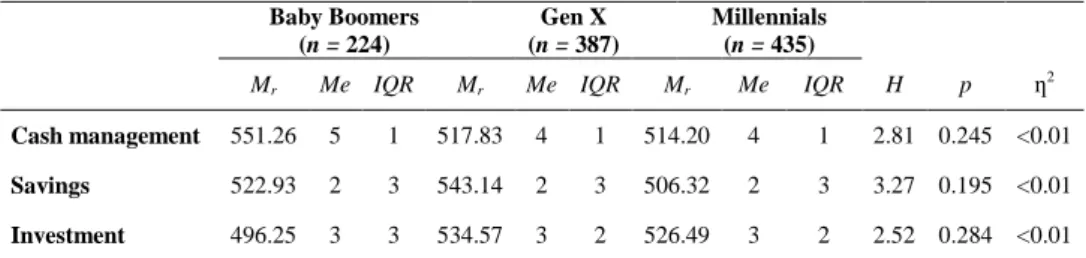
We did not find significant differences in behaviours related to cash management, savings and investment either between Millennials and non-Millennials or between Millennials and any of the previous generations considered in isolation (Table 3 and Table 4, respectively).
We did not detect significant differences in the variables of credit management between Millennials and non-Millennials (Credit management_arrears: χ2(2) = 3.87; p = 0.145; V
= 0.06; Credit management_loan collection: χ2(1) = 0.47; p = 0.494; V = 0.02).
Table 3. Study 1: U Mann Whitney test for significant differences between Millennials and non-Millennials – financial behaviour (except credit management)
Non-Millennials
(n = 611)
Millennials (n = 435)
Mr Me IQR Mr Me IQR Z p ƞ2
Cash management 530.12 4 1 514.20 4 1 -0.90 0.368 <0.01
Savings 535.73 2 3 506.32 2 3 -1.61 0.108 <0.01
Investment 520.52 3 2 526.49 3 2 -0.32 0.746 <0.01
Mr – average rank; Me – median; IQR – interquartile range; Z – Z score; p – significance level; ƞ2 – effect size
Table 4. Study 1: H Kruskal Wallis test for significant differences between Millennials and two previous generations – financial behaviour (except credit management)
Baby Boomers
(n = 224)
Gen X (n = 387)
Millennials
(n = 435)
Mr Me IQR Mr Me IQR Mr Me IQR H p ƞ2
Cash management 551.26 5 1 517.83 4 1 514.20 4 1 2.81 0.245 <0.01 Savings 522.93 2 3 543.14 2 3 506.32 2 3 3.27 0.195 <0.01 Investment 496.25 3 3 534.57 3 2 526.49 3 2 2.52 0.284 <0.01 Mr – average rank; Me – median; IQR – interquartile range; H – Kruskal Wallis test; p – significance level; ƞ2 – effect size
However, we found some significant differences in credit management when running generation-to-generation comparisons. Gen Xers and Millennials significantly more often reported that they got into arrears compared to Baby Boomers (30%, n = 116;
27.4%, n = 119; 16.5%, n = 37; χ2(4) = 18.41; p = 0.001; V = 0.09). The differences between Baby Boomers, Gen Xers and Millennials in the frequency of reporting that respondent was subject to loan collection were insignificant (χ2 (2) = 3.49; p = 0.174; V
= 0.06).
The applied tests showed that Millennials do not differ significantly from non- Millennials either in the frequency of debt advice-seeking (about credit choice: χ2 (1) = 0.01; p = 0.911; φ < 0.01, about legal aspects: χ2 (1) = 0.09; p = 0.762; φ = 0,01; about debt counselling: χ2 (1) = 0.13; p = 0.722; φ = 0.01) or in the number of themes of debt advice they sought (Z = -0.54; p = 0.586; ƞ2 < 0.01). Similarly, Millennials do not differ significantly in these two respects from any of the other generations distinguished in study 1 (for credit choice: χ2 (2) = 1.00; p = 0.952; V = 0.01; for legal aspects: χ2 (2) = 2.58; p = 0.275; φ = 0.05; for debt counselling: χ2 (2) = 5.25; p = 0.072; V = 0.07).
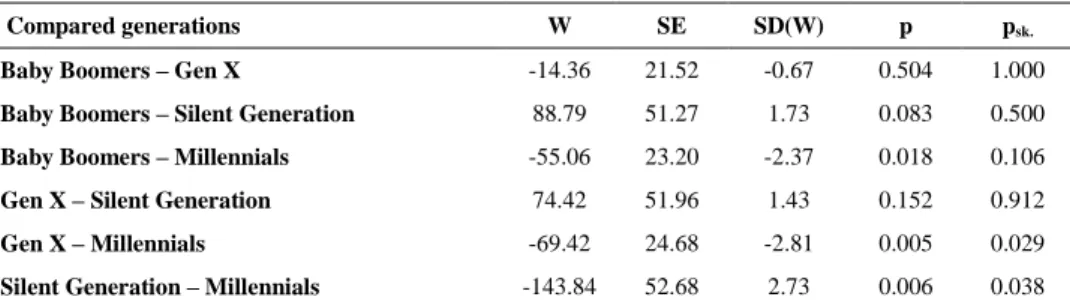
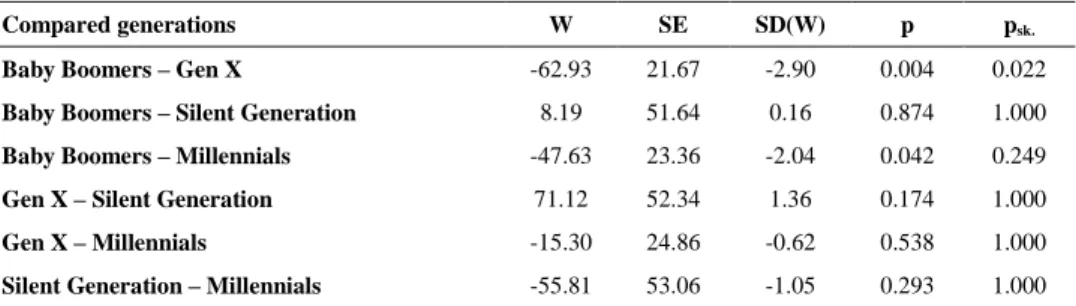
Finally, we found that Millennials significantly more often than the non-Millennials report that they refer to their individual social capital resources made available as a help, a support or a form of assistance that can be received from family and friends (the resources made available by acquaintances turned out to be insignificant). This is particularly visible in comparison to Baby Boomers and when family resources are being considered (detailed results are demonstrated in the Appendix – see Table 21 and Table 22).
Financial well-being
We did not find significant differences in the subjectively perceived debt load reported by Millennial and non-Millennial respondents (χ2(2) = 2.40; p = 0.301; V = 0.05). On average, both age categories seem to be equally satisfied with the load: 80% of all Millennials and 76% of all non-Millennials reported that they had about the right amount of debt. The differences in the perceived debt loads were insignificant as well when comparing three isolated generations: Baby Boomers, Gen Xers and Millennials (χ2(4) = 3.00; p = 0.558; V = 0.04).