A VIRTUAL GLOBE-BASED MULTI-RESOLUTION TIN SURFACE MODELING AND
VISUALIZETION METHOD
Xianwei Zheng, Hanjiang Xiong1,*, Jianya Gong, Linwei Yue
The State Key Laboratory of Information Engineering in Surveying, Mapping and Remote Sensing, Wuhan University, Wuhan, P. R. China [email protected]
Commission VI, WG VI/4
KEY WORDS: Virtual Globe, High Accuracy, Surface Modeling, TIN pyramid, Virtual Partition
ABSTRACT:
The integration and visualization of geospatial data on a virtual globe play an significant role in understanding and analysis of the Earth surface processes. However, the current virtual globes always sacrifice the accuracy to ensure the efficiency for global data processing and visualization, which devalue their functionality for scientific applications. In this article, we propose a high-accuracy multi-resolution TIN pyramid construction and visualization method for virtual globe. Firstly, we introduce the cartographic principles to formulize the level of detail (LOD) generation so that the TIN model in each layer is controlled with a data quality standard. A maximum z-tolerance algorithm is then used to iteratively construct the multi-resolution TIN pyramid. Moreover, the extracted landscape features are incorporated into each-layer TIN, thus preserving the topological structure of terrain surface at different levels. In the proposed framework, a virtual node (VN)-based approach is developed to seamlessly partition and discretize each triangulation layer into tiles, which can be organized and stored with a global quad-tree index. Finally, the real time out-of-core spherical terrain rendering is realized on a virtual globe system VirtualWorld1.0. The experimental results showed that the proposed method can achieve an high-fidelity terrain representation, while produce a high quality underlying data that satisfies the demand for scientific analysis.
1. INTRODUCTION
Virtual globes play significant role in representing the three-multi-resolution, dimensional (3D) model of the (Gore 1998; Goodchild 2008). Different from the traditional GIS, virtual globes not only can integrate the global geospatial data, but also permit the researchers around the world to share their data and findings, which were more effective at solving scientific problems at a global scale (Yu and Gong 2012). However, the power of existing virtual globes was still restricted to functions as a “geo-browser”, which were weak at geospatial analysis and assessment (Craglia et al. 2012; Yu and Gong 2012). One of the cause is that the virtual globes designers usually sacrifice the accuracy to enable the computational efficiency leading to a badly loss of quality. To extend the capabilities of virtual globes for scientific applications, the quality of data generated by the processing methods and its representation should be specially concerned (Goodchild et al. 2012).
As the most fundamental type of geospatial information, terrain data and its processing and visualization formed the base for integrating the heterogeneous geospatial data to render planet, analyse the Earth-related phenomena and display the results in a virtual globe. In the past decades, a number of methods have been proposed for large scale terrain processing and interactive rendering (Pajarola and Gobbetti 2007), which can be grouped into two categories: the Gird-based methods and the TIN-based methods.
The Grid-based methods use the regular grid model for terrain representation are usually well adapted to gridded elevation data based on fixed subdivision rules (Pajarola and Gobbetti 2007). Many algorithms have been developed in this category, such as the quad-tree algorithm (Lee and Samet 2000), the CLOD
(Lindstrom et al. 1996) and SOAR algorithm (Lindstrom and Pascucci 2001), and the ROAMing algorithm (Duchaineau et al. 1997). Due to the ease of implementation of out-of-core rendering based on tiled blocks, the Grid-based methods have been widely adopt by current virtual globes. However, the use of regular grid model for terrain representation has many drawbacks. On one hand, the grid geometry is not adaptive to the irregularity of terrain leading to large data redundancy and large terrain expression distortion (Paredes et al. 2015). When those Earth surface dynamics or related analysis results needed to be precisely displayed and evaluated, it could be failed with a distorted terrain representation. Another significant problem is that the grid terrain model is unable to represent the highly detailed surfaces measured by new sensors and methodologies, such as the LiDAR elevation points (Nebiker et al. 2010). Since the global terrain data are massive, the pre-computation of pyramid layers or level of detail (LOD) and tiling of the data are always necessary for spherical terrain rendering on virtual globes (Christen and Nebiker 2011). For the grid-based virtual globes, the bilinear, spline, and wavelet transform are common methods used for LOD creation (DuYing 2005; Xiang and Zhu 2009). However, their resulting multi-resolution terrain data (elevation grids) always suffer from serious topographic information loss (Yue et al. 2015; Zheng et al. 2016) due to the neglect of the natural characteristics and the context of landscapes.
An alternative way for terrain representation is to use the TIN model, which has a more flexible geometric structure. The early examples can be found in the work of Hoppe (1997) and Ribelles et al. (2002), but they were not yet successfully applied in virtual globes due to the high cost at implementation. Researchers also strive to achieve a less costly implementation that is suitable for the virtual globe (Cignoni et al. 2003;
DuYing 2005; Gobbetti et al. 2006). Nevertheless, they are not fully TIN based which are still limited to gridded input due to the restriction on models. More recently, Christen and Nebiker (2011) presented a TIN-based approach for processing large scale LiDAR points for virtual globe rendering. However, the real time terrain crack elimination was not considered. Moreover, their LOD generation only depends on the requirement of real time rendering while the data accuracy at different levels are not precisely delimited. The multi-resolution terrain data generated by the current virtual globes are mostly served for fast rendering, which is unable to satisfy the demand for scientific analysis and evaluation.
In this study, a new approach is presented for morphological triangulation of large scale regular or irregular elevation dataset for virtual globe visualization and analysis. The approach uses an maximum z-tolerance method to iteratively create the multi-resolution TIN pyramid. The whole TIN pyramid was constructed under the guidance of cartographic principles so that in each layer the LOD generation was formulized with the accuracy standards. To preserve the topological structures of landscape at different level, the break lines were extracted and incorporated into the TIN model. Moreover, the TIN in each layer could be seamlessly partitioned and tiled with the global quad-tree structure, so that an efficient out-of-core spherical terrain rendering can be realized.
2. MORPHOLOGICALLY MODELING OF MULTI-RESOLUTION TIN SURFACE
2.1 Maximum z-tolerance method
A great number of achievements have been gained for the generation of multi-resolution adaptive terrain representation using the TINs (Garland 1999; De Floriani et al. 2005; Chen and Zhou 2013). In the previous works, the maximum z-tolerance method was proved to be optimized to produce surface with a minimum number of points for a given error measurement (Garland and Heckbert 1997). It features a iterative process starting with an initial triangulation (usually two triangles for grid DEMs), and then recursively inserts point of highest error to a current approximation, until no points remains with higher error than a given tolerance. Based on this iterative process, any type of data used input, a hierarchical triangulation can be finally produced.
It is to be pointed that the maximum z-tolerance algorithm alone is inadequate because it discards the continuous linear patterns of the natural landscapes. Therefore, a hybrid method developed in our previous work (Zheng et.al. 2015) is then utilized to extracted the topologically correct drainage lines and incorporated into the triangulation to construct a drainage-constraint TIN in each layer.
2.2 Multi-resolution TIN pyramid construction
The requirement for data quality usually depends on the scale of applications (Zhou and Chen 2011). To enable the multi-resolution pyramid data for scientific analysis, the accuracy in different layers should match their spatial scale. For traditional raster pyramid, the resolution of the image grids at different layers implicitly describes their LOD or spatial scale. However, the resolution of TINs is not fixed. When constructing the TIN pyramid, we need to determine the LOD (degree of simplification) for a specific layer. In this study, we employe the cartographic principles to formulize the LOD generation of TIN
modeling. The main two indexes for controlling data quality at different spatial scale are maximum elevation error (
max agencies (State Bureau of Surveying and Mapping 2001). It has
been found that the two variable RMSE and
E
maxhas a highcoherence (Zhou and Chen 2011). Therefore, only the
permitted
E
max is used as the scale variable to control theLOD generation. Moreover, according to State Bureau of
Surveying and Mapping (2001), the permitted
E
max andspatial resolution
D
r
has a relation as follows:resolution TIN pyramid construction process are as follows: (1) Initialization. In a typical virtual globe tile system, the top level in the pyramid usually covers the whole earth surface with 2 basic tiles (or can be varied), and tiles for the rest levels is based on a recursive quad-tree subdivision of the top basic tiles. Thus, given an elevation dataset with a spherical resolution
c
D
(along the longitude direction), the level of the bottomlayer
L
bottom in the pyramid is determined:1 1
direction, and
n
is the level of the bottom layer. For a standardpyramid,
L
bottom is equal ton
, the spherical resolution of(2) Iterative TIN construction. Given that the number of layers
and the corresponding permitted
E
max are determined, themaximum z-tolerance algorithm is then performed to iteratively construct the TIN pyramid by a top-down approach. During the iterative process, whenever an error value between a candidate insertion point and the current triangulation is smaller than a
given
E
max (i.e. meets the accuracy requirement of at thatpyramid layer), turn to step 3. The iterative process will be
terminated until no points remains with higher error than the
max
E
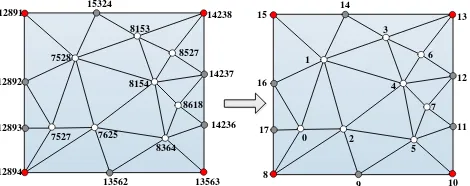
of the bottom layer.(3) Drainage constraint. For a given pyramid layer, the drainage lines are generalized to match the scale of that layer and forced into the triangulation to construct a drainage-constraint TIN. (4) Spatial subdivision and storage. The global quad-tree subdivision as mentioned in step 1 is utilized to virtually partition the triangulation and create tiles for that layer. By traversing the quadtree structure in a Morton order, tiles in the current layer are written into the database step by step based on a virtual node (VN) structure, which will be detailed in section 2.3. When all tiles are saved in database, the changes (new points and new triangles) resulting from drainage enforcement and TIN partition are discarded and the iteration process goes to step 2 to continue the calculation of TINs for the remain layers. Figure 1 denotes the process of multi-resolution TIN pyramid construction.
Figure 1. The process of multi-resolution TIN pyramid construction.
2.3 Efficient TIN storage with virtual node (VN) structure After the spatial subdivision and virtual partition, the TIN in each layer is blocked into tiles. To exploit an efficient storage of the multi-resolution TIN pyramid, we define the structural components of a TIN tile as in figure 2. Here, all of the border vertices are defined as virtual vertices, and the triangles with one of its edge overlapped on the tile boundary are defined as virtual triangles (VTs). We called virtual vertices and triangles as VN structure which will be further used for efficient storage of resulting TIN tiles. Moreover, we denote the edges of a cell as B i( ) and its corners as C i( ) with i0,..,3, as indicated in
Figure 2. The virtual node structure of a TIN tile.
Consider that the corner points and tile edge points are shared by different neighbour tiles, they are then saved in the corner structure and edge structure, respectively. Data in corner structure and edge structure can build their own index key so that they can be accessed independently. The rest data
associated with a TIN tile, including the interior vertices, the list of virtual triangles (VTs) and interior triangles, and the other information necessary for real-time rendering or further applications are stored in a tile body structure.
0 2
Figure 3. Local index assignment for each vertex in a tile.
At run-time, meshes for TIN tiles are to be assembled based on the vertices and triangles stored off-line. Since triangles are defined by point indices, to guarantee the vertices from different storage structures could be correctly assembled and indexed, they must be processed carefully with some rule in advance. In our solution, we assigned a local index for each vertex in a tile before writing out triangles, as illustrated in figure 3. The assignment of local index values for virtual vertices is performed according to the counterclockwise order, which starts from the vertex at
C
(0)
and terminates at the last vertex onedge
B
(3)
. Triangles are then written out based on these local indices. When creating the mesh for a tile, if vertices from different storage structures are assembled with the same order to the order of local index value assignment, the triangles can be correctly reconstructed.3. VISUALIZATION
We implemented the final out-of-core spherical terrain rendering of the morphologically preserved multi-resolution TIN surface in a virtual globe system VirtualWorld1.0, which is developed by Wuhan university. The architecture of this virtual globe is similar to some popular Grid-based virtual globe systems. For example, data can be scheduled and streamed over the Internet, local networks or a local hard disk, and a least recently caching approach is used to maintain the mostly recently used data the most expensive and fastest memory. The classical quad-tree partitioning is used for the LOD assignment of surface tiles for a given point of view. Since the multi-resolution TIN data has been spatially discretized and stored in tiles with the quadtree structure, which kept the intrinsic compatibility for the implementation on a Grid-based virtual globe. For the terrain crack elimination, adaptive tessellation method can be developed to previously compute and encode the tessellation information for each VTs in a tile. At run-time, the tessellation information is decoded and the corresponding VTs are the tessellated to join meshes of different LODs together.
4. EXPERIMENTS 4.1 Results
To validate the proposed multi-resolution TIN modelling and visualization method, we conducted the first experiment on a grid DEM from Wasatch Mountain area near the city of Salt Lake, Utah, which is composed of 6402*8372 grid cells with a 10 m spatial resolution. For convenience of presentation, we referred the proposed as M-TIN method hereafter. To construct the multi-resolution TIN pyramid, the data was first transformed
from the source spatial reference system into to a global reference system and a maximum number of pyramid layers was given as parameter (for convenience of evaluation, a four level pyramid was specified for this DEM dataset). The
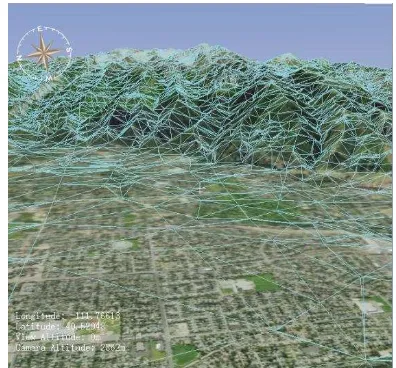
max E values were then calculated for each pyramid layer and the original streamlines were correspondingly generalized to match the scale of a given pyramid. Based on the multi-resolution TIN pyramid prepared in database, the continuous LOD rendering of TIN terrain was implemented in our virtual globe VirtualWorld 1.0 as mentioned in section 3. Figure 5 shows the 3D representation of the multi-resolution TIN surface in Wasatch area at a certain point of view. In figure 5(a), the sharp relief in the mountainous areas is clearly visible indicating that the surface morphology is well preserved. Figure 5(b) visualizes the TIN wireframe of the multi-resolution surface, in which the different parts of a scene are displayed at different resolutions.
(a)
(b)
Figure 4. Visualize the morphologically preserved multi-resolution TIN surface in virtual globe. (a) The hill-shade effect. (b) The TIN wireframe.
The multi-resolution TIN tiles can also be easily blended with the image data to generate the textured terrain, as shown in figure 6. The image data is being tiled using the same global quadtree structure as the elevation data. By blending the elevation tiles in wireframe mode with image tiles, the
consistency between the texture feature and geometric feature at representing surface morphology can also be visually inspected.
Figure 5. TIN wireframe and image data rendered together.
4.2 The effectiveness of M-TIN approach for data processing
In order to evaluate the effectiveness of the proposed M-TIN method for data processing, the bilinear resampling, which was commonly used for data processing in the grid-based virtual globes, was chosen for comparison. To make a fair comparison, a four level raster pyramid for the same DEM from Wasatch area was constructed by the bilinear resampling method and in each level the raster resolution matches the scale of that level’s TIN. The statistical comparison results of the two methods are listed in table 1. The RMSE and
E
max of the simplified dataagainst the input DEM are employed as the quantitative measurements. Values in the brackets indicate the RMSE and
max
E
tolerance permitted by the cartographic standard at that level.Table 1. A comparison between bilinear method and M-TIN method.
Level method Points (
103)
%(points )
RMSE(m) Emax (m)
1 M-TIN 31.7 0.3 17.33 64
Bilinear 1198.7 12.5 15.18(32) 135(64)
2 M-TIN 65.8 0.7 8.99 32
Bilinear 2397.4 25 6.87(16) 97(32)
3 M-TIN 151.9 1.6 4.76 16
Bilinear 4794.8 50 2.74(8) 49(16)
4 M-TIN 423.9 4.4 2.48(4) 8(8)
Bilinear 9589.6 --- --- ---
The comparison results showed that the M-TIN approach can efficiently simplify the original DEM using a very little number of points but gain a close RMSE to resample method. The RMSE results of both methods are well below the accuracy tolerance permitted by the cartographic standard (as listed in the bracket). However, the resampling method failed to deliver satisfactory results for the mapping standard in the measurement of
max
E
. The use of such data for multi-scale terrain-based analysis could cause uncertainties.4.3 Applications
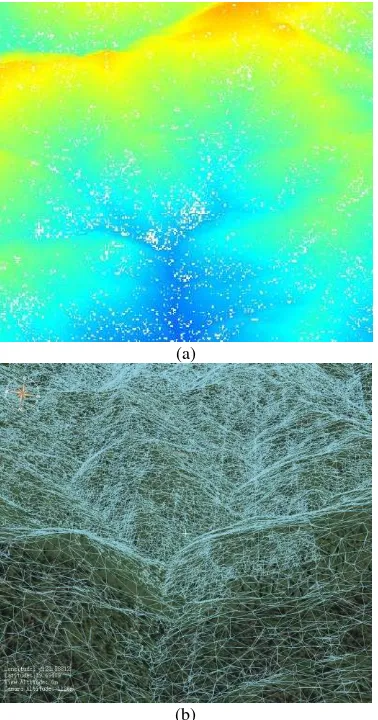
The high-resolution topography obtained by densely LiDAR points is essential for deeper study of Earth surface processes(Tarolli 2014). In the this example, we applied our M-TIN approach on an arbitrary distributed LiDAR dataset from part of the area of South Fork. A highly detailed topography with the TIN wireframe draped by the image data can be seen in figure 7(b). Since the M-TIN approach supports the LOD triangulation and the quadtree-based tiling, it therefore permits an efficient processing and visualization of any large scale LiDAR elevation dataset.
(a)
(b)
Figure 6. Multi-resolution TIN surface modelling and visualization for LiDAR elevation points. (a) rough LiDAR points. (b) Multi-resolution TIN surface.
5. CONCLUSION
This article presented a new method for processing large scale elevation data for virtual globe visualization and analysis. Different from the previous methods, the proposed approach has taken into account cartographic principles when constructing the multi-resolution terrain (TIN) pyramid. It connected each pyramid layer with a scale variable to formulize its LOD generation and forced the topologically correct drainage features into the TIN structure. Hence, the morphological characteristics and the context of landscape are preserved over a range of levels, while the data errors are well under the data quality standard permission. In addition to morphological LOD triangulation, the proposed approach also
supports efficient tiling and storage of TINs with spatial structure, based on a critical virtual partition. Therefore, any regular or irregular elevation datasets could be used as input, and an efficient out-of-core and view-dependent terrain rendering is realized. The use of presented M-TIN approach can dramatically reduce data redundancy while achieve a significantly improved terrain representation. Within the high-quality underlying terrain data and high-fidelity terrain representation with flexible TIN structure, virtual globes in the future can be extended beyond geo-browsing to include more scientific analysis and evaluation capabilities in handling global environment change issues.
REFERENCE
Agugiaro, G. and T. H. Kolbe, 2012. A deterministic method to integrate triangular meshes of different resolution. ISPRS Journal of Photogrammetry and Remote Sensing 71: 96-109.
Chen, Y. and Q. Zhou, 2013. A scale-adaptive DEM for multi-scale terrain analysis. International Journal of Geographical
Information Science 27(7): 1329-1348.
Christen, M. and S. Nebiker (2011). Large Scale Constraint Delaunay Triangulation for Virtual Globe Rendering. Advances
in 3D Geo-Information Sciences, Springer: 57-72.
Cignoni, P., F. Ganovelli, E. Gobbetti, F. Marton, F. Ponchio and R. Scopigno, 2003. BDAM—Batched Dynamic Adaptive Meshes for high performance terrain visualization. Computer
Graphics Forum, 505-514, Wiley Online Library.
Craglia, M., K. de Bie, D. Jackson, M. Pesaresi, G. Remetey-Fülöpp, C. Wang, A. Annoni, L. Bian, F. Campbell and M. Ehlers, 2012. Digital Earth 2020: towards the vision for the next decade. International Journal of Digital Earth 5(1): 4-21.
De Floriani, L., L. Kobbelt and E. Puppo (2005). A survey on data structures for level-of-detail models. Advances in
multiresolution for geometric modelling, Springer: 49-74.
Duchaineau, M., M. Wolinsky, D. E. Sigeti, M. C. Miller, C. Aldrich and M. B. Mineev-Weinstein, 1997. ROAMing terrain: real-time optimally adapting meshes. Proceedings of the 8th
Conference on Visualization'97, 81-88, IEEE Computer Society
Press.
DuYing, A., 2005. Research on Key Technologies for Global
Multi-resolution Virtual terrain Environment. Doctorial
Dissertation of The PLA Information Engineering University.
Garland, M., 1999. Multiresolution modeling: Survey & future opportunities. State of the Art Report: 111-131.
Garland, M. and P. S. Heckbert, 1997. Surface simplification using quadric error metrics. Proceedings of the 24th annual
conference on Computer graphics and interactive techniques,
209-216, ACM Press/Addison-Wesley Publishing Co.
Gobbetti, E., F. Marton, P. Cignoni, M. Di Benedetto and F. Ganovelli, 2006. C‐BDAM–Compressed Batched Dynamic Adaptive Meshes for Terrain Rendering. Computer Graphics Forum, 333-342, Wiley Online Library.
Goodchild, M. F., 2008. The use cases of digital earth.
International Journal of Digital Earth 1(1): 31-42.
Goodchild, M. F., H. Guo, A. Annoni, L. Bian, K. de Bie, F. Campbell, M. Craglia, M. Ehlers, J. van Genderen and D. Jackson, 2012. Next-generation digital earth. Proceedings of
the National Academy of Sciences 109(28): 11088-11094.
Gore, A., 1998. The digital earth: understanding our planet in the 21st century. Australian surveyor 43(2): 89-91.
Hoppe, H., 1997. View-dependent refinement of progressive meshes. Proceedings of the 24th annual conference on
Computer graphics and interactive techniques, 189-198, ACM
Press/Addison-Wesley Publishing Co.
Lee, M. and H. Samet, 2000. Navigating through triangle meshes implemented as linear quadtrees. ACM Transactions on
Graphics (TOG) 19(2): 79-121.
Lindstrom, P., D. Koller, W. Ribarsky, L. F. Hodges, N. Faust and G. A. Turner, 1996. Real-time, continuous level of detail rendering of height fields. Proceedings of the 23rd annual
conference on Computer graphics and interactive techniques,
109-118, ACM.
Lindstrom, P. and V. Pascucci, 2001. Visualization of large terrains made easy. Visualization, 2001. VIS'01. Proceedings, 363-574, IEEE.
Longgang, X. and Z. Xinyan, 2009. Organization and schedule of multi-resolution pyramid based on wavelet transform.
Geoinformatics, 2009 17th International Conference on, 1-5,
IEEE.
Nebiker, S., S. Bleisch and M. Christen, 2010. Rich point clouds in virtual globes–A new paradigm in city modeling?
Computers, Environment and Urban Systems 34(6): 508-517.
Pajarola, R. and E. Gobbetti, 2007. Survey of semi-regular multiresolution models for interactive terrain rendering. The
Visual Computer 23(8): 583-605.
Paredes, E., M. Amor, M. Bóo, J. Bruguera and J. Döllner, 2015. Hybrid terrain rendering based on the external edge primitive. International Journal of Geographical Information
Science: 1-22.
Ribelles, J., A. López, O. Belmonte, I. Remolar and M. Chover, 2002. Multiresolution modeling of arbitrary polygonal surfaces: a characterization. Computers & Graphics 26(3): 449-462.
State Bureau of Surveying and Mapping, 2001. 1:10000 and 1:50000 digital elevation model. The Basic Digital
Geographical Information Product. Standard CH/T 1008-2001.
The State Bureau of Surveying and Mapping of China (in Chinese).
Tarolli, P., 2014. High-resolution topography for understanding Earth surface processes: opportunities and challenges.
Geomorphology 216: 295-312.
Yu, L. and P. Gong, 2012. Google Earth as a virtual globe tool for Earth science applications at the global scale: progress and perspectives. International Journal of Remote Sensing 33(12): 3966-3986.
Yue, L., H. Shen, Q. Yuan and L. Zhang, 2015. Fusion of multi-scale DEMs using a regularized super-resolution method.
International Journal of Geographical Information Science
29(12): 2095-2120.
Zheng, X., H. Xiong, J. Gong and L. Yue, 2015. A robust channel network extraction method combining discrete curve evolution and the skeleton construction technique. Advances in
Water Resources 83(0): 17-27.
Zheng, X., H. Xiong, L. Yue and J. Gong, 2016. An improved ANUDEM method combining topographic correction and DEM interpolation. Geocarto International 31(5): 492-505.
Zhou, Q. and Y. Chen, 2011. Generalization of DEM for terrain analysis using a compound method. ISPRS Journal of
Photogrammetry and Remote Sensing 66(1): 38-45.