I could not have accomplished this work without the love and support of my family and friends. The results of this work suggest that if analysts want to ensure that results from survey data are accurate, the likelihood of respondents withdrawing from answering survey questions must be taken into account.
Introduction to Shirking in Survey Answers
Thus, with appropriate measures of ability, motivation, and task difficulty, it is possible to evaluate the determinants of avoidant behavior. Now that the measures of abstraction in response times have been identified, it is possible to explore the implications of abstraction for the analysis of substantive issues.
Talking about Answering Surveys
- Setting up the Conversation
- The Pros and Cons of Interview Data
- The 2003 Attitudes Survey
- Interviews about Answering Surveys
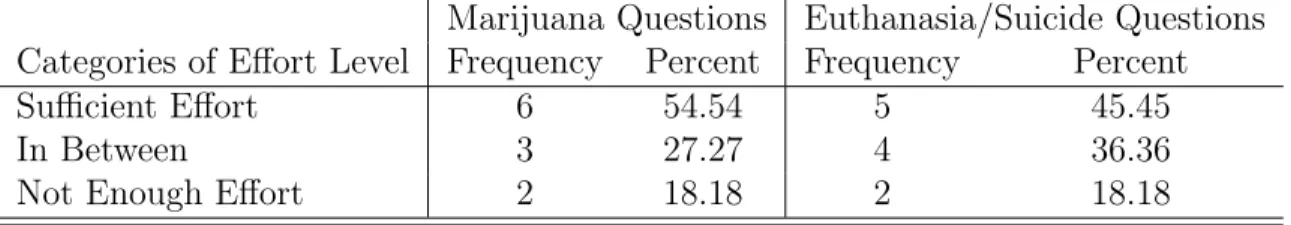
Since interview participants were Caltech students, it was possible to maintain a similar interview experience for each participant—all participants were interviewed by the same interviewer in the same setting.4 The small size also allowed the interviewer to gather as much information as possible from each respondent. The data in Table 2.1 indicate that most of the interview participants seem to have made a reasonable effort to answer the survey questions.
Demands and Rewards from Answering Surveys
Costs or Demands
- Understanding
- Memory and Recall
- Retrieval and Judgment for “Factual” Questions
- Retrieval and Judgment for Attitude Questions
- Reporting Responses
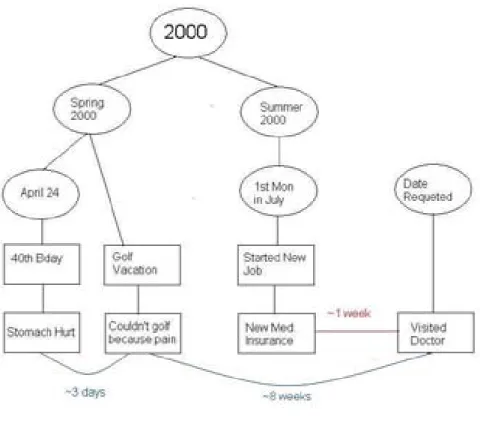
The way these are retrieved and related to the question is influenced by the interview process and the characteristics of the respondent. Finally, the characteristics of the respondent will influence the amount of effort required to accurately retrieve event information.
Benefits or Rewards
- Financial Rewards
- Non-Pecuniary Rewards
- Some Evidence of Rewards
Unfortunately, understanding of the non-monetary rewards resulting from survey participation is limited. The factors influencing research participation are categorized as functions of the respondent's relationship to the interview, the relationship to the interviewer, and the relationship to themselves (Brehm 1993).
The Net Benefits
As nearly half of respondents spoke of the usefulness of surveys and personal enjoyment of the survey participation process, this suggests that the rewards of survey participation are associated with emotional catharsis and relief of social conscience. Using this model, Chapters 6 and 7 conduct tests of how the costs and benefits of survey participation affect respondent behavior.
Instability and Reliability of Opinion Survey Answers
Observed Attitude Instability
When comparing pairs of attitudinal questions asked in the same survey on related issues, extremely low rank-order correlations were also found (Converse 1964, p. 228). Survey experiments that vary question frames (organizing ideas or stories that provide meaning by identifying the essence of issues) have also been used to study how answers change in different contexts.4 Kinder & Sanders (1990) report that question frames determines whether racist resentment attitudes or equal opportunity preferences are active in speech.
Non-Attitudes vs. Durable Belief Constructs
- Belief Construct Pluralism
- Shortcutting Cognitive Processes
Different question frames, however, do not always result in different answers; Alvarez & Brehm (2000) found only marginal effects on survey responses when they varied the framing of questions on social policy issues in a 1998–1999 multi-researcher study. The avoidance model has concepts similar to those of the satisficing model, but in the avoidance model the cognitive shortcut is completely rational, so it is inappropriate to label it as satisficing.
Identifying Reliable Responses
Because this work does not use inter-temporal measures to identify responses that are unreliable, confounding effects of opinion changes over time or across different question wordings are avoided. 12This work does not resolve the issue of identification, although the evidence from the in-depth interviews suggests that "no opinion" response and response times can be used to identify respondents who do not provide reliable answers.
The Shirking Model of Answering Surveys
- Deriving the Shirking Model
- Preferences and Rationality in the Survey Set- tingting
- Choosing Effort
- Defining Shirking
- Indicators of Shirking
- Survey Level Indicators of Shirking
- No Opinion Responding
- Response Times
- Ability, Motivation, and Difficulty
- Defining Ability, Motivation, and Difficulty
- Measuring Ability, Motivation, and Difficulty
The concept of shirking is based on the idea that the level of effort chosen by rational respondents does not necessarily match the amount of effort that would be required to provide reliable answers. 9For the purposes of the subsequent analysis, shirking is assumed to be a binary variable, but it is possible to expand the definition of shirking to allow for different levels of shirking. 12 Degrees of shirking can be indicated by the frequency with which respondents use strategies that indicate shirking.
Given the above assumptions, the proportion of "no opinion" responses provided across the survey is another survey-level indicator of avoidance. In this case, “no opinion” responses are likely to be reliable and as such should not be used as an indicator of avoidance. Assuming that relevant indicators of avoidance can be identified, it is possible to test how ability, motivation, and difficulty relate to the likelihood of avoidance.
Two Behaviors that Might be Indicative of Shirking
The Quick and the Wrong
- The “quick-wrong” Indicator of Shirking
- Substantive Behavior of the “quick-wrong” Shirkers
There are several ways in which a “go wrong” avoidance indicator can be developed from this data. To identify an appropriate indicator of rapid responses, it is useful to examine the log distribution of reduced response times summed over all three actual questions. Because the variance of this distribution is relatively low, all response times that were less than one standard deviation below the mean of the logarithm of the reduced sum of response times were defined as fast responses.9.
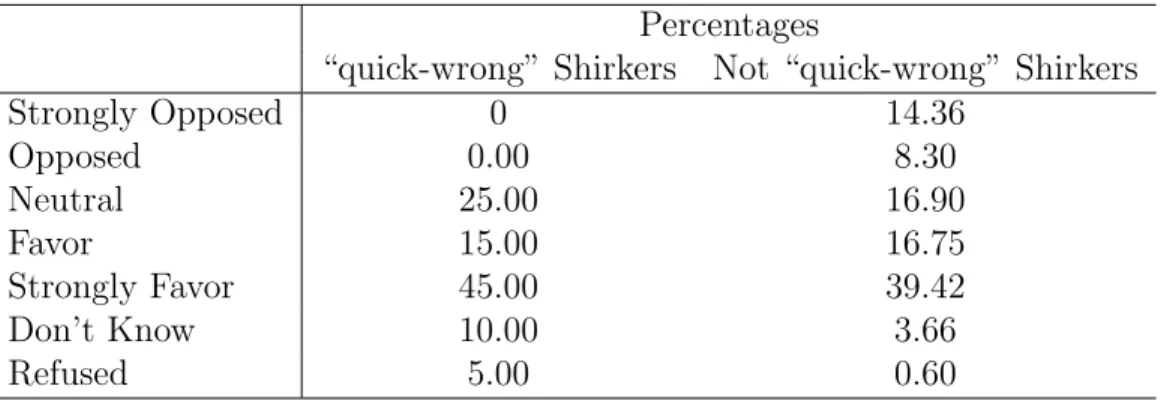
Combining the above measures of fast and wrong, thirty-two respondents, or 1.47 percent of the sample, are identified as dodgers according to "fast wrong." Given the indicator of “fast-wrong” evasion, it is possible to investigate how the behavior of these evaders differs from their non-evading counterparts. According to this table, those who were “quickly wrong” were more likely to give neutral responses, strong favoritism, and “no opinion” (don't know or refused) responses.

No Opinion Responding
- Proportion of No Opinion Responses as an Indicator of Shirkingof Shirking
- Empirical Analysis using the No Opinion Measure of Shirking
- Measuring Question Difficulty
- Incorporating Difficulty Measures into the Analysis of the No Opinion form of Shirkingthe No Opinion form of Shirking
- New Measures of Question Difficulty
- Incorporating New Difficulty Measures into the Anal- ysis of No Opinion Respondingysis of No Opinion Responding
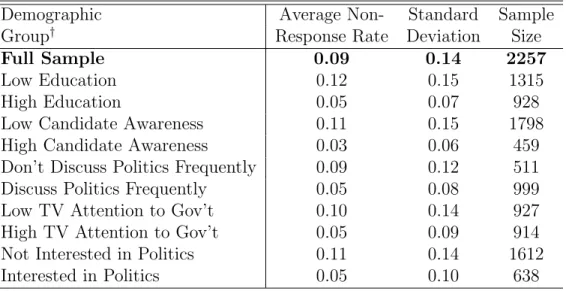
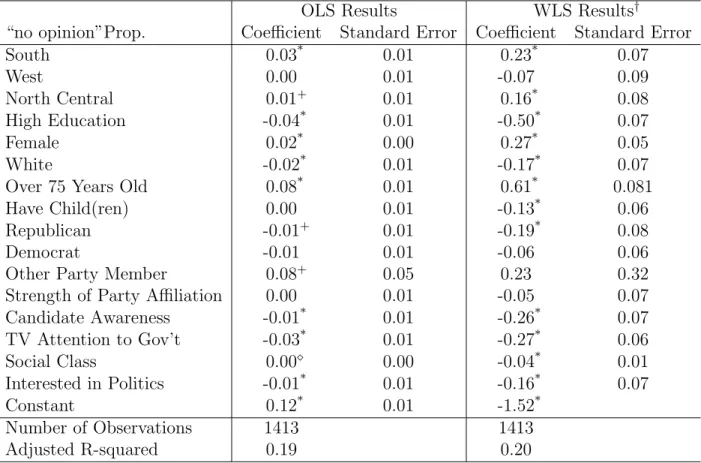
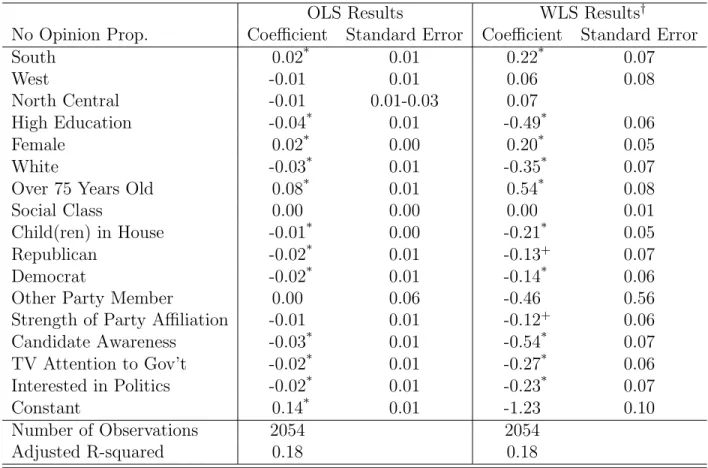
Equally important are the survey questions at the end of the survey that received a very low percentage of "no opinion" responses. The bold rows in both tables contain the overall mean percentage of "no opinion" responses. Figures 6.4 and 6.5 combine third-party difficulty ratings with “no opinion” response rates for survey participants.
Thus, it seems reasonable to include response times along with the difficulty measures in the analysis of avoidance as identified by "no opinion" response behavior. So the maximum number of times they can express a "no opinion" response is four. This variable also has a significant positive effect on the likelihood of providing “no opinion” responses.

Response Times as Indicators of Shirking
- Response Times, Effort, and Accuracy
- Response Times and Shirking—Outliers Anal- ysisysis
- Response Times and Shirking—Analysis Based on Group Classificationon Group Classification
- Asking Questions about Difficulty and Timing Answers
Assume that the relationship between accuracy or reliability and response times is the same. 11 This question is examined because it has the highest level of avoidance as identified from the response times. An alternative way to examine avoidance behavior as identified by response times is to compare this measure of avoidance with avoidance as identified by respondents who provided "no opinion" responses.
For the question about welfare limits, the avoidance rate, as evidenced by the response times, is six times greater than the percentage evidenced by the 'no opinion' answers. As Table 7.5 suggests, the degree of evasion, as measured by response times, likely varies across questions. Response times provide an alternative means of identifying withdrawal, but in the MI1998 these measures appear to be orthogonal to measures of withdrawal based on a “no opinion” response.
Shirking in Answers to Telephone and Internet Surveys
Comparing Caltech Internet Survey Respon- dents
- Demographics Characteristics
- Knowledge and Behavior
- Feelings and Opinions
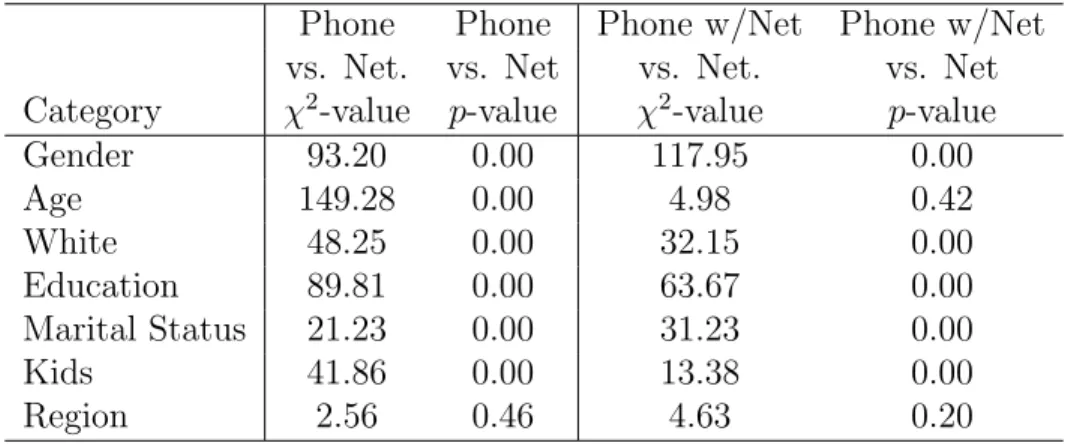
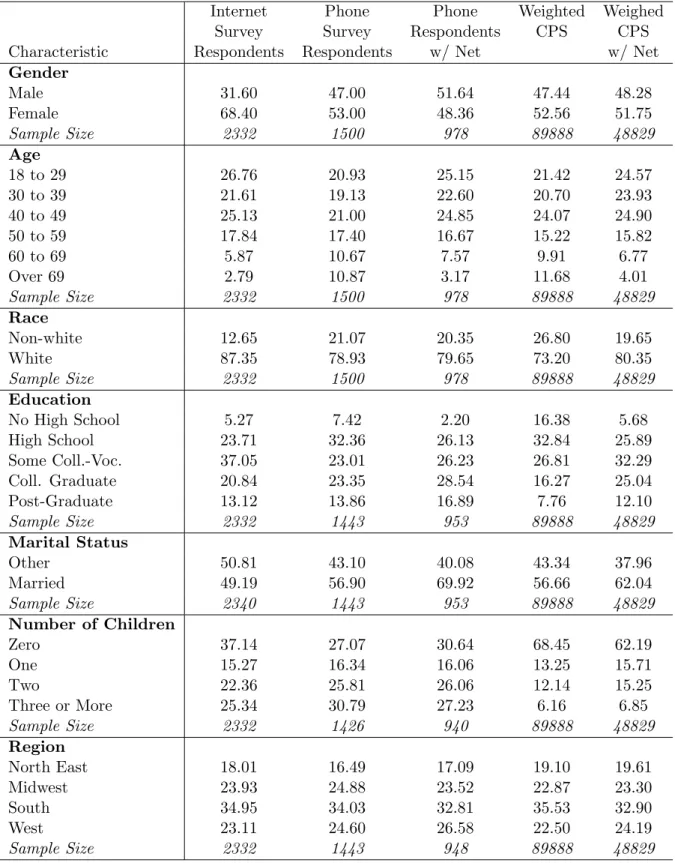
Tests comparing the distribution of respondents' characteristics show that, compared to the telephone survey, online respondents were less likely to be married and have children. It is clear that the Internet sample differs significantly from the two telephone survey samples in terms of these characteristics. 7Pearson Chi-Squared tests for differences between telephone and Internet respondents are contained in Table A.1 and the same statistics for a comparison of Internet and CPS respondents are contained in Table A.2.
12This may prove that Internet respondents are more likely to answer sensitive questions honestly. Comparing the Internet and telephone respondents, it appears that Internet respondents are "colder" toward Bush and Gore. Another interesting feature of these questions is that the Internet respondents were most likely to skip this question - only seventy-three percent of Internet respondents provided a thermometer score for Bush and Gore.
Shirking—No Opinion Responding Across Modes
Unfortunately, the fact that Internet respondents were able to skip the questions complicates the analysis of "no opinion" responses. Simple t tests comparing these means indicate no statistically significant difference in “no opinion” response behavior across the study conditions. However, if the measure of “no opinion” responses includes non-responses, then this coefficient is positive and significant—Internet respondents are more likely to give “no opinion” when skipped.
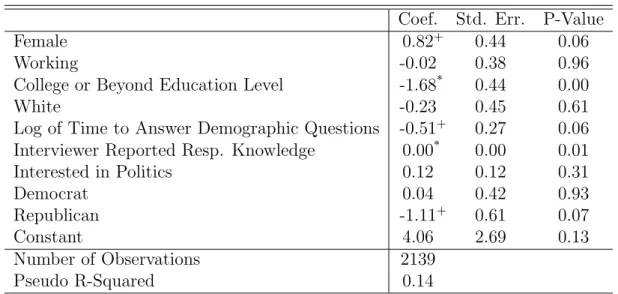
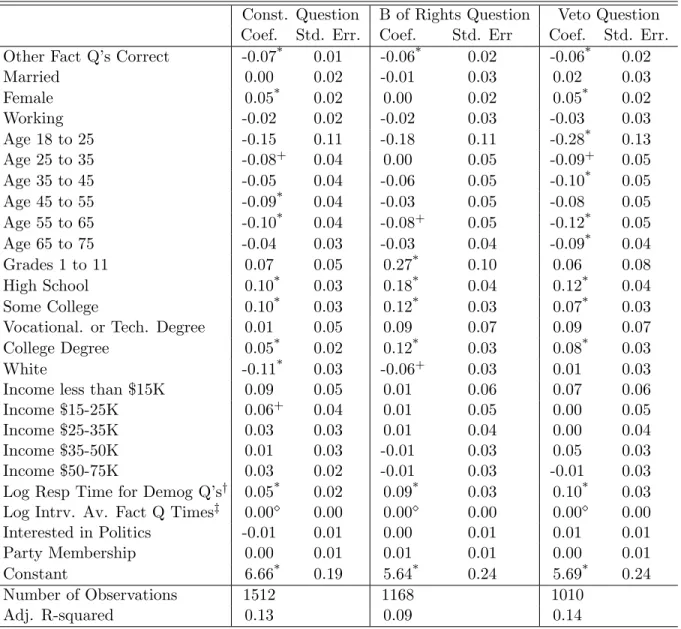
It is also interesting to note that increased political awareness results in reduced levels of "no opinion" responding as expected. The same is true for education and strength of party identification.19 Being white, having children, and supporting either Bush or Gore also reduces the "no opinion" response. On the other hand, being female is associated with an increase in "no opinion" response.
Stacking up Internet Survey Responses
Conclusions about Shirking on Survey Answers
The Caltech Internet Survey Project (CISP)
- March 2001 Matched Internet and Telephone Surveys
- The 1980 NES Pre-Election Survey Variables
- The 1984 NES Pre-Election Survey Variables
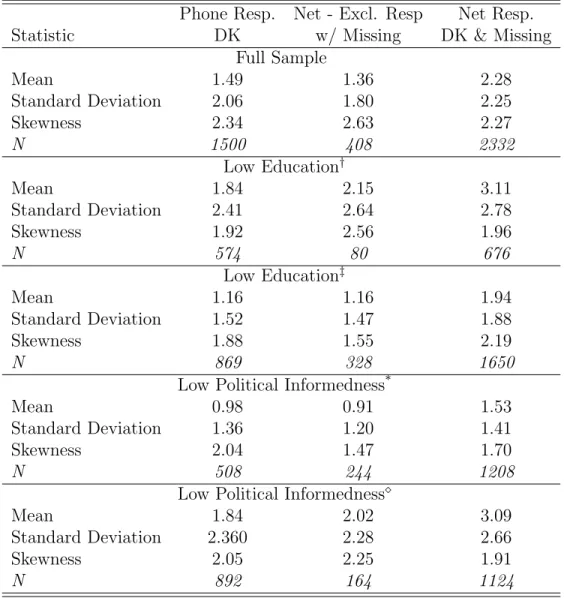
In March 2001, matched Internet and telephone surveys were conducted as part of the Caltech Internet Survey Project.2 The Internet survey began on March 22, 2001, when registered respondents were sent an e-mail asking them to visit the survey website and complete a new survey. .3 At the same time, new respondents were recruited using the subscription method.4 The telephone survey was conducted by Interviewing Services of America (ISA).5. Only 408 Internet survey respondents answered ALL survey questions in March 2001. Also, when conducting the telephone survey, there were 199 interrupted interviews for which no data was kept.
It is also important to note that Internet respondents were asked to provide demographic information before answering the opinion questions, while telephone survey respondents received the demographic questions at the end of the survey. For a general discussion of the sampling issues associated with Internet surveys, see (Alvarez, Sherman & VanBeselaere 2003) and (Couper 2000). Several of the respondent characteristics included in the analysis were created based on the above demographic information.