Home > Afro-Asian Journal of Finance and Accounting
Afro-Asian Journal of Finance and Accounting
This journal also publishes Open Access articles
Finance and accounting are seen as essential components for the successful implementation of market-based development policies supporting economic liberalisation in the rapidly emerging economies in Africa, the Middle-East and Asia. AAJFA aims to foster greater discussion and research of the development of the finance and accounting disciplines in these regions. A major feature of the journal will be to emphasise the implications of this development and the effects on businesses, academics and professionals.
Editor in Chief Prof. D.K. Malhotra ISSN online 1751-6455 ISSN print 1751-6447 4 issues per year Subscription price
About this journal Editorial board Submitting articles
Topics covered include
Asset pricing, corporate finance, banking; market microstructure Behavioural and experimental finance; law and finance
Emerging economies: finance, audit committees, corporate governance Islamic finance, accounting and auditing
Equity analysis and valuation, venture capital and IPOs
National GAAP and IASs compliance, harmonisation and strategies
Financial measurement/disclosure, and the quality of information reported Accountability and social/ethical/environmental measurement/reporting Cultural, political, institutional impact on financial measurement/disclosure Accounting practices for intellectual capital and other intangible assets Provision of non-audit services and impairment to auditor independence Audit quality and auditor skills; internal control/auditing
Management accounting, control and /use of key performance indicators Accounting education and professional development, accounting history Public sector and not-for-profit accounting
More topics...
•
•
•
•
•
•
•
•
•
•
•
•
•
•
•
Sign up for new issue alerts Subscribe/buy articles/issues View sample articles
Latest issue contents as RSS feed Forthcoming articles
Journal information in easy print format (PDF)
Publishing with Inderscience:
ethical guidelines (PDF)
Recommend to a librarian (PDF) Feedback to Editor
Find related journals
Keep up-to-date
Our Blog
Follow us on Twitter Visit us on Facebook
Our Newsletter (subscribe for free)
RSS Feeds
New issue alerts
Contact us About Inderscience OAI Repository Privacy and Cookies Statement Terms and Conditions Help Sitemap
© 2020 Inderscience Enterprises Ltd.
*
More on permissions
AAJFA is indexed in:
Scopus (Elsevier)
Academic OneFile (Gale) cnpLINKer (CNPIEC)
EconLit (American Economic Association) Expanded Academic ASAP (Gale)
More indexes...
AAJFA is listed in:
Australian Business Deans Council Journal Rankings List Cabell's Directory of Publishing Opportunities
More journal lists/directories...
•
•
•
•
•
•
•
Return to top
Home > Afro-Asian Journal of Finance and Accounting
Afro-Asian Journal of Finance and Accounting
This journal also publishes Open Access articles
Finance and accounting are seen as essential components for the successful implementation of market-based development policies supporting economic liberalisation in the rapidly emerging economies in Africa, the Middle-East and Asia. AAJFA aims to foster greater discussion and research of the development of the finance and accounting disciplines in these regions. A major feature of the journal will be to emphasise the implications of this development and the effects on businesses, academics and professionals.
Editor in Chief Prof. D.K. Malhotra ISSN online 1751-6455 ISSN print 1751-6447 4 issues per year Subscription price
About this journal Editorial board Submitting articles
Editor in Chief
Malhotra, D.K., Thomas Jefferson University, USA (davinder.malhotra jefferson.edu)
Managing Editor
Joshi, Prem Lal, Multimedia University, Malaysia
Consulting Editor
Dunk, Alan, University of Canberra, Australia
Editor (Accounting)
Gao, Simon S., Edinburgh Napier University, UK
Associate Editors
Bagchi, Debasis, IILM Graduate School of Management, India Negash, Minga, University of the Witwatersrand, South Africa
Editorial Board Members
•
•
•
•
•
•
Sign up for new issue alerts Subscribe/buy articles/issues View sample articles
Latest issue contents as RSS feed Forthcoming articles
Journal information in easy print format (PDF)
Publishing with Inderscience:
ethical guidelines (PDF)
Recommend to a librarian (PDF) Feedback to Editor
Find related journals
Keep up-to-date
Our Blog
Follow us on Twitter Visit us on Facebook
Our Newsletter (subscribe for free)
RSS Feeds
New issue alerts
Contact us About Inderscience OAI Repository Privacy and Cookies Statement Terms and Conditions Help Sitemap
© 2020 Inderscience Enterprises Ltd.
*
Firer, Steven, Rhodes University, South Africa Jacobsen, Ben, Massey University, New Zealand Li, Steven, RMIT University, Australia
Loudon, Geoffrey, Macquarie University, Australia Lu, Zhengfei, Peking University, China
Martin, Rand, Bloomsburg University, USA
Masih, Abul Mansur Mohammed, INCEIF, Malaysia Muoghalu, Michael, Pittsburg State University, USA Ngassam, Christopher, Grambling State University, USA
O'Connor, Neale, University of Hong Kong , Hong Kong SAR, China Onour, Ibrahim A., University of Khartoum, Sudan
Otchere, Isaac, Carleton University, Canada Pandey, I.M., Delhi University, India
Parnes, Dror, University of South Florida, USA Powell, John G., Massey University, New Zealand Russel, Philip, Philadelphia University , USA
Samaha, Khaled, American University in Cairo, Egypt Singh, Manohar, Penn State University, USA
Soonawalla, Kazbi, London School of Economics and Political Science, UK Sutcliffe, Charles, University of Reading, UK
Uliana, Enrico, University of Cape Town, South Africa Van Breda, Michael F., South Methodist University, USA Wu, Yangru, Rutgers University, USA
Zain, Mazlina, Multimedia University, Malaysia Zhang, Tianxi, Shanghai Jiaotong University, China
•
•
•
•
•
•
•
•
•
•
•
•
•
•
•
•
•
•
•
•
•
•
•
•
•
Return to top
Contact us About Inderscience OAI Repository Privacy and Cookies Statement Terms and Conditions Help Sitemap
© 2020 Inderscience Enterprises Ltd.
Afro-Asian Journal of Finance and Accounting > Published issues > 2020 Vol.10 No.1
Afro-Asian Journal of Finance and Accounting
2020 Vol.10 No.1
Pages Title and author(s)
1-23 Audit committee characteristics and earnings conservatism in banking sector: empirical study from GCC
Allam Mohammed Mousa Hamdan DOI: 10.1504/AAJFA.2020.104401
24-47 Measuring the effectiveness of selected corporate governance practices and their implications for audit quality: evidence from Qatar
Emad Awadallah
DOI: 10.1504/AAJFA.2020.104402
48-59 Financial constraints, corporate debt maturity and firm performance: the case of firms in Southeast Asian countries
Liem Nguyen; Canh Nguyen DOI: 10.1504/AAJFA.2020.104404
60-70 The determinant of capital adequacy ratio: empirical evidence from Vietnamese banks (a panel data analysis)
Pham Thi Xuan Thoa; Nguyen Ngoc Anh; Nguyen Khac Minh DOI: 10.1504/AAJFA.2020.104406
71-84 The herding behaviour on Pakistan stock exchange – using firm-level data Fasiha Kiran; Naimat U. Khan; Attaullah Shah
DOI: 10.1504/AAJFA.2020.104407
85-111 Empirical tests of the Fama-French five-factor model in Indonesia and Singapore
Irwan Adi Ekaputra; Bambang Sutrisno DOI: 10.1504/AAJFA.2020.104408
112-130 Impact of monetary policy announcements on bank index in India Sushma Priyadarsini Yalla; Karuna Jain; Som Sekhar Bhattacharyya DOI: 10.1504/AAJFA.2020.104414
Sign up for new issue alerts Subscribe/buy articles/issues View sample articles
Latest issue contents as RSS feed Forthcoming articles
Journal information in easy print format (PDF)
Publishing with Inderscience:
ethical guidelines (PDF)
Recommend to a librarian (PDF) Feedback to Editor
Find related journals
Keep up-to-date
Our Blog
Follow us on Twitter Visit us on Facebook
Our Newsletter (subscribe for free)
RSS Feeds
New issue alerts
Return to top
Empirical tests of the Fama-French five-factor model in Indonesia and Singapore
Irwan Adi Ekaputra*
Faculty of Economics and Business, Universitas Indonesia,
Depok, 16424, Indonesia Email: [email protected]
*Corresponding author
Bambang Sutrisno
Faculty of Economics and Business, Universitas Muhammadiyah Jakarta, Jln. KH. Ahmad Dahlan, Cirendeu, Jakarta, 15419, Indonesia
Email: [email protected] Email: [email protected]
Abstract: We examine the performance of the Fama-French three-factor (FF3) and five-factor (FF5) models in Indonesia and Singapore markets. We also investigate whether the book-to-market factor (HML) is redundant in both markets if profitability and investment factors are present. Different from previous studies, our empirical findings highlight that FF5 does not perform better than FF3 in explaining excess portfolio returns in both markets. Unlike the US market, we find that HML factor is not redundant in both markets. The results are robust for equally-weighted and value-weighted portfolios and also for various factor construction methods.
Keywords: asset pricing; five-factor; Indonesia; Singapore.
Reference to this paper should be made as follows: Ekaputra, I.A. and Sutrisno, B. (2020) ‘Empirical tests of the Fama-French five-factor model in Indonesia and Singapore’, Afro-Asian J. Finance and Accounting, Vol. 10, No. 1, pp.85–111.
Biographical notes: Irwan Adi Ekaputra is a Professor of Finance at the Faculty of Economics and Business, Universitas Indonesia. His research interests are predominantly in market microstructure, behavioural finance, asset pricing, and banking.
Bambang Sutrisno is a Lecturer at the Faculty of Economics and Business, Universitas Muhammadiyah Jakarta, Indonesia. He completed his MSM in Finance at the Faculty of Economics and Business, Universitas Indonesia, in 2016. His research interests are asset pricing and corporate finance
1 Introduction
Sharpe (1964), Lintner (1965), Mossin (1996) and Black et al. (1972) are the pioneers of the capital asset pricing model (CAPM). It has an essential contribution to the understanding of the risk and return relationship, both for academicians and practitioners.
The systematic risk (beta) is the sole factor explaining the variation in stock returns.
CAPM predicts that the expected return of a risky asset is positively related to beta.
Along with the development of the CAPM, other studies have found that other risk factors can explain stock returns other than market beta. Fama and French (1993) developed the three-factor asset pricing model. This three-factor model includes market factor (excess market return), size factor [small minus big (SMB)] and book-to-market factor [high minus low (HML)]. SMB is the return of small-stock portfolio minus the return of big-stock portfolio, while HML is the return of value-stock portfolio minus the return of growth-stock portfolio.
Subsequent studies find empirical evidence that the three-factor model can explain the cross-section of stock returns well. These include, amongst others, Fama and French (1996, 1998), Liew and Vassalou (2000), Griffin and Lemmon (2002) and Lettau and Ludvigson (2001) and Petkova 2006). Therefore, the Fama-French three-factor model has become another benchmark model in the asset pricing literature.
Following their three-factor model, Fama and French (2015) introduced a five-factor asset pricing model. The five-factor asset pricing model is motivated by the development of dividend discount model and previous empirical findings, that much of variation in average returns related to profitability and investment is left unexplained by the three-factor model. Hence, they augment two additional factors that can capture average returns: profitability and investment factors. Fama-French five-factor model takes the following form:
it ft i i mt ft i t i t i t i t it
R R a b R R s SMB h HML r RMW c CMA e (1) where Rit is the return on security or portfolio i for period t, Rft is the risk-free rate. The first three factors Rmt – Rft, SMBt and HMLt, are the market, size and value factors, respectively, introduced in Fama and French (1993). RMWt is the return difference between diversified portfolios of stocks with robust and weak profitability, CMAt is the return difference between diversified portfolios of stocks with low and high investment and eit is the error term.
Fama and French (2015) find that the five-factor model performs better than the three-factor model in explaining average returns in the US market. They also conclude that the book-to-market factor becomes redundant in describing average returns in the presence of the profitability and investment factors.
Some studies investigate the performance of the Fama-French five-factor model in different countries. For instance, Nichol and Dowling (2014) provide evidence for the UK; Nguyen et al. (2015) offer evidence for Vietnam; Chiah et al. (2016) give evidence for Australia; Guo et al. (2017) test the model in China; and Kubota and Takehara (2018) examine the model in Japan. These studies overall find that the five-factor model performs better than the three-factor model in explaining average returns. Additionally, Fama and French (2017) offer the empirical evidence on the performance of the five-factor model in 23 developed markets. They find that the five-factor model is better
than the three- and four-factor models in describing average returns. Furthermore, they also document that global models are inferior to local models.
As one of emerging countries in Asia, Indonesia operates one stock exchange which begins to grow among other Asian countries. The Indonesia stock exchange’s market capitalisation is $431.81 billion as of March 2018. Unfortunately, Indonesia stock market is thinly traded, hence non-trading and non-synchronous trading problems tend to exist (Dimson, 1979; Lo and MacKinlay, 1990). On the other hand, Singapore stock market is more liquid than Indonesia. Total market capitalisation value of stocks listed on the Singapore exchange is $680.08 billion in March 2018. Although the two markets differ in size, they are both relatively small compared to other developed markets in terms of market capitalisation and number of listed stocks.
Prior studies that examine the performance of the Fama-French three- and five-factor asset pricing models are conducted in one country or a group of countries with the same characteristics. To the best of our knowledge, this study is the first to compare Fama-French models in two countries with different market development level within the same region, namely Indonesia and Singapore. This study sheds lights on the external validity of the Fama-French models in relatively small emerging and developed markets in Asia. As an emerging market, Indonesia has less liquidity and higher market volatility compared to Singapore. This study also investigates whether the book-to-market factor (HML) is redundant in describing average returns in both markets.
Different from previous studies in other countries, our main findings show that the five-factor model does not perform better than the three-factor model in explaining excess portfolio returns in both Indonesia and Singapore markets. Different from Fama and French (2015), we find that the book-to-market factor is not redundant when profitability and investment factors are included in the model. Our results are robust for value-weighted and equally-weighted portfolios and for various factor construction methods.
The remainder of this paper is organised as follows. Section 2 describes data and methodology. Section 3 presents and discusses the empirical results. Section 4 concludes the paper.
2 Data and methodology
2.1 Data
The data is obtained from the Datastream database. Our data source is not affected by the survivorship bias because the Datastream sample includes not only active firms but also dead firms (Cakici et al., 2013). The sample period is from July 2000 to June 2015. This study utilises closing price, the number of outstanding shares, stock price index, the book value of equity, risk-free rate, operating income, interest expense and total assets.
Following Fama and French (2015), we only include non-financial sector stocks as our sample. All stocks with a negative book value of equity are also omitted from the sample. Also, stocks must have data on operating income, interest expense and book value of equity in the previous year (t – 1). The selected stocks must also have data on total assets in year t – 2 and t – 1.
The number of stocks included in the sample differs between the two countries and it increases over time. In 2000 there are 118 stocks included from Indonesia and 165 stocks
from Singapore. In 2014 there are 353 stocks included from Indonesia and 469 stocks from Singapore. The risk-free rates used in this study are monthly data of ninety days Sertifikat Bank Indonesia (SBI) for Indonesia and three-month treasury bill rate for Singapore.
2.2 Methodology
We conduct a time-series test to assess the performance of the Fama-French three- and five-factor models. We construct 25 portfolios using Indonesia and Singapore stock data for each year. We form three portfolios based on:
1 size and book-to-market ratio (Size-B/M) 2 size and operating profitability (Size-OP) 3 size and investment (Size-Inv).
To form the 25 Size-B/M portfolios, at the end of June every year, we rank the stock data by market capitalisation and divide the sample into five equal-Size portfolios.
Independently, we compute the book-to-market ratio for each stock in the sample and divide them into five equal-B/M portfolios. The 25 Size-B/M portfolios are the combinations of five portfolios formed based on size and five portfolios formed based on the book-to-market ratio. The 25 Size-OP (25 Size-Inv) portfolio is constructed in similar fashion, except that the second sort variable is operating profitability (OP) (investment).
After building all three portfolios, we calculate the portfolios’ value-weighted monthly returns. The excess portfolio return is the portfolio return minus the risk-free rate. The portfolio will be rebalanced every end of June each year.
We construct the asset pricing factors based on 2 × 3 sorts. Market factor (excess market return) is the difference between the market return and the risk-free rate.
Following Fama and French (2015), SMB is the average return on the nine small stock portfolios minus the average return on the nine big stock portfolios. HML is the average return on the two value portfolios minus the average return on the two growth portfolios.
Robust minus weak (RMW) is the average return on the two robust OP portfolios minus the average return on the two weak OP portfolios. Conservative minus aggressive (CMA) is the average return on the two conservative investment portfolios minus the average return on the two aggressive investment portfolios. We employ the value-weighted method to compute monthly factor returns. The following equations are the measures of asset pricing factors.
( / ) ( ) ( )
3
SMBB M SMBOP SMBINV
SMB (2)
( ) ( )
2 2
Small value big value Small growth big growth
HML (3)
( ) ( )
2 2
Small robust big robust Small weak big weak
RMW (4)
( ) 2
( )
2
Small conservative big conservative CMA
Small aggressive big aggressive (5)
We employ both the Fama-French three- and five-factor models to compare their performance. The three- and five-factor models are as follows.
pt ft p p mt ft p t p t pt
R R a b R R s SMB h HML e (6)
pt ft p p mt ft p t p t p t p t pt
R R a b R R s SMB h HML r RMW c CMA e (7) where Rpt – Rft is the excess portfolio return, Rft is the risk-free rate, Rmt – Rft is market factor, SMBt is size factor, HMLt is book-to-market factor, RMWt is profitability factor, CMAt is investment factor and ept is the error term.
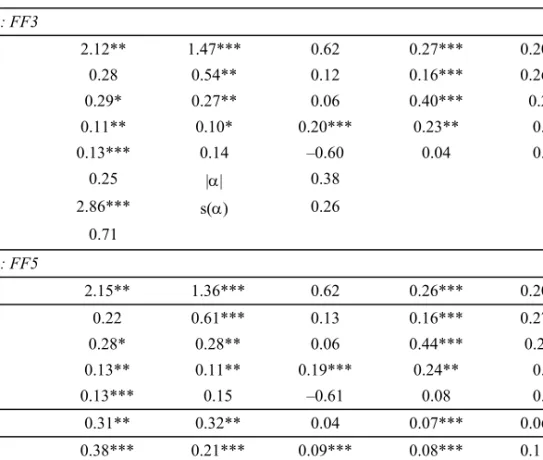
This study employs ordinary least squares adjusted for the Newey and West (1987) heteroscedasticity-consistent covariance matrix. We use some criteria in examining the performance of the Fama-French three- and five-factor models in both Indonesia and Singapore. Following Merton (1973), a well-specified asset pricing model produces an intercept that is insignificantly different from zero. We test this by computing the F-statistic of GRS test (Gibbons et al., 1989). The formula to calculate the GRS statistic is as follows:
' 1
' 1 ( , )
1 1
T T N L
GSR F N T N L
N T L μ μ
(8)
where T is the number of observations, N is the number of portfolios to be explained, L is the number of asset pricing factors, is a vector of regression intercepts,
is anunbiased estimate of the residual covariance matrix, μ is a vector of the factor portfolios’
sample mean and ‘ is the sample covariance matrix of the asset pricing factors. Under the null hypothesis that all regression intercepts are equal to zero, the GRS test statistic has an F distribution with N and T – N – L degrees of freedom.
We also employ the Sharpe ratio as recommended by Lewellen et al. (2010) to compare the Fama-French models. The Sharpe ratio takes the following equation.
' 1 1/2
( )
SR S (9)
where is the column vector of the 25 regression intercepts estimated by each model and S is the covariance matrix of the associated regression residuals. The smaller the Sharpe ratio, the better the model. We also compare the average adjusted R2, the average absolute value of the intercepts and the average standard error of the intercepts to suggest which model is better.
To examine whether the book-to-market factor (HML) is redundant or not in explaining the excess portfolio returns in both Indonesia and Singapore, we regress HML on the other four factors. If the intercept of HML is close to zero and insignificant, this means that HML has little or no information about average returns not captured by the other factors of the four-factor model. Standard asset pricing theory then tells us that HML is redundant in describing average returns.
We check the robustness of our main regression results by using equally-weighted portfolios and alternative factor construction methods. We employ equally-weighted portfolios to calculate asset pricing factors and excess portfolio returns and 2 × 2 and 2 × 2 × 2 × 2 sorts on asset pricing factors to check the robustness of the results.
3 Empirical results
3.1 Descriptive statistics
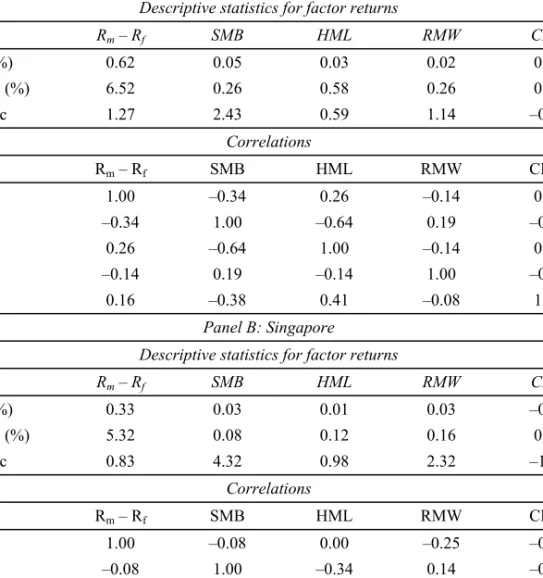
Table 1 reports descriptive statistics and time-series correlations between the factors.
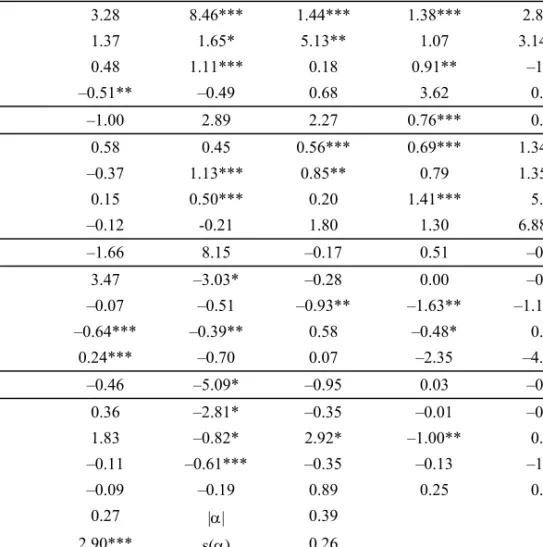
Panel A shows that only size factor has a significant positive mean return in Indonesia.
This indicates that small-cap stocks generate superior returns compared to big-cap stocks.
Meanwhile, Panel B indicates that size and profitability factors have significant positive mean returns in Singapore. This suggests that small stocks outperform big stocks and stocks with higher OP generate higher returns than stocks with lower OP. In Indonesia (Panel A), size and profitability factors are negatively correlated with the market factor, while value and investment factors show positive correlations with the market factor.
Value and investment factors are negatively correlated with size factor. Value factor is negatively correlated with profitability factor and positively correlated with investment factor. In Singapore (Panel B), profitability and investment factors are negatively associated with the market factor, while value factor displays a positive correlation with the market factor. Value and investment factors are negatively correlated with size factor, while profitability factor is positively correlated with size factor. Moreover, profitability and investment factors are positively correlated with value factor.
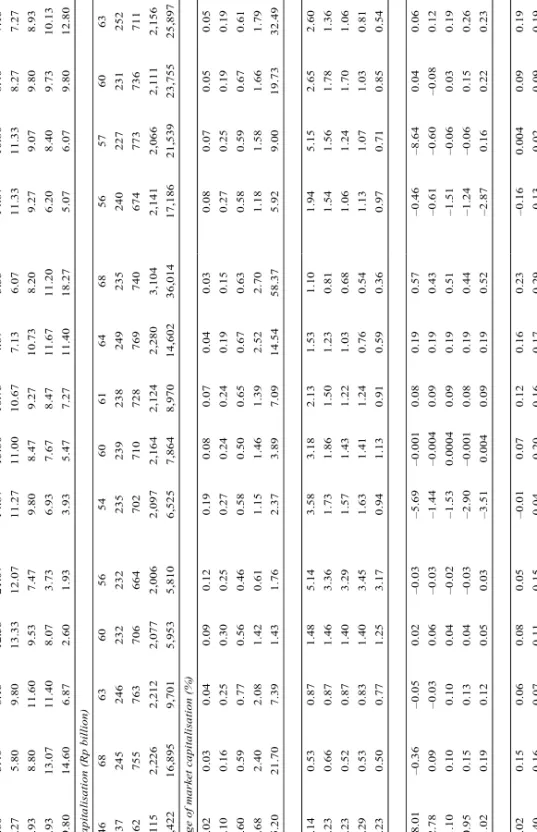
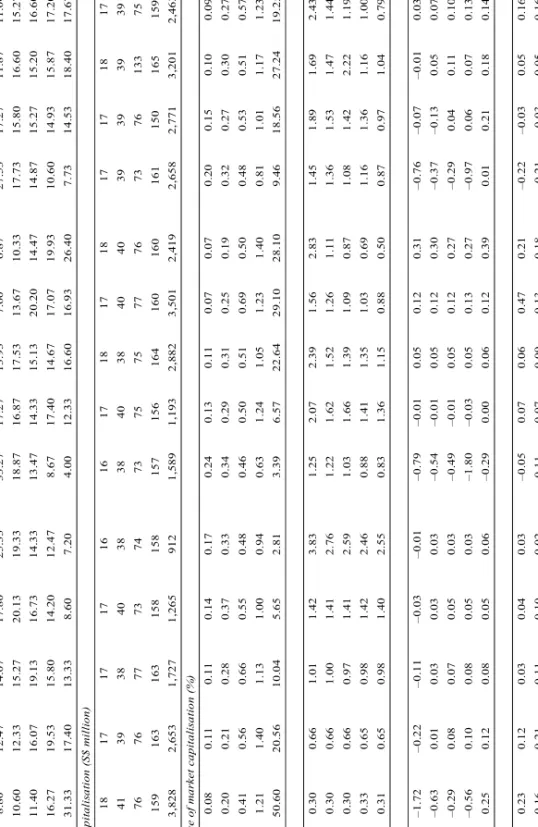
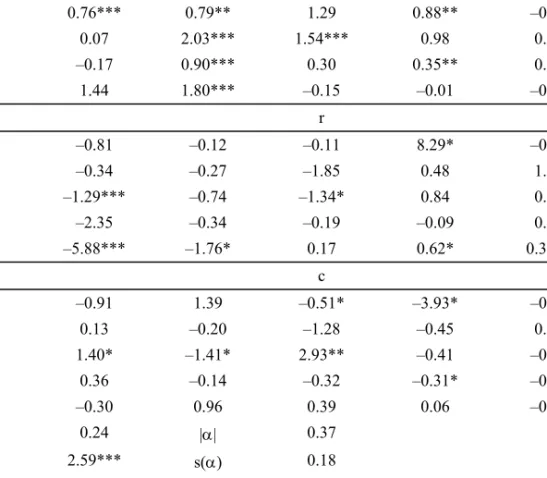
We report the characteristics of each set of the 25 portfolios in Indonesia and Singapore in Tables 2 and 3 respectively. Panel A of Table 2 shows that the highest number of stock generally is in the smallest size portfolios. Panel B of Table 2 indicates that size is well controlled across book-to-market, OP and investment portfolios. Panel C of Table 2 demonstrates that the percentage of market capitalisation allocated to each size portfolio is consistent with the definition of their quintiles. Panel D, E and F of Table 2 report the average book-to-market, OP and investment in each set of the 25 portfolios, respectively. Stocks with low OP have higher book-to-market ratio compared to stocks with high OP. The negative relationship between book-to-market ratio and OP is consistent with Novy-Marx (2013). Stocks with low book-to-market ratio invest aggressively and stocks with high book-to-market ratio invest conservatively. Stocks with low investment have lower OP than stocks with high investment. Panel A, B and C of Table 3 exhibit the similar characteristics to Panel A, B and C of Table 2. Panel D, E and F of Table 3 depict that stocks with low book-to-market ratio tend to show higher investment than stocks with high book-to-market ratio. Stocks with high OP tend to invest more aggressively than stocks with low OP.
Average monthly excess returns for each set of the 25 portfolios are presented in Table 4. Panel A and B display the results for Indonesia and Singapore, respectively. In Panel A, 25 Size-B/M portfolios reveal that average excess return decreases from small stocks to big stocks for the first three column of B/M. This finding indicates that the size effect exists. For the other two portfolios in the highest B/M column, the average excess return increases from small stocks to big stocks. The value effect appears in the last two Size quintiles in which the average excess return increases with B/M. For 25 Size-OP
portfolios, the extremely high OP portfolio has higher average excess return than extreme low OP portfolios, except for the last two Size quintiles. The extreme high OP shows that the average excess return decreases from small stocks to big stocks. There is a size effect in the extremely high OP. In the highest Inv quintile, average excess return falls from small stocks to big stocks. This finding indicates that the size effect is also found in the highest Inv quintile. In Panel B, 25 Size-B/M portfolios show that there is only a size effect in the lowest B/M quintile. The value effect only appears in the big Size quintile.
For 25 Size-OP portfolios, the size effect exists in the extremely high OP. In the smallest Size quintile, the average excess return rises with OP. The size effect exists in the two highest Inv quintiles.
Table 1 Descriptive statistics and correlations between the factors Panel A: Indonesia
Descriptive statistics for factor returns
Rm – Rf SMB HML RMW CMA
Mean (%) 0.62 0.05 0.03 0.02 0.00
Std dev. (%) 6.52 0.26 0.58 0.26 0.30
t-statistic 1.27 2.43 0.59 1.14 –0.07
Correlations
Rm – Rf SMB HML RMW CMA
Rm – Rf 1.00 –0.34 0.26 –0.14 0.16
SMB –0.34 1.00 –0.64 0.19 –0.38
HML 0.26 –0.64 1.00 –0.14 0.41
RMW –0.14 0.19 –0.14 1.00 –0.08
CMA 0.16 –0.38 0.41 –0.08 1.00
Panel B: Singapore
Descriptive statistics for factor returns
Rm – Rf SMB HML RMW CMA
Mean (%) 0.33 0.03 0.01 0.03 –0.01
Std dev. (%) 5.32 0.08 0.12 0.16 0.10
t-statistic 0.83 4.32 0.98 2.32 –1.08
Correlations
Rm – Rf SMB HML RMW CMA
Rm – Rf 1.00 –0.08 0.00 –0.25 –0.05
SMB –0.08 1.00 –0.34 0.14 –0.17
HML 0.00 –0.34 1.00 0.30 0.10
RMW –0.25 0.14 0.30 1.00 0.12
CMA –0.05 –0.17 0.10 0.12 1.00
Notes: We construct factor returns from 2 × 3 sorts. The factors are Rm – Rf (market excess return), SMB, HML B/M, RMW OP and conservative minus aggressive (CMA) inv.
Table 2 Characteristics of each set of the 25 portfolios in Indonesia
Size-B/M portfolios Size-OP portfolios Size-Inv portfolios Low 23 4High Low 2 3 4 HighLow 23 4 High Panel A: Number of stocks Small 3.603.40 6.1312.53 21.07 14.8713.6010.73 4.673.3314.67 10.808.40 7.135.40 2 4.275.80 9.8013.33 12.07 11.2711.0010.67 7.136.0711.33 11.338.27 7.277.93 3 8.938.80 11.609.537.479.80 8.479.2710.738.209.279.079.80 8.939.13 4 9.9313.0711.408.073.736.937.67 8.4711.6711.20 6.208.409.73 10.1311.80 Big19.80 14.606.87 2.601.933.93 5.477.2711.4018.27 5.076.079.80 12.8012.47 Panel B: Market capitalisation (Rp billion) Small 4668 636056 54 6061 646856 57 606365 2 237245246 232 232 235239238249235 240227231252 249 3 762755763 706 664 702710728769740 674773736711 741 4 2,115 2,226 2,2122,077 2,006 2,0972,1642,124 2,2803,1042,141 2,066 2,111 2,1562,207 Big30,42216,8959,7015,953 5,810 6,5257,8648,970 14,602 36,01417,186 21,53923,75525,89713,755 Panel C: Percentage of market capitalisation (%) Small 0.020.03 0.040.090.120.190.08 0.070.04 0.030.080.070.05 0.050.05 2 0.100.16 0.250.300.250.270.24 0.240.19 0.150.270.250.19 0.190.20 3 0.600.59 0.770.560.460.580.50 0.650.67 0.630.580.590.67 0.610.59 4 1.682.40 2.081.420.611.151.46 1.392.52 2.701.181.581.66 1.792.16 Big55.20 21.707.39 1.431.762.37 3.897.09 14.5458.37 5.92 9.0019.7332.4920.03 Panel D: B/M Small 0.140.53 0.871.485.143.583.18 2.131.53 1.101.945.152.65 2.601.85 2 0.230.66 0.871.463.361.731.86 1.501.23 0.811.541.561.78 1.361.47 3 0.230.52 0.871.403.291.571.43 1.221.03 0.681.061.241.70 1.060.88 4 0.290.53 0.831.403.451.631.41 1.240.76 0.541.131.071.03 0.810.94 Big0.230.50 0.771.253.170.941.13 0.910.59 0.360.970.710.85 0.540.57 Panel E: OP Small –38.01–0.36–0.050.02–0.03 –5.69–0.0010.080.19 0.57–0.46 –8.640.04 0.060.16 2 –2.78 0.09–0.030.06–0.03 –1.44–0.0040.090.19 0.43–0.61 –0.60–0.080.12 0.14 3 –1.10 0.100.10 0.04–0.02 –1.530.00040.090.19 0.51–1.51 –0.060.03 0.190.20 4 –0.95 0.150.13 0.04–0.03 –2.90–0.0010.080.19 0.44–1.24 –0.060.15 0.260.18 Big–1.02 0.190.12 0.050.03–3.510.0040.09 0.190.52–2.87 0.160.22 0.230.26 Panel F: Inv Small 0.020.15 0.060.080.05–0.01 0.070.12 0.160.23–0.16 0.004 0.090.19 0.67 2 0.400.16 0.070.110.150.040.20 0.160.17 0.29–0.13 0.02 0.090.19 0.87 3 1.900.39 2.550.200.232.650.19 0.171.57 0.34–0.14 0.01 0.090.19 4.64 4 0.450.32 0.380.220.420.350.90 0.200.22 0.24–0.12 0.01 0.090.19 1.22 Big0.382.53 3.830.140.091.543.76 0.260.20 0.27–0.15 0.01 0.090.19 3.99