Background of Study
Company Profile
PT Mediatama BinaKreasi is one of the largest international event and congress organizers in Indonesia, duly established and existing on April 21, 1989. PT Mediatama BinaKreasi is recognized for our highly dedicated, professional and high quality services in organizing national and international events. events. With the support of experienced and qualified human resources, PT Mediatama BinaKreasi is doing its best to realize our motto "Your business is our mission" to meet the expectations of our customers in promoting their products and services.
PT MEDIATAMA BINAKREASI not only manages routine exhibitions but also provides "full service" starting from promotion concept, planning, management, marketing, data collection to exhibition report to meet primary expectations. In the preparation of the exhibition, PT Mediatama BinaKreasi makes more innovative, integrated, comprehensive, attractive and effective designs from the form of the stand, the management of the flow of visitors (entrance and exit), etc. To support exhibition and convention requirements, PT Mediatama BinaKreasi can also manage the provision of graphic design and product design in terms of printed materials and internal and external promotional media such as annual report, promotional balloon, banner, etc., for a successful exhibition and convention.
PT Mediatama BinaKreasi typically works on 8-12 projects per year, with each project overseen by one dedicated project officer who reports directly to the Director of Operations. PT Mediatama BinaKreasi already trusts ASEPHI (Association of Exporters and Producers of Indonesian Crafts) as the capital bearer to organize this exhibition.
Problem Identification
Respondents who answered "Very satisfied" were 7 respondents (14%) Respondents who answered "Satisfied" were 15 respondents (30%), 20 respondents who answered neutral (40%), 5 respondents answered "Dissatisfied" ( 10%) and 3 answered respondents answered. Respondents who answered “Very satisfied” were 1 respondents (2%) Respondents who answered “Satisfied” were 20 respondents (40%), 15 respondents who answered neutral (30%), 11 respondents answered. Respondents who answered "Very satisfied" were 9 respondents (18%) Respondents who answered "Satisfied" were 22 respondents (44%), 14 respondents who answered neutral (28%), 3 respondents answered "Dissatisfied" ( 6%) and 2 answered respondents answered.
Respondents who answered "Very satisfied" were 6 respondents (12%) Respondents who answered "satisfied" were 19 respondents (38%), 20 respondents who answered neutral (40%), 4 respondents answered "Dissatisfied" (8% ) and 1 answered the respondents. Respondents who answered “Very satisfied” were 6 respondents (12%) Respondents who answered “satisfied” were 26 respondents (52%), 14 respondents who answered neutral (28%), 3 respondents answered. Respondents who answered "Very satisfied" were 4 respondents (8%) Respondents who answered "satisfied" were 24 respondents (48%), 16 respondents who answered neutral (32%), 5 respondents answered "Dissatisfied" (10% ) and 1 respondents answered "Very dissatisfied" (2%).
Respondents who answered "Very satisfied" were 7 respondents (14%) Respondents who answered "Satisfied" were 25 respondents (50%), 16 respondents who answered neutral (32%), 2 respondents answered "Unsatisfied" (4%) and 0 respondents answered. Respondents who answered "Very satisfied" were 5 respondents (10%) Respondents who answered "Satisfied" were 24 respondents (48%), 17 respondents who answered neutral (34%), 4 respondents answered "Unsatisfied" 8%) and 0 respondents. answered "Very dissatisfied" (0%). Respondents who answered "Very satisfied" were 4 respondents (8%) Respondents who answered "Satisfied" are 24 respondents (48%), 14 respondents who answered neutral (28%), 8 respondents answered "Unsatisfied" (16%) and 0 respondents answered "Very dissatisfied" (0%).
Respondents who answered “Very satisfied” were 7 respondents (14%), Respondents who answered “Satisfied” were 10 respondents (20%), 12 respondents who answered neutral (24%), 14 respondents answered “Dissatisfied” (28%) and 7 respondents answered “Very dissatisfied” (14%). Respondents who answered “Very satisfied” were 6 respondents (12%), Respondents who answered “Satisfied” were 11 respondents (44%), 8 respondents who answered neutral (16%), 17 respondents answered “Dissatisfied” (34%) and 8 respondents answered “Very dissatisfied” (16%). Very satisfied” were 11 respondents (22%). Respondents who answered “Satisfied” were 28 respondents (56%), 7 respondents who answered neutral (14%), 2 respondents answered “Dissatisfied” (4%) and 2 respondents answered “Very satisfied”. Dissatisfied” (4%).
Statement of Problem
Research Objectives
To elaborate the dominant factor from the tangible dimension of service quality influence to exhibitor satisfaction at Crafina exhibition. To elaborate the dominant factor from the Emphaty dimension of the influence of Service Quality on exhibitor satisfaction at the Crafina exhibition. To elaborate the dominant factor from the reliability dimension of the influence of service quality on exhibitor satisfaction at Crafina exhibition.
To elaborate the dominant factor from the Responsiveness dimension of the Service Quality impact on exhibitor satisfaction at the Crafina exhibition. To elaborate the dominant factor from the Assurance dimension of Service Quality impact on exhibitor satisfaction at Crafina exhibition.
Significance of the Study
Theoretical Framework
Scope and Limitation of the Study
Definition of Terms
LITERATURE REVIEW
Service Quality
Service quality is a concept that has attracted considerable interest and debate in the research literature due to the difficulties in defining and measuring it, with no overall consensus emerging on either (Naumann, 1995 p.90). Service quality is very important for the company to attract more new customers and retain old customers. The construct of service quality as a conceptualized in the service marketing literature centers on perceived quality, defined as a consumer's judgment of an entity's overall excellence or superiority (Zeithaml, 1987 p.21) According to Edvardsson (1988), service must match the customers'.
Based on Lewis, Booms (1983), service quality is defined as 'a measure of how well a delivered service meets customer expectations'.
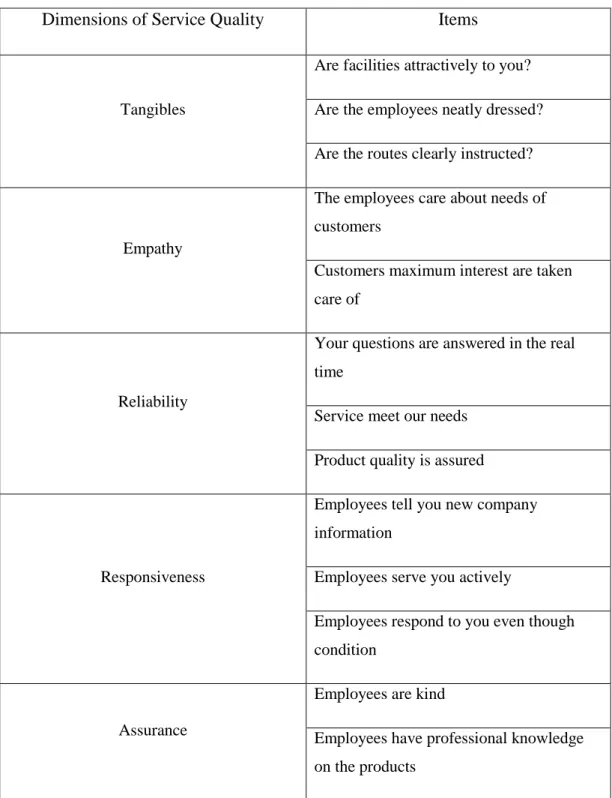
Dimensions of Service Quality
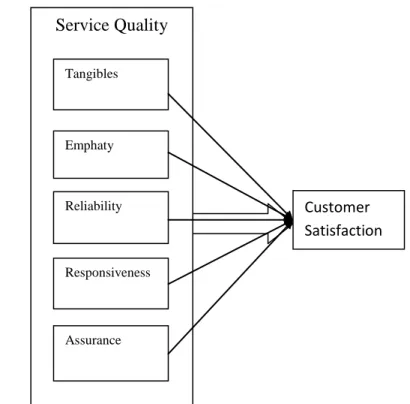
The author has found that consumers mainly consider five dimensions in their assessment of service quality, based on Zeitahml, 2000, the five specific service quality dimensions are. The essence of material things in service quality is two-dimensional, one focuses on equipment and facilities, the other focuses on personnel and communication and materials. The essence of empathy is conveyed through personalized or customized, that customers are unique and special.
Reliability represents the service provider's ability to perform the service reliably and accurately; this includes qualities such as reliability, consistency, accuracy, 'right first time', and so on. The essence of reliability is consistently the most important pursuit of service quality among customers. Responsiveness represents the willingness to help customers and provide timely service, this includes helpfulness, friendliness, warmth, willingness, and so on.
The essence of responsiveness refers to the willingness and/or willingness of employees to provide a service. Assurance represents the knowledge and courtesy of employees and their ability to inspire confidence in the customer, which includes competence, experience, skills, credibility, honesty and security of all kinds (physical, financial, confidential, etc.).
Measuring and Improving Service Quality.…
Employee surveys and panels to determine perceptions of the quality of service delivered to customers on specific dimensions, barriers to better service and suggestions for improvement.
Customer Satisfaction
It is a judgment that a feature of a product or service, or the product itself, has provided (or provides) a pleasurable level of consumption-related fulfillment, including levels of under- or over-fulfillment. Based on their positive past experiences, these types of satisfied customers hope that the service provider will be able to meet their increasing expectations in the future. Moreover, they are willing to extend their relationship with the service provider in the future.
But loyalty will be based on the service provider's ability to improve their performance to balance with customer expectations. This type of consumer tends to be passive, they will not give any effort to change the situation that has arisen. Their relationship with the service provider is filled with negative feelings and an assumption that their expectations cannot be met in the future.
At the same time, they also do not have to be loyal to the service provider. Based on the negative experience, they will not choose the same service provider in the future.
Service Quality and Customer Satisfaction
RESEARCH METHODOLOGY
Research Method
Based on www.investopedia.com, quantitative analysis refers to a business or financial analysis technique that attempts to understand behavior using complex mathematical and statistical models, measurements and research. Meanwhile, also based on www.investopedia.com, qualitative analysis is an effects analysis that uses subjective judgment based on non-quantifiable information, such as management expertise, industry cycles, the strength of research and development, and labor relations. The author's quantitative goal is to develop and use mathematical models, theories and/or hypotheses regarding natural phenomena.
The measurement process is central to quantitative research because it provides the fundamental link between empirical observation and mathematical expression of quantitative relationships.
Research Instrument
Sampling Design
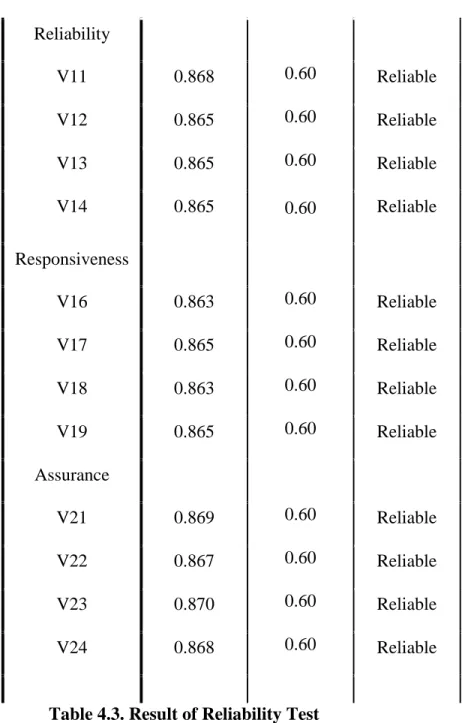
Because the questionnaire in this research is a self-constructed questionnaire, the validity and reliability test must be performed. Validity testing shows how far the instrument (in this study is questionnaire) can measure, which questions in the questionnaire are the exact question that must be asked to the respondents in order to achieve the research objective. If r count > r table , then the question is valid. If r count< r table , then the question is invalid.
Reliability is used to measure how far the measurement result is relatively consistent if the measurement is performed a second time or more.
Limitations
ANALYSIS OF DATA AND INTERPRETATION OF RESULT….28
Tangibles variable
Emphaty variable …
Reliability variable
Responsiveness variable
Assurance variable
Ratio of weighted mean of each variable
From Chapter IV "Analysis Data and Interpretation Results", the weighted mean value of the tangible dimension is 3.06, which is included Moderate. This means that the appearance of physical facilities, equipment, staff and communication material is so standard, but not bad for the exhibitor as well. From Chapter IV "Analysis Data and Interpretation Results", weighted average of Emphaty dimension is 3.575 which is inclusive of Good Satisfaction.
From Chapter IV "Analyzing Data and Interpreting Results", the weighted mean of Reliability dimension is 3.625 which includes Good satisfaction. From Chapter IV "Analysis Data and Interpret Results", the weighted average of Responsiveness dimension is 3.495 which includes Good satisfaction. From Chapter IV “Analysis Data and Interpret Results”, the weighted mean of Assurance dimension is 3.40 which includes Moderate.
This means that the knowledge and friendliness of the employees and their ability to instill confidence in the customer is so standard, but not bad for the exhibitor either. Especially in the statement that shows skills and competences, PT MBK needs to improve them. From the weighted mean, the weakest dimension is the material dimension, which has a weighted mean of 3.06, including moderate.
Therefore, the PT MBK must organize the training to improve their performance on this dimension, at least until the level shows the good satisfaction level. Based on the results, PT MBK should improve the tangible aspects and assurance dimensions from moderate to good satisfaction. To be sure, the skills and competence of PT MBK employees cannot increase the exhibitor's trust towards the employees.
On the other hand, PT MBK should maintain the good satisfaction or maybe they can improve to very good satisfaction. For the next analysis, I hope this thesis will help them make their thesis easily understandable. For the researcher who wants to distribute a questionnaire at the Crafina exhibition about the staff of PT MBK and also for the one who conducts data analysis with dominant factors using multiple regression.
CONCLUSION AND RECOMMENDATION
Conclusion
Recommendations